
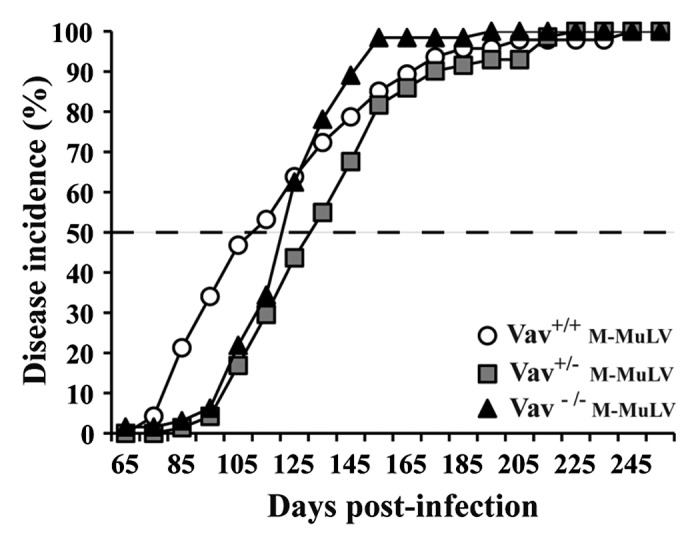
Figure 1. Survival and tumor incidence in mice after M-MuLV infection. Vav1+/+ (n = 44), Vav1+/− (n = 72) and Vav1−/− (n = 48) mice were infected with M-MuLV. The graph shows the cumulative incidence of leukemia based on enlarged lymphoid organs and hematocrit levels.