Abstract
Due to its extreme lipophilicity, the oral delivery of cinnarizine (CN) encounters several problems such as poor aqueous solubility and pH-dependent dissolution, which result in low and erratic bioavailability. The current study aims to design self-nanoemulsifying drug delivery systems (SNEDDS) of CN that circumvent such obstacles. Equilibrium solubility of CN was determined in a range of anhydrous and diluted lipid-based formulations. Dynamic dispersion tests were carried out to investigate the efficiency of drug release and magnitude of precipitation that could occur upon aqueous dilution. Droplet sizes of selected formulations, upon (1:1,000) aqueous dilution, were presented. The optimal formulations were enrolled in subsequent dissolution studies. The results showed that increasing lipid chain length and surfactant lipophilicity raised the formulation solvent capacity, while adding co-solvents provoked a negative influence. The inclusion of mixed glycerides and/or hydrophilic surfactants improved the drug release efficiency. Generally, no significant precipitation was observed upon aqueous dilution of the formulations. Five formulations were optimal in terms of their superior self-emulsifying efficiency, drug solubility, dispersion characteristics, and lower droplet size. Furthermore, the optimal formulations showed superior dissolution profile compared to the marketed (Stugeron®) tablet. Most importantly, they could resist the intensive precipitation observed with the marketed tablet upon shifting from acidic to alkaline media. However, SNEDDS containing medium-chain mixed glycerides showed the highest drug release rate and provide great potential to enhance the oral CN delivery. Accordingly, the lipid portion seems to be the most vital component in designing CN self-nanoemulsifying systems.
Electronic supplementary material
The online version of this article (doi:10.1208/s12249-012-9821-4) contains supplementary material, which is available to authorized users.
Keywords: cinnarizine, lipid-based formulations, oral drug delivery, SNEDDS, solubility enhancement
INTRODUCTION
Nanotechnology has become a buzzword for scientific experts, and efforts are ongoing to extend its applications in various medical and pharmaceutical aspects. The nanoscale technologies can be generally categorized into lipid-based nanocarriers, polymeric nanocarriers, inorganic nanocarriers, and drug nanoparticles or nanosuspensions (1). Within the lipid-based nanocarriers category, there has been a resurgence of interest in nanoemulsions since low-energy emulsification methods, such as spontaneous or self-nanoemulsification, have been developed. Self-nanoemulsifying drug delivery systems (SNEDDS) are anhydrous homogeneous liquid mixtures, composed of oil, surfactant, drug, and/or cosolvents, which spontaneously form transparent nanoemulsion (20–200 nm droplet size) upon aqueous dilution with gentle agitation (1,2).
Almost two thirds of the new drug candidates are poorly water soluble, which is commonly associated with low bioavailability, high intra- and inter-subject variability, and lack of dose suitability (3,4). Lipid-based formulations offer the opportunity to enhance the absorption and therefore the oral bioavailability of such lipophilic drugs (5,6). Being nanosized, SNEDDS offer a strong alternative to the more conventional oral formulations of lipophilic compounds. This system is expected to self-emulsify quickly in the stomach aqueous contents. Thus, it introduces the drug in solution within nanosized oil droplets. These fine droplets would be emptied rapidly from the stomach resulting in faster drug release all over the GI tract. An additional advantage of SNEDDS over simple oily solutions is granting much larger interfacial area for partitioning of the drug between oil and water, leading to ease of dispersibility (7). In contrast to oily solutions, SNEDDS does not depend on the action of bile salts, enzymes, and/or other effects related to the (fed/fasted) state of the stomach (8). Thus, SNEDDS can reduce the variability in rate and extent of absorption and grant more reproducible plasma concentration levels (6).
Compared with conventional nanoemulsions, SNEDDS can offer the advantages of improved physical and/or chemical stability of the formulation and ability to fill them into unit dosage forms, such as soft/hard capsules, which improves their commercial viability and patient compliance/tolerability and minimizes palatability-related concerns (1).
A vital feature of a successful SNEDDS formulation is its capability to hold the drug in solution, throughout the GIT, for sufficient time to allow for absorption (9). Many poorly water-soluble drugs (PWSDs) have high solubility in SNEDDS formulations but could make a risk of precipitation after aqueous dispersion of the formulation or during its digestion in the intestine (10).
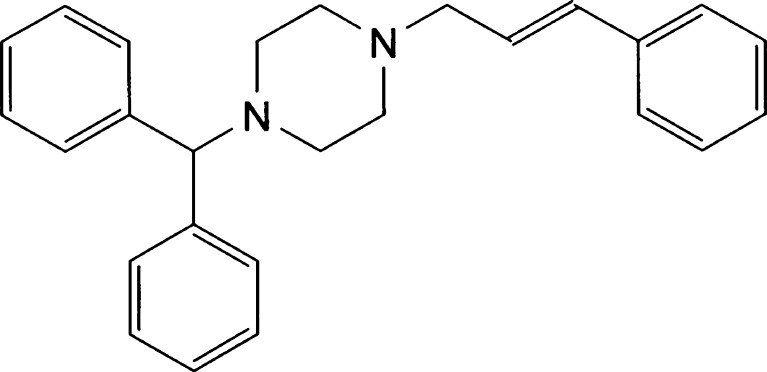
The model drug for the current study had been selected from the biopharmaceutical classification system class II (9). Cinnarizine (CN, Fig. 1), an antihistaminic drug, was an attractive candidate for the current study because it is a very lipophilic compound with partition coefficient; log P = 5.8 (11). CN is practically insoluble in water (aqueous solubility < 1 μg/ml) with high absorption rate (12,13). The current commercially marketed dosage forms are tablets and capsules. Both of these exhibit low and erratic oral bioavailability, which is mainly due to the poor and pH-dependent dissolution of the drug (14–16). Accordingly, the oral delivery of CN is expected to be greatly enhanced through the use of SNEDDS.
Fig. 1.
The chemical structure of cinnarizine
The prime objective of the present study is to develop suitable SNEDDS that are able to rapidly present and maintain CN in solution after aqueous dispersion. This study seeks to explore the relationship between the “type” of lipid-based formulation, as described in the lipid formulation classification system (LFCS) (5,9), and their ability to solubilize, release, and maintain sufficient amount of drug in solution.
MATERIALS AND METHODS
Materials
Miglyol 810 (M810, medium-chain triglyceride), Imwitor 988 (I988, medium-chain mono- and diglycerides), Imwitor 308 (I308, medium-chain monoglycerides) were kindly supplied by Sasol Germany GmbH (Werk Witten, Witten-Germany). Captex 355 (Cap355, medium-chain triglycerides) and soybean oil (soy, long-chain triglycerides) were kindly donated by Abitec (Columbus, USA) and Croda (East Yorkshire, UK), respectively. Maisine 35/1 (M-35, long-chain monoglycerides) was kindly supplied by Gattefossé (Saint Priest, France). Long-chain fatty acids, oleic acid (OL) and linoleic acid (LN), were obtained from Avonchem and Fluka Chemie, respectively. Propylene glycol (PG), Tween 80 (T80, HLB = 15), and Tween 85 (T85, HLB = 11) were obtained from Winlab, BDH, and Merck-Schuchardt, respectively. HCO-30 (HLB = 11) was a gift from Nikko Chemicals Co. (Tokyo, Japan). Cremophor EL (Cr-EL, HLB = 12–14) was generously supplied by BASF (Ludwigshafen, Germany). Cinnarizine (CN) (purity > 99.5) was a gift from FDC Limited (Maharashtra, India). Vcaps Plus® HPMC capsules, size 0, were kindly supplied by Capsugel (South Carolina, USA).
Equilibrium Solubility Studies
The formulations, investigated in the current study, were categorized according to the lipid chain length as well as LFCS, which is thoroughly discussed in previous publications (5,9). The equilibrium solubility of CN within various lipid formulations was determined using the shake flask method (10,17). After a 7-day period allowed for equilibration, samples were withdrawn from each tube for solubility determinations. Each sample was centrifuged in 1.5-ml Eppendorf tubes using Micro 20 Centrifuge (Hettich Zentrifugen, Germany) at 16,000×g for 15 min. Then, an aliquot of the supernatant was taken by weight for dilution in acetonitrile and assayed by ultraperformance liquid chromatography (UPLC).
Aside from determining CN solubility in the anhydrous formulations, diluted formulations were also investigated to determine their equilibrium solubility. Diluted formulations were prepared by adding successive amounts of water (10, 20, 30 up to 90 and 99%, w/w) to the anhydrous formulations. Then, the formulations were equilibrated with excess drug for 7 days and analyzed using the same procedure mentioned earlier (10). All the solubility studies have been conducted at room temperature (RT, 20 ± 2°C), and three replicate samples were considered for each formulation.
Dynamic Dispersion Studies
Dynamic dispersion studies were carried out as a preliminary assessment to examine if the formulations are able to release sufficient amount of the drug in solution when exposed to aqueous media. In addition, this study clearly shows whether the drug is precipitated during aqueous dispersion and, if so, to what extent and at what rate.
For the dispersion studies, the model drug (CN) was dissolved in each formulation at a concentration representing 80% of its equilibrium solubility. The 80% saturated formulation was further subjected to 1:100 aqueous dilution. The resulted dispersion was subsequently agitated and incubated at 37°C in thermostatically controlled water bath (SW22 Julabo, LABORTECHNIK GMBH, Germany) for 24 h. During this period, the dispersions were assayed periodically by UPLC to monitor precipitation (10).
Samples were withdrawn at 0, 0.25, 0.5, 1, 2, 4, 8, 12, and 24 h, and then centrifuged for 5 min at 16,000×g. An aliquot of the resulting supernatant was taken for dilution in acetonitrile prior to UPLC assay. Withdrawn samples were accurately replaced with equivalent fresh water volumes. All experiments were carried out in triplicates.
Droplet Size Analysis
The mean droplet size of the diluted formulations was measured, using a Brookhaven particle size analyzer (90 plus Brookhaven, USA). The formulations were diluted (in a ratio of 1:1,000 v/v) and mixed for 1 min before testing (4,18). A full droplet size study was carried out for a wide range of formulations in the authors’ recent study (19). The droplet size of selected formulations was presented and correlated with the findings of the current study.
Formulation Optimization
The optimal formulations were selected by balancing between the following requirements: rapid and efficient self-emulsifying ability, higher solubility of CN (at least 35 mg/g), maintaining high amount of CN in solution after aqueous dispersion (at least 85%), and lower droplet size upon aqueous dilution. The optimal formulations were then prepared by dissolving CN in the formulation mixtures. The mixtures were well mixed, and heated if necessary, until CN is completely dissolved. The mixtures were left to cool to RT, then 0.6 g of formulation (containing 25 mg CN) was filled into HPMC capsules (size 0) for dissolution testing. A few turns of nonreactive wire-helix were attached to each capsule to prevent its floating (20).
In Vitro Dissolution Studies
The in vitro dissolution studies employed USP dissolution apparatus II (UDT-804, LOGAN Inst. Corp., USA) with a paddle stirrer being maintained at 50 rpm (21). The dissolution medium was 500 ml of simulated gastric fluid (SGF, 0.1 N HCl; pH 1.2 with no enzymes). During the experiment, samples were withdrawn at 5, 10, 15, 30, 60, and 120 min and centrifuged for 5 min at 16,000×g. An aliquot of the resulting supernatant was taken for dilution in acetonitrile prior to UPLC assay. After completing one batch of running samples (2 h), the pH of the dissolution medium was shifted to 6.8 to simulate the intestinal pH. This was achieved by addition of 250 ml of 120 mM tribasic sodium phosphate to the media. In this media (pH 6.8), samples were collected at 15, 30, 60, and 120 min, centrifuged, and assayed as before. In addition, a separate dissolution experiment was also carried out in 500 ml of simulated intestinal fluid (SIF, phosphate buffer at pH 6.8 with no enzymes). In this experiment, samples were withdrawn at 5, 10, 15, 30, 60, and 120 min and treated as before.
The in vitro dissolution studies were performed to evaluate the release efficiency of the optimal formulations and to compare their dissolution profiles with the current marketed CN tablets (Stugeron®, 25 mg) under three different conditions: SGF, SIF, and after shifting the media from SGF to SIF. The dissolution studies were carried out in at least three replicates.
UPLC Assay
CN quantification was achieved by reverse-phase UPLC (22) using 0.5% trifluroaceticacid/acentonitrile (50/50) as mobile phase, delivered at 0.5 ml/min through an Acquity® UPLC BEH C18 (2.1 × 50 mm, 1.7 μm) column, which had been maintained at 50°C. The run time was 1 min, and the injection volume was 1.0 μl. The detector wavelength was set at 251 nm. The method was recently validated according to FDA guidelines (22).
Statistical Analysis
SPSS 18® software was used to analyze the data. One-way analysis of variance (ANOVA) followed by post hoc tests [least significant difference (LSD)] were applied to compare the anhydrous solubility results. Two-way ANOVA followed by post hoc tests (LSD) were applied to compare the dynamic dispersion and dissolution profiles (18). A value of p < 0.05 was denoted significant throughout the study.
RESULTS AND DISCUSSION
Equilibrium Solubility in Anhydrous Formulations
The maximum solubility of a drug in the formulation is of practical pharmaceutical importance because it dictates the maximum dose that can be incorporated in a unit dose capsule (10). In the overall solubility studies, a 7-day incubation period was chosen as a standard period to ensure maximum equilibration of the drug within all types of formulations. The CN solubility showed remarkable variability (ranging from 8 to 178 mg/g) according to the formulation type and composition (Table I).
Table I.
Equilibrium Solubility of CN in Selected Lipid-Based Formulations After 7 days Equilibration at RT (20 ± 2°C)
| Formulation | Type | Lipid chain | Solubility (mg/g)a |
|---|---|---|---|
| M810/T85 (50/50) | II | MCL | 33.8 ± 0.9b |
| I988/T85 (50/50) | II | MCL | 46.0 ± 1.8b |
| I308/T85 (50/50) | II | MCL | 43.3 ± 1.0b |
| M810/I988/T85 (25/25/50) | II | MCL | 41.9 ± 0.4b |
| M810/I308/T85 (25/25/50) | II | MCL | 38.3 ± 0.4b |
| OL/T85 (50/50) | II | LCL | 178.3 ± 6.0 |
| OL/I988/T85 (25/25/50) | II | LCL/MCL | 115.5 ± 4.1 |
| OL/I308/T85 (25/25/50) | II | LCL/MCL | 113.6 ± 2.8 |
| Soy/HCO-30 (50/50) | IIIA | LCL | 14.8 ± 0.3 |
| Cap355/HCO-30 (50/50) | IIIA | MCL | 18.3 ± 0.1c,d,e |
| Cap355/Cr-El (50/50) | IIIA | MCL | 18.3 ± 0.6c.d,e |
| M-35/Cr-El (50/50) | IIIA | LCL | 19.2 ± 1.0 |
| M810/Cr-El (50/50) | IIIA | MCL | 19.1 ± 0.7c,d,e |
| LN/Cr-El (50/50) | IIIA | LCL | 143.8 ± 5.0 |
| OL/T80 (50/50) | IIIA | LCL | 152.1 ± 1.2 |
| OL/Cr-El (50/50) | IIIA | LCL | 148.5 ± 2.7 |
| OL/I988/T80 (25/25/50) | IIIA | LCL/MCL | 90.5 ± 1.7 |
| OL/I988/Cr-El (25/25/50) | IIIA | LCL/MCL | 88.6 ± 2.2 |
| OL/I308/T80 (25/25/50) | IIIB | LCL/MCL | 92.1 ± 3.2 |
| OL/I308/Cr-El (25/25/50) | IIIB | LCL/MCL | 89.4 ± 2.2 |
| OL/PG/Cr-El (25/25/50) | IIIB | LCL | 73.8 ± 2.3 |
| OL/I308/PG/Cr-El (20/20/10/50) | IIIB | LCL/MCL | 63.7 ± 0.5 |
| Cr-El/PG (50/50) | IV | – | 7.6 ± 0.2 |
| Cr-El (100) | IV | – | 16.6 ± 0.7 |
MCL medium-chain lipids, LCL long-chain lipids
aData are expressed as mean ± SD, n = 3
bSignificant difference (p < 0.05) between [M810/T85 (50/50), I988/T85 (50/50), I308/T85 (50/50), M810/I988/T85 (25/25/50) and M810/I308/T85 (25/25/50)] vs OL/T85 (50/50)
cSignificant difference (p < 0.05) between [Cap355/HCO-30 (50/50), Cap355/Cr-El (50/50), and M810/Cr-El (50/50)] vs LN/Cr-El (50/50)
dSignificant difference (p < 0.05) between [Cap355/HCO-30 (50/50), Cap355/Cr-El (50/50), and M810/Cr-El (50/50)] vs OL/T80 (50/50)
eSignificant difference (p < 0.05) between [Cap355/HCO-30 (50/50), Cap355/Cr-El (50/50), and M810/Cr-El (50/50)] vs OL/Cr-El (50/50)
Influence of Lipid Chain Length on the Drug Solubility
The lipid chain length had a significant effect on the CN solubility in the formulation. Generally, formulations containing long-chain lipids (LCL, e.g., OL and LN) showed significantly higher (p < 0.05) drug solubility compared with formulations containing medium-chain lipids (MCL, e.g., M810, I988 and I308) (Table I). These results were expected since lipophilic drugs, such as CN, (log P = 5.8) (11), are likely to exhibit greater solubility in long chain compared with medium-chain lipids.
Influence of Glycerides Composition on the Drug Solubility
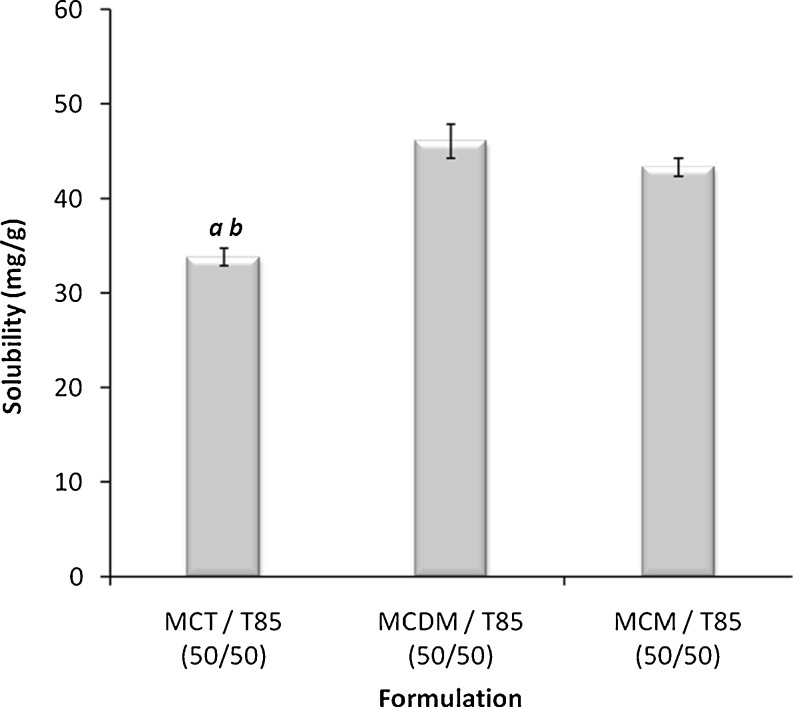
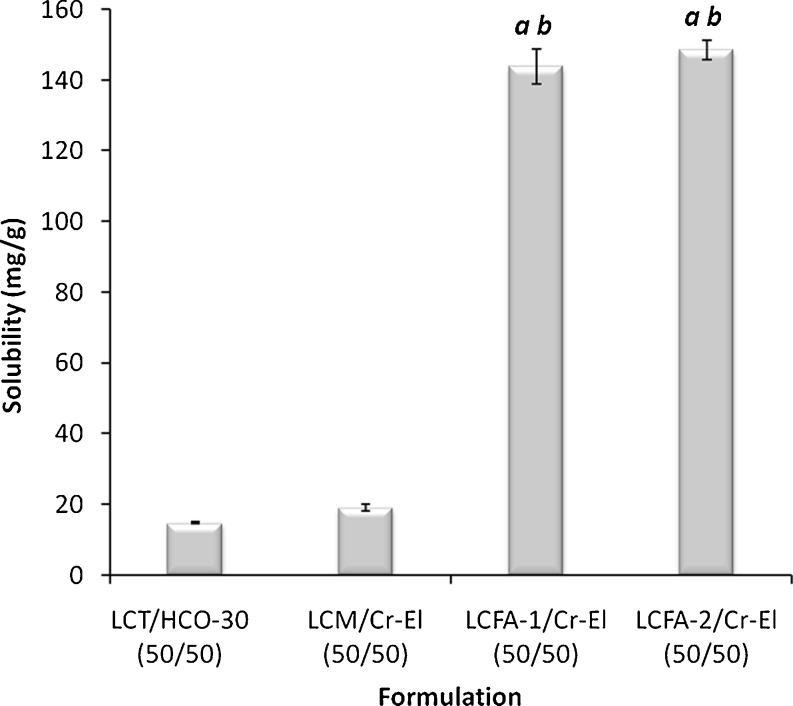
The glycerides composition was found to generate remarkable effect on the CN solubility in lipid-based formulations. In case of MCL formulations, medium-chain triglycerides (MCT) showed significantly lower (p < 0.05) CN solubility compared with medium-chain mono-glycerides (MCM) and the mixture of medium-chain di- and monoglycerides (MCDM) (Fig. 2). On the other hand, regarding LCL formulations, the unsaturated long-chain fatty acids (LCFA) showed significantly higher (p < 0.05) CN solubility compared with long-chain triglycerides (LCT) and long-chain monoglycerides (LCM) (Fig. 3). These results are strongly matching with previous data that showed pronounced CN solubility with OL and LN (23). Nevertheless, these previous data suggested that the absorption of CN from OL solution would depend on the action of bile salts, which would lead to high intra- and inter-subject variability (8).
Fig. 2.
Influence of glyceride composition on the CN solubility in MCL formulations. MCT medium-chain triglycerides (M810), MCDM mixture of medium-chain di- and mono-glycerides (I988), MCM medium-chain mono-glycerides (I308). a Significant difference (p < 0.05) from formulation containing MCDM and b significant difference (p < 0.05) from formulation containing MCM. Data are expressed as mean ± SD, n = 3
Fig. 3.
Influence of glyceride composition on the CN solubility in LCL formulations. LCT long-chain triglycerides (soybean oil), LCM long-chain mono-glycerides (maizine-35), LCFA-1 long-chain fatty acid (linoleic acid), LCFA-2 long-chain fatty acid (oleic acid). a Significant difference (p < 0.05) from formulation containing LCT and b significant difference (p < 0.05) from formulation containing LCM. Data are expressed as mean ± SD, n = 3
Influence of Surfactant Type on the Drug Solubility
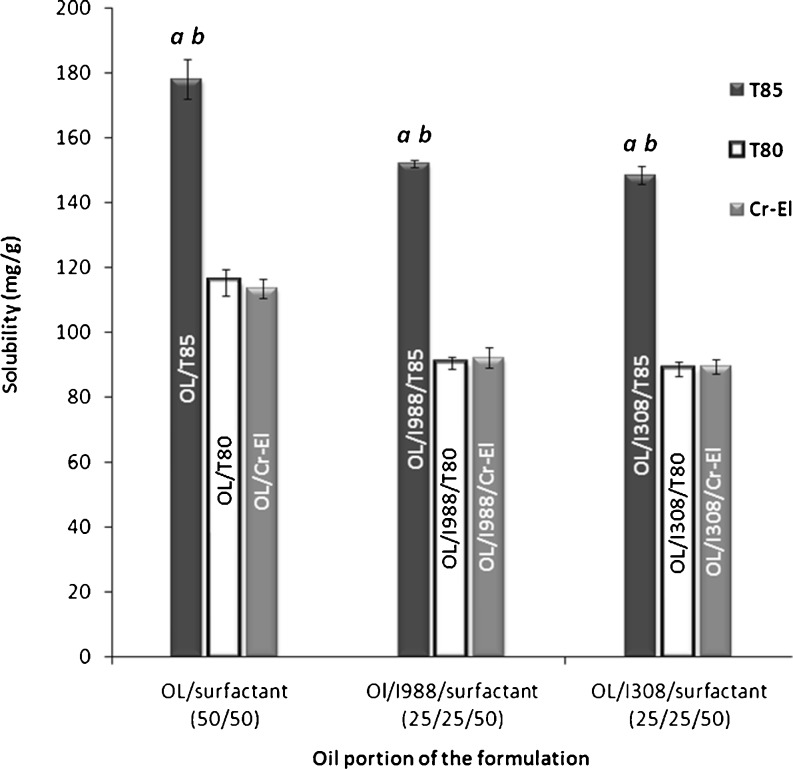
The surfactant component plays a vital role in the performance of lipid-based formulation. From the solubility perspective, self-emulsifying formulations usually contain 30–50% of their weight as surfactants. This shows the potential importance of the surfactant capacity to dissolve considerable amount of the lipophilic drug. In the current study, formulations containing lipophilic surfactants (T85) showed significantly higher (p < 0.05) CN solubility compared with hydrophilic surfactants (T80 and Cr-El) (Fig. 4). These results are quite logic due to the highly lipophilic nature of CN (log P = 5.8) (11). However, it is worth mentioning that formulations containing hydrophilic surfactants would have better performance in terms of self-emulsifying efficiency (5); therefore, the formulators should implement a sense of balance between the surfactant dissolving capacity and its self-emulsifying efficiency.
Fig. 4.
Influence of surfactant type on the CN solubility in lipid-based formulations. a Significant difference (p < 0.05) from the corresponding formulation containing T80. b Significant difference (p < 0.05) from the corresponding formulation containing Cr-El. Data are expressed as mean ± SD, n = 3
Influence of Cosolvent on the Drug Solubility
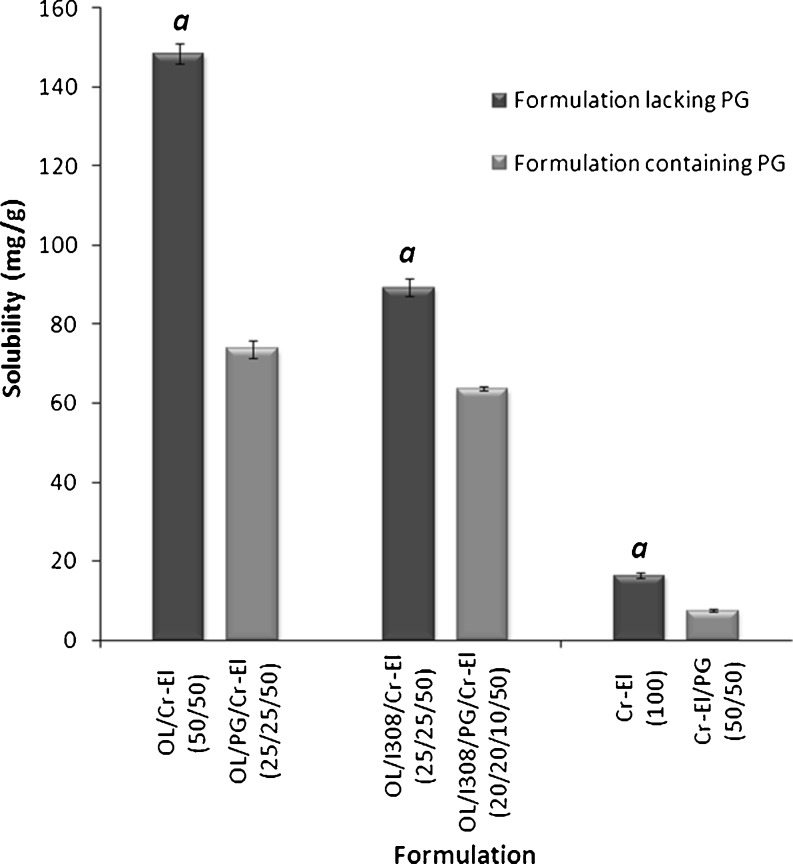
Several marketed lipid-based products contain water-soluble cosolvents either to increase the dissolving capacity of the formulation and/or to improve the spontaneity of the self-emulsifying system (18,24). For highly lipophilic drugs, cosolvent addition could have a negative influence on the formulation solvent capacity. This hypothesis has been confirmed by results shown in Fig. 5 where the addition of PG significantly reduced (p < 0.05) the CN solubility in three formulations. The addition of 25% cosolvent to OL/Cr-El [50/50, % w/w] formulation, resulted in more than 50% decline in the formulation solvent capacity. This sharp decline in CN solubility could be due to the highly hydrophilic nature of the cosolvent (PG). These results are in agreement with previous data published for another lipophilic compound (fenofibrate) (10).
Fig. 5.
Influence of co-solvent on the CN solubility in lipid-based formulations. a Significant difference (p < 0.05) from the corresponding formulation containing PG. Data are expressed as mean ± SD, n = 3
Influence of LFCS Type on the Drug Solubility
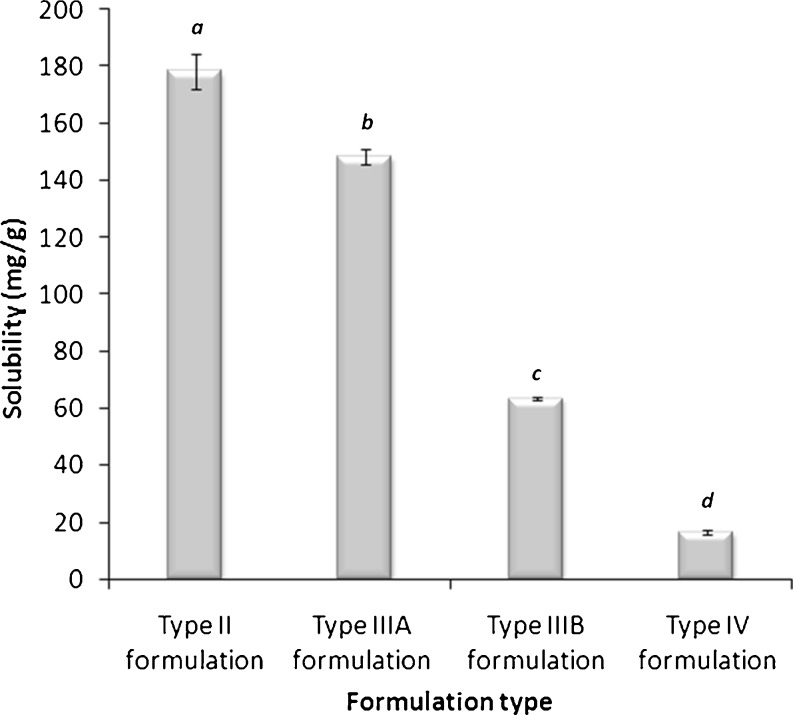
Since the LFCS is constructed based on increasing the hydrophilic nature of the formulation from types I to IV, it is expected that formulation type would considerably affect the formulation solvent capacity especially with highly lipophilic compounds. This assumption was remarkably represented with CN (Fig. 6). The CN solubility was significantly declining (p < 0.05) upon moving from type II to IV systems. This was definitely owing to the highly lipophilic nature of CN (11). These data were similarly expressed, but to a less extent, with fenofibrate (10).
Fig. 6.
Influence of LFCS type on the CN solubility in lipid-based formulations. Formulations are represented by the following systems: type II, OL/T85 (50/50, % w/w); type IIIA, OL/Cr-El (50/50, % w/w); type IIIB, OL/I308/PG/Cr-El (20/20/10/50, % w/w); and type IV, Cr-El (100, % w/w). Different letters above the bars indicate significant difference (p < 0.05) between the values. Data are expressed as mean ± SD, n = 3
Equilibrium Solubility in Diluted Formulations
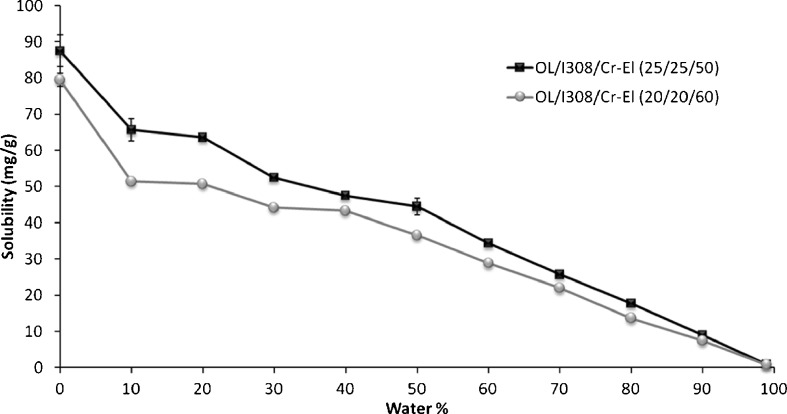
One way to predict the likely fate of the drug upon dilution with water is to investigate its solubility in the transparent (L2) phase during dilution (10). The OL/I308/Cr-El (type IIIB) systems absorbed considerable amount of water at 50–60% surfactant ratio, which was represented by the characteristic finger-like projection of the isotropic L2 region, reported in recent phase studies (19). This allowed studying the drug solubility in the L2 region over a considerable range of water dilution. The two formulations, OL/I308/Cr-El (25/25/50, % w/w/w) and OL/I308/Cr-El (20/20/60, % w/w/w) were diluted accordingly for the solubility studies.
Figure 7 represents the CN solubility within type IIIB self-emulsifying formulations upon aqueous dilution. Type IIIB systems are reported to significantly lose its solvent capacity upon aqueous dilution (24). However, in case of CN, the drug solubility decreased gradually, as formulations were diluted with water. These results are quite different from previously published data (10) in which the fenofibrate solubility had fallen steeply in response to aqueous dilution of the formulations.
Fig. 7.
Influence of aqueous dilution on the CN equilibrium solubility in type IIIB self-emulsifying formulations. Data are expressed as mean ± SD, n = 3
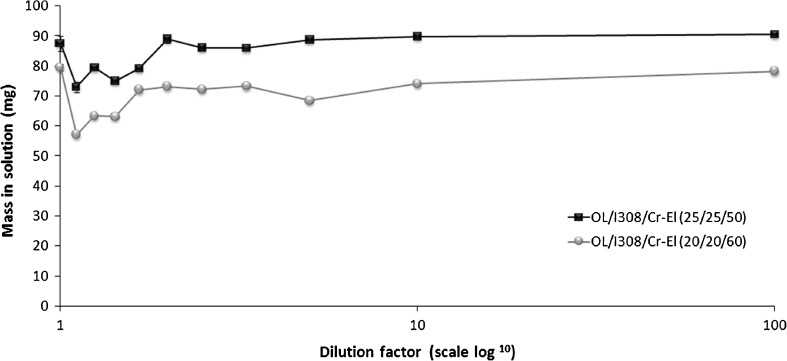
Further investigation was carried out to anticipate the precipitation tendency upon aqueous dilution of type IIIB systems. The maximum mass of CN that could remain in solution, after aqueous dilution of 1 g formulation, was theoretically calculated as reported earlier (10). (Further calculation details are available in Supplemental section S1.)
Figure 8 shows the mass of CN (in solution) that can be predicted from the dilution of the anhydrous formulation. The mass of CN is slightly reduced at lower aqueous dilutions compared with the higher dilution levels. This might be owing to the phase transitions occurring at lower aqueous dilutions, as presented in the recent phase diagram studies (19) where the OL/I308/Cr-El system (at 50–60% surfactant and 10–50% aqueous dilution) showed phase transitions among the isotropic oily (L2) phase, milky emulsion (L1 + L2) phase, and liquid crystal (LC) phase. Most importantly, at maximum water dilution (1:100), the type IIIB systems could maintain 98.5–100% of the drug in thermodynamically stable solution. This implies that no considerable precipitation is expected to occur on dilution. However, previous studies with fenofibrate showed that type IIIB system with different formulations, I308/T80 (50/50, % w/w), could maintain only 12.5–25% drug in solution (10). The difference in performance might be attributed to differences in physicochemical properties between the two drugs as well as difference in formulation efficiencies. Nonetheless, the abovementioned results of the CN solubility in diluted formulations can be well correlated with the subsequent dynamic dispersion studies.
Fig. 8.
Theoretical mass (mg) of CN that can remain in solution after aqueous dilution of 1 g of LFCS type IIIB formulations (further calculation details are available in the Supplemental section S1)
Dynamic Dispersion Studies
Influence of Glycerides Composition
The glycerides composition, particularly for MCL, showed a remarkable effect on the efficiency of drug release upon aqueous dispersion of anhydrous formulations. The mixed glycerides (represented by the combination of MCT/MCDM or MCT/MCM) showed significantly higher (p < 0.05) percentage of drug in solution compared with MCDM alone (Table II). These results are strongly correlated with recent droplet size data (19) where formulations containing medium-chain mixed glycerides produced very small droplet size (≤50 nm), indicating the high degree of self-nanoemulsifying efficiency compared with MCDM counterparts.
Table II.
Percentage of CN Remaining in Solution at 1, 4, and 24 h After the Aqueous Dispersion of Formulations
| LFCS type | Formulation | Lipid chain | % of drug in solutiona | ||
|---|---|---|---|---|---|
| 1 hr | 4 hr | 24 hr | |||
| II | I988/T85 (50/50) | MCL | 59.6 ± 6.9 | 66.0 ± 16.1 | 57.2 ± 4.8 |
| II | M810/I988/T85 (25/25/50) | MCL | 93.7 ± 6.5 | 95.6 ± 2.7 | 86.9 ± 5.9 |
| II | M810/I308/T85 (25/25/50) | MCL | 91.5 ± 1.4 | 92.6 ± 5.5 | 87.8 ± 5.4 |
| II | OL/I988/T85 (25/25/50) | LCL | 35.5 ± 9.8 | 32.3 ± 5.1 | 43.8 ± 4.8 |
| II | OL/I308/T85 (25/25/50) | LCL | 40.0 ± 7.2 | 41.7 ± 8.4 | 38.3 ± 13.6 |
| IIIA | OL/I988/T80 (25/25/50) | LCL | 66.6 ± 6.6 | 76.2 ± 9.2 | 72.0 ± 7.5 |
| IIIB | OL/I308/T80 (25/25/50) | LCL | 74.1 ± 2.8 | 69.9 ± 0.8 | 73.8 ± 1.4 |
| IIIA | OL/I988/Cr-El (25/25/50) | LCL | 98.9 ± 3.4 | 96.4 ± 2.1 | 96.4 ± 5.8 |
| IIIB | OL/I308/Cr-El (25/25/50) | LCL | 85.0 ± 2.4 | 93.9 ± 2.0 | 96.0 ± 0.4 |
| IIIB | OL/I308/PG/Cr-El (20/20/10/50) | LCL | 93.3 ± 4.2 | 95.7 ± 1.5 | 92.2 ± 2.9 |
| IV | Cr-El/PG (50/50) | – | 85.1 ± 1.0 | 85.4 ± 1.4 | 82.8 ± 2.0 |
MCL medium-chain lipids; LCL long-chain lipids
aData are expressed as mean ± SD, n = 3
Influence of Surfactant Type
The surfactant nature showed a strong correlation with the efficiency of formulation drug release upon aqueous dispersion. Providing that the lipid composition is fixed, the release efficiency showed significant increase (p < 0.05) upon moving from T85 through T80 to Cr-El (Table II). In case of LCFA/MCDM or LFCA/MCM with T85, the formulations were able to maintain only 32–44% of CN in solution. Upon replacing T85 with T80, the percentage of CN in solution was elevated to 66–76%, while using Cr-El led to excellent release of >85% CN in solution. These results are harmonizing with recent droplet size data (19) where the Cr-El batch showed the lowest droplet size indicating the best self-emulsifying efficiency compared with T85 and T80 batches. The vital influence of surfactant hydrophilicity on mean droplet size and self-emulsifying efficiency had been agreed upon within wide scope of publications (6,24). Although Cr-El is less hydrophilic (HLB = 12–14) than T80 (HLB = 15), the superiority of Cr-El might be attributed to the special arrangement of the surfactant at the oil/water interface, which was confirmed by the recent modeling and docking studies (25).
Influence of the LFCS Type
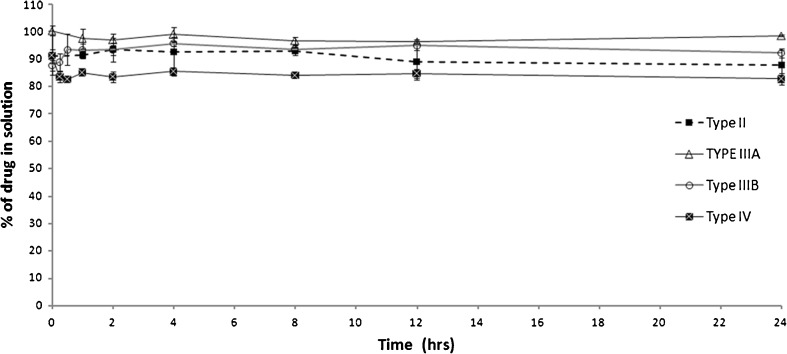
Providing that the formulation possessed acceptable release efficiency, no significant precipitation was detected with all the LFCS formulation types (Fig. 9). Even with the most hydrophilic type IV formulation, a minimum of 80% drug was maintained in solution up to 24 h. These results are greatly beneficial particularly for CN in comparison to reported results of dimethyl yellow and fenofibrate, which showed significant precipitation with type IIIB and IV formulations (9,10). In fact, this negligible precipitation shown with CN was expected from the diluted solubility results (Fig. 8). This could explain why no considerable precipitation had occurred upon aqueous dispersion of the formulations.
Fig. 9.
Influence of LFCS type on the aqueous dispersion of lipid-based formulations. Formulations are represented by the following systems: type II, M810/I988/T85 (25/25/50); type IIIA, OL/I988/Cr-El (25/25/50); type IIIB, OL/I308/PG/Cr-El (20/20/10/50); and type IV, Cr-El/PG (50/50). Data are expressed as mean ± SD, n = 3
Droplet Size Analysis
Interestingly, only formulations containing medium-chain mixed glycerides produced ultrafine (≤50 nm) droplet size, transparent appearance upon aqueous dilution (19), and were accordingly categorized as self-nanoemulsifying drug delivery systems (SNEDDS) (6). While other formulations that produced (>50 nm) droplet size and turbid appearance were categorized as self-emulsifying drug delivery systems (SEDDS) (6). Droplet size data are presented in Table III.
Table III.
Summary of the overall characteristics of the optimal formulations
| Code | Formulation | Self-emulsifying efficiencyb | CN solubility (mg/g)a | Droplet size (nm)a b | % of CN in solutiona |
|---|---|---|---|---|---|
| SNEDDS 1 | M810/I988/T85 (25/25/50) | Excellent | 42 | 50 | 87–94 |
| SNEDDS 2 | M810/I308/T85 (25/25/50) | Excellent | 38 | 29 | 88 − 92 |
| SEDDS 1 | OL/I988/Cr-El (25/25/50) | Excellent | 89 | 77 | 96 − 99 |
| SEDDS 2 | OL/I308/Cr-El (25/25/50) | Excellent | 89 | 108 | 85 − 96 |
| SEDDS 3 | OL/I308/PG/Cr-El (20/20/10/50) | Excellent | 64 | 108 | 92 − 93 |
aData are expressed as mean of three replicates
bData are adapted from Ref. (19)
Formulation Optimization
From the overall studies, five optimal formulations have shown acceptable self-emulsifying efficiency (19), droplet size (19), CN equilibrium solubility, and release efficiency beside maintaining high percentage of CN in solution after aqueous dispersion. These formulations showed great potential to compete with the marketed product and had been selected for the subsequent dissolution studies. Table III summarizes the overall characteristics of the optimal formulations.
In Vitro Dissolution Studies
CN is a weak base that shows higher solubility at low pH (0.29 mg/ml in pH 1.2) and lower solubility at high pH (0.002 mg/ml in pH 7.2) (13). Pharmaceuticals that exhibit pH-dependent solubility may undergo dissolution, precipitation, and redissolution processes through the GI tract because of the dramatic change in solubility as pH changes. Therefore, to more accurately predict the in vivo dissolution behaviour of these pharmaceuticals, it is necessary to conduct a dissolution test that mimics the pH changes in the GI tract (13). Hereby, dissolution studies had been initially carried out in SGF for 2 h before shifting the media into SIF.
Optimal Formulations vs Marketed Stugeron® Tablet
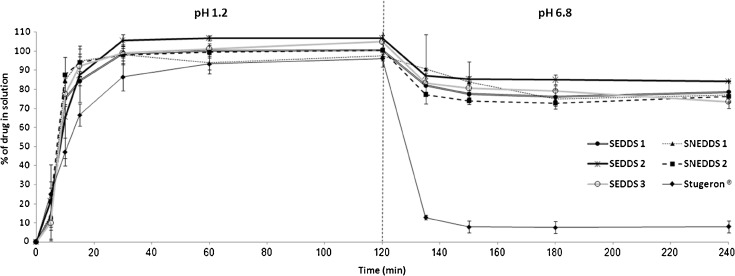
In SGF, all the optimal formulations showed superior (significant, p < 0.05) dissolution profiles with respect to Stugeron® tablet (Fig. 10). At 15 min, Stugeron® tablet managed to release only 66.5% drug in solution where the optimal formulations were able to release 84–95% drug in solution. At 30 min, all the optimal formulations exceeded 95% drug release. This indicates the ability of these formulations to provide more efficient and rapid release of CN with respect to the marketed tablet.
Fig. 10.
In vitro dissolution profile of CN from SNEDDS-1 [M810/I988/T85 (25/25/50)], SNEDDS-2 [M810/I308/T85 (25/25/50)], SEDDS-1 [OL/I988/Cr-El (25/25/50)], SEDDS-2 [OL/I308/Cr-El (25/25/50)], SEDDS-3 [OL/I308/PG/Cr-El (20/20/10/50)], and Stugeron® tablets. Dissolution was carried out in simulated gastric fluid (pH 1.2) for 2 h and subsequently shifted into simulated intestinal fluid (pH 6.8) for another 2 h. The dash line indicates the time point at which pH was shifted from 1.2 to 6.8. Data are expressed as mean ± SD, n = 3
After 2 h, shifting the media into SIF had resulted in enormous changes with the Stugeron® tablet that showed extreme (83%) drug precipitation (after only 15 min from shifting into SIF media) (Fig. 10). Precipitation continued to take place, but with slower rate, until it reached to 92% drug precipitation. The above mentioned results are in agreement with previous data (13) that showed significant CN precipitation after shifting to higher pH environment. This parameter is very crucial and could obviously account for the erratic CN oral bioavailability, which might be caused by intra- and intersubject physiological variability (e.g., gastrointestinal pH and gastric emptying rate). This finding assures the immense need for developing a self-emulsifying formulation that could enhance the drug dissolution profile and resist the sharp pH-dependent changes. On the other hand, the five optimal formulations showed far less (7–23%) drug precipitation (after 15 min from shifting into SIF media), reaching to a maximum of 26% drug precipitation (Fig. 10). This indicates the ability of these formulations to resist the significant drug precipitation resulted from changing into higher pH environments.
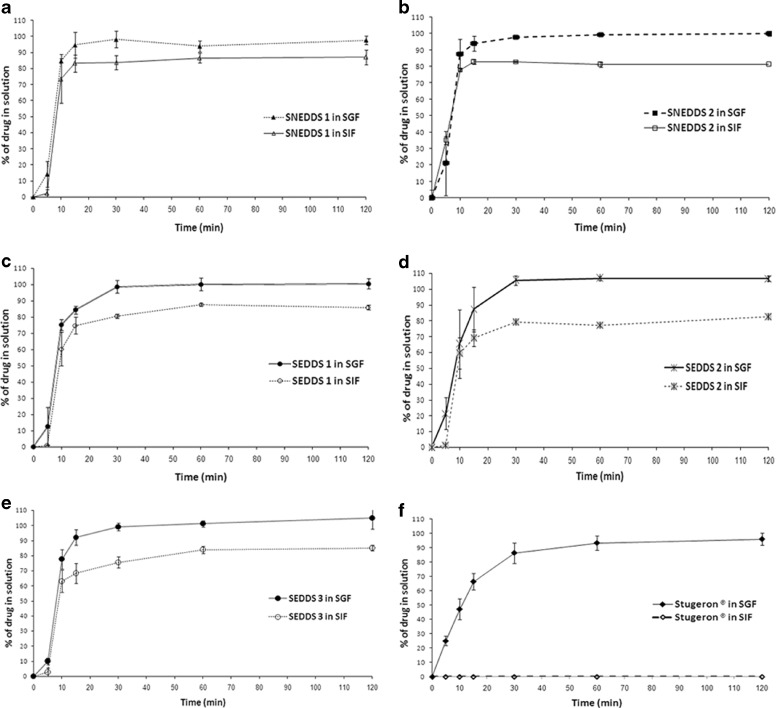
This finding was further investigated through carrying out dissolution studies using SIF (from the starting point) and then comparing between the SGF and SIF results (Figs. 11 and 12). Surprisingly, Stugeron® tablet could not show any detectable drug dissolution in SIF media (drug solubility were <0.1 μg/ml) (Fig. 11). This sharp difference between SIF and SGF dissolution profiles could explain the reason why severe CN precipitation had been observed with Stugeron® tablet after shifting from SGF to SIF media (Fig. 10).
Fig.11.
In vitro dissolution profile of CN from: SNEDDS-1 [M810/I988/T85 (25/25/50)], SNEDDS-2 [M810/I308/T85 (25/25/50)], SEDDS-1 [OL/I988/Cr-El (25/25/50)], SEDDS-2 [OL/I308/Cr-El (25/25/50)], SEDDS-3 [OL/I308/PG/Cr-El (20/20/10/50)], and Stugeron® tablets. Dissolution was carried out in simulated intestinal fluid (pH 6.8) for a period of 2 h. Data are expressed as mean ± SD, n = 3
Fig. 12.
Influence of pH of the media on the dissolution profile of CN from a SNEDDS-1 [M810/I988/T85 (25/25/50)], b SNEDDS-2 [M810/I308/T85 (25/25/50)], c SEDDS-1 [OL/I988/Cr-El (25/25/50)], d SEDDS-2 [OL/I308/Cr-El (25/25/50)], e SEDDS-3 [OL/I308/PG/Cr-El (20/20/10/50)], and f Stugeron® tablets. SGF simulated gastric fluid (pH 1.2), SIF simulated intestinal fluid (pH 6.8). Data are expressed as mean ± SD, n = 3
On the other hand, the optimal formulations were able to release 81–87% CN into SIF media compared with almost 100% release of CN in SGF media (p < 0.05) (Figs. 11 and 12). This smaller difference between SGF and SIF dissolution profiles could explain the reason why much lesser precipitation had been observed with these formulations after shifting from SGF into SIF media (Fig. 10).
Superiority of SNEDDS
Regarding the drug release rate, the dissolution profiles of the optimal formulations have shown considerable differences. In SIF, SNEDDS-2 showed the highest drug release rate followed by SNEDDS-1, SEDDS-1, SEDDS-2, and SEDDS-3, respectively (Fig. 11). There was significant difference (p < 0.05) between all the formulations profiles except between SEDDS-2 and SEDDS-3. These results are closely related to the recent droplet size data (19), which showed that SNEDDS-2 produced the lowest droplet size (p < 0.05) upon aqueous dilution (Table III), followed by SNEDDS-1, SEDDS-1, SEDDS-2, and SEDDS-3, respectively. The abovementioned findings establish the strong correlation between droplet size and drug release rate where self-nanoemulsifying systems (SNEDDS-1 and SNEDDS-2) produced the highest drug release rate. This correlation has also been confirmed in earlier publications (6).
CONCLUSION
SNEDDS introduce a vital option to improve the oral bioavailability of poorly water-soluble compounds. However, the selection of the formulation components and their relative quantities in the formulation is very critical and varies from drug to another. The optimum formulation selection depends mainly on the physicochemical properties of each drug. Formulations containing medium-chain mixed glycerides showed remarkable suitability for CN. Regardless of the surfactant type, SNEDDS containing medium-chain mixed glycerides showed enhanced self-nanoemulsifying efficiency, satisfactory CN solubility, lower droplet size, superior dissolution profiles, and, most importantly, negligible precipitation upon pH change. Accordingly, SNEDDS containing medium-chain mixed glycerides offer great potential to enhance the oral CN delivery.
ELECTRONIC SUPPLEMENTARY MATERIAL
Below is the link to the electronic supplementary material.
Additional Supporting Information may be found in the supplemental section. (DOC 88 kb)
Acknowledgments
The authors would like to acknowledge SABIC graduate student fund (number MED-30-44). The authors are grateful to Prof. Adel Sakr for his scientific support and professional management. In addition, the authors would like to thank Dr. Magdi Abdel-Hamid for his great efforts in the UPLC analysis.
Disclosures
The authors report no conflicts of interest in this work.
REFERENCES
- 1.Date AA, Desai N, Dixit R, Nagarsenker M. Self-nanoemulsifying drug delivery systems: formulation insights, applications and advances. Nanomedicine (Lond) 2010;5:1595–1616. doi: 10.2217/nnm.10.126. [DOI] [PubMed] [Google Scholar]
- 2.Date AA, Nagarsenker MS. Design and evaluation of self-nanoemulsifying drug delivery systems (SNEDDS) for cefpodoxime proxetil. Int J Pharm. 2007;329:166–172. doi: 10.1016/j.ijpharm.2006.08.038. [DOI] [PubMed] [Google Scholar]
- 3.Lei Y, Lu Y, Qi J, Nie S, Hu F, Pan W, et al. Solid self-nanoemulsifying cyclosporin A pellets prepared by fluid-bed coating: preparation, characterization and in vitro redispersibility. Int J Nanomedicine. 2011;6:795–805. doi: 10.2147/IJN.S17711. [DOI] [PMC free article] [PubMed] [Google Scholar]
- 4.Kommuru TR, Gurley B, Khan MA, Reddy IK. Self-emulsifying drug delivery systems (SEDDS) of coenzyme Q10: formulation development and bioavailability assessment. Int J Pharm. 2001;212:233–246. doi: 10.1016/S0378-5173(00)00614-1. [DOI] [PubMed] [Google Scholar]
- 5.Pouton CW. Lipid formulations for oral administration of drugs: non-emulsifying, self-emulsifying and ‘self-microemulsifying’ drug delivery systems. Eur J Pharm Sci. 2000;11:S93–S98. doi: 10.1016/S0928-0987(00)00167-6. [DOI] [PubMed] [Google Scholar]
- 6.Gursoy RN, Benita S. Self-emulsifying drug delivery systems (SEDDS) for improved oral delivery of lipophilic drugs. Biomed Pharmacother. 2004;58:173–182. doi: 10.1016/j.biopha.2004.02.001. [DOI] [PubMed] [Google Scholar]
- 7.Charman SA, Charman WN, Rogge MC, Wilson TD, Dutko FJ, Pouton CW. Self-emulsifying drug delivery systems: formulation and biopharmaceutic evaluation of an investigational lipophilic compound. Pharm Res. 1992;9:87–93. doi: 10.1023/A:1018987928936. [DOI] [PubMed] [Google Scholar]
- 8.Charman WN, Rogge MC, Boddy AW, Berger BM. Effect of food and a monoglyceride emulsion formulation on danazol bioavailability. J Clin Pharmacol. 1993;33:381–386. doi: 10.1002/j.1552-4604.1993.tb04673.x. [DOI] [PubMed] [Google Scholar]
- 9.Pouton CW. Formulation of poorly water-soluble drugs for oral administration: physicochemical and physiological issues and the lipid formulation classification system. Eur J Pharm Sci. 2006;29:278–287. doi: 10.1016/j.ejps.2006.04.016. [DOI] [PubMed] [Google Scholar]
- 10.Mohsin K, Long MA, Pouton CW. Design of lipid-based formulations for oral administration of poorly water-soluble drugs: precipitation of drug after dispersion of formulations in aqueous solution. J Pharm Sci. 2009;98:3582–3595. doi: 10.1002/jps.21659. [DOI] [PubMed] [Google Scholar]
- 11.Loftsson T, Hreinsdóttir D, Másson M. Evaluation of cyclodextrin solubilization of drugs. Int J Pharm. 2005;302:18–28. doi: 10.1016/j.ijpharm.2005.05.042. [DOI] [PubMed] [Google Scholar]
- 12.Kossena GA, Charman WN, Boyd BJ, Dunstan DE, Porter CJ. Probing drug solubilization patterns in the gastrointestinal tract after administration of lipid-based delivery systems: a phase diagram approach. J Pharm Sci. 2004;93:332–348. doi: 10.1002/jps.10554. [DOI] [PubMed] [Google Scholar]
- 13.Gu CH, Rao D, Gandhi RB, Hilden J, Raghavan K. Using a novel multicompartment dissolution system to predict the effect of gastric pH on the oral absorption of weak bases with poor intrinsic solubility. J Pharm Sci. 2005;94:199–208. doi: 10.1002/jps.20242. [DOI] [PubMed] [Google Scholar]
- 14.Ogata H, Aoyagi N, Kaniwa N. Gastric acidity dependent bioavailability of cinnarizine from two commercial capsules in healthy volunteers. Int J Pharm. 1986;29:113–120. doi: 10.1016/0378-5173(86)90108-0. [DOI] [Google Scholar]
- 15.B-q L, G-q Y, S-h F, Gao J-y, Gu F-m, Dong X, et al. Effect of route of administration on the pharmacokinetics and toxicokinetics of cinnarizine in dogs. Eur J Pharm Sci. 2010;40:197–201. doi: 10.1016/j.ejps.2010.03.013. [DOI] [PubMed] [Google Scholar]
- 16.Shi S, Chen H, Cui Y, Tang X. Formulation, stability and degradation kinetics of intravenous cinnarizine lipid emulsion. Int J Pharm. 2009;373:147–155. doi: 10.1016/j.ijpharm.2009.02.006. [DOI] [PubMed] [Google Scholar]
- 17.Baka E, Comer JEA, Takács-Novák K. Study of equilibrium solubility measurement by saturation shake-flask method using hydrochlorothiazide as model compound. J Pharmaceut Biomed. 2008;46:335–341. doi: 10.1016/j.jpba.2007.10.030. [DOI] [PubMed] [Google Scholar]
- 18.Atef E, Belmonte AA. Formulation and in vitro and in vivo characterization of a phenytoin self-emulsifying drug delivery system (SEDDS) Eur J Pharm Sci. 2008;35:257–263. doi: 10.1016/j.ejps.2008.07.004. [DOI] [PubMed] [Google Scholar]
- 19.Shahba AA, Mohsin K, Alanazi FK. The studies of phase equilibria and efficiency assessment for self-emulsifying lipid based formulations. AAPS PharmSciTech. 2012;13:522–33. doi:10.1208/s12249-012-9773-8. [DOI] [PMC free article] [PubMed]
- 20.Arora S, Ali J, Ahuja A, Khar RK, Baboota S. Floating drug delivery systems: a review. AAPS PharmSciTech. 2005;6:E372–E390. doi: 10.1208/pt060347. [DOI] [PMC free article] [PubMed] [Google Scholar]
- 21.FDA. Guidance for industry: Dissolution Testing of Immediate Release Solid Oral Dosage Forms, U.S. Department of Health and Human Services, Food and Drug Administration, Center for Drug Evaluation and Research (CDER), Rockville, 1997.
- 22.Abdel-Hamid M, Shahba A, Mohsin K, Alanazi F. Ultra performance liquid chromatography assay for cinnarizine in lipid-based formulations. Asian J Chem. 2012;24:595–600. [Google Scholar]
- 23.Tokumura T, Tsushima Y, Tatsuishi K, Kayano M, Machida Y, Nagai T. Enhancement of the oral bioavailability of cinnarizine in oleic acid in beagle dogs. J Pharm Sci. 1987;76:286–288. doi: 10.1002/jps.2600760404. [DOI] [PubMed] [Google Scholar]
- 24.Pouton CW, Porter CJ. Formulation of lipid-based delivery systems for oral administration: materials, methods and strategies. Adv Drug Deliv Rev. 2008;60:625–637. doi: 10.1016/j.addr.2007.10.010. [DOI] [PubMed] [Google Scholar]
- 25.Alayoubi A, Satyanarayanajois SD, Sylvester PW, Nazzal S. Molecular modelling and multisimplex optimization of tocotrienol-rich self emulsified drug delivery systems. Int J Pharm. 2012;426:153–161. doi: 10.1016/j.ijpharm.2012.01.049. [DOI] [PubMed] [Google Scholar]
Associated Data
This section collects any data citations, data availability statements, or supplementary materials included in this article.
Supplementary Materials
Additional Supporting Information may be found in the supplemental section. (DOC 88 kb)


