Abstract
The present study was aimed to predict the absorption profile of a risperidone immediate release tablet (IR) and to develop the level A in vitro–in vivo correlation (IVIVC) of the drug using the gastrointestinal simulation based on the advanced compartmental absorption and transit model implemented in GastroPlus™. Plasma concentration data, physicochemical, and pharmacokinetic properties of the drug were used in building its absorption profile in the gastrointestinal tract. Since the fraction absorbed of risperidone in simulation was more than 90% with low water solubility, the drug met the criteria of class II of the Biopharmaceutics Classification System. The IVIVC was developed based on the model built using the plasma data and the in vitro dissolution data in several dissolution media based on the Japanese Guideline for Bioequivalence Studies of Generic Products. The gastrointestinal absorption profile of risperidone was successfully predicted. A level A IVIVC was also successfully developed in all dissolution media with percent prediction error for Cmax and the area under the curve less than 10% for both reference and test drug.
Key words: GastroPlus™, immediate release tablet, in vitro–in vivo correlation, risperidone
Introduction
Risperidone is an antipsychotic with extremely potent serotonin-5HT2 and potent dopamine-D2 antagonistic properties (1). Risperidone is rapidly and very well absorbed after administration orally. It is extensively converted in the liver (2–5). Its absorption does not appear to be affected by food (5). Risperidone is a weak base with ionization constants of 8.24 (pKa1) for the piperidine nitrogen and 3.11 (pKa2) for the pyrimidine moiety (4). Risperidone has low solubility in water and high permeability so that it belongs to class II of the Biopharmaceutical Classification System (BCS) where dissolution rate is the limit factor for its absorption. BCS class II drug of immediate release dosage form is the subject of in vitro–in vivo correlation (6,7). Up to the present, the in vitro–in vivo correlation (IVIVC) for risperidone has not been developed yet.
Dissolution testing is an industry standard and is used both for quality control (QC) purpose and during drug product development (R&D). Ideally, dissolution data can be used to establish IVIVC with clinically observed plasma—time curve (8,9). The Food and Drug Administration (FDA) defines IVIVC as a predictive mathematical model describing the relationship between an in vitro property of a dosage form and a relevant in vivo response. An IVIVC can be used to request biowaivers from regulatory agencies for certain formulation or production changes within the lifecycle of a product. This reduces the need for expensive bioequivalence testing in humans (10,11). The IVIVC can be achieved using a computer-based model such as the advance compartmental absorption and transit (ACAT) model. The main objective of an IVIVC is to serve as a surrogate for in vivo bioavailability and to support biowaivers.
Physiologically based modeling for prediction of the gastrointestinal transit and absorption of drug in humans has received much attention recently. GastroPlus ™ is a simulation software that uses the ACAT. In the ACAT model, the small intestine is divided into different compartments and calculates the fraction dose absorbed for each compartment (11,12). The aim of the present study was to employ GastroPlus™ as a tool to investigate the absorption profile of risperidone in the gastrointestinal tract disposition based on its physicochemical and pharmacokinetic parameters and to build its in vitro–in vivo correlation based on the model built.
Materials and Methods
In Vivo Data
The pharmacokinetic data required for the simulation were supplied by Towa Pharmaceutical Co., Ltd, Osaka, Japan. The data consisted of plasma concentration data of risperidone oral tablet, both test and reference drug. The experiment to get the plasma concentration was conducted based on the Japanese Guideline for Bioequivalence Studies of Generic Products (13).
In Vitro Studies
Both dissolution data of risperidone tablets, reference and test, were supplied by Towa Pharmaceutical Co., Ltd, Osaka, Japan. The dissolution tests were conducted based on the Japanese Guideline for Bioequivalence Studies of Generic Products. Briefly, the dissolution tests of risperidone tablets were conducted using USP apparatus 2 (paddle rotation) at 37 ± 0.5°C in five different media; in phosphate buffer pH 1.2, pH 4.0, pH 6.8 at 50 rpm, in water at 50 rpm, and in phosphate buffer pH 6.8 at 100 rpm. Risperidone is an immediate release tablet 2 mg containing risperidone, lactose, maize starch, crystalline cellulose, hypromellose, l-hydroxypropyl cellulose, magnesium stearate, hydroxypropyl cellulose, talc, titanium dioxide, and carnauba wax.
Mechanistic Simulation
GastroPlus™ (version 7.0.0.01, Simulation Plus, Inc., Lancaster, CA, USA) was used to simulate the in vivo absorption profile and to develop the in vitro–in vivo correlation of risperidone. The program has three input tabs, namely, compound, physiology, and pharmacokinetic tab, comprising three sets of factors influencing oral drug absorption. In the compound tab, Log P, solubility, diffusion coefficient, and human effective permeability were predicted using the ADMET predictor module from GastroPlus™. pKa values were taken from published literature. Other data in the compound tab were set at default values. The drug release profile was used by the software to calculate the drug concentration in each compartment. The human Log D absorption model was used to estimate the changes in permeability as the drug traveled along the gastrointestinal (GI) tract. All other parameters were fixed at default values that represent human fasted physiology. Gastroplus™ then calculates the fraction dose absorbed based on the ACAT model using drug concentration, permeability, and transit times in each compartment. In pharmacokinetics tab, blood/plasma concentration ratio and percent of drug unbound to plasma proteins were estimated by ADMET predictor module, and optimizing process from optimizing module was used to estimate the pharmacokinetic parameters (CLr, Vc, k12, and k21). All other pharmacokinetic parameters were fixed at default values. The input data for GastroPlus™ simulation were summarized in Table I and the scheme of work in Fig. 1. The percent prediction error (%PE) for Cmax and area under the curve (AUC) were calculated based on the equation given below:
 |
Table I.
Input Data for GastroPlus™ Simulation
| Parameters | Value (unit) |
|---|---|
| Molecular weight | 410.5 (g/mol) |
| Log P | 3.04a |
| pK a | pK a1 = 8.24 pK a2 = 3.11a |
| Human jejunal permeability | 1.978 × 10⁻⁴ (cm/s)b |
| Dose | 2 (mg) |
| Dose volume | 150 (ml) |
| Solubility (pH 8.4288) | 0.0028 (mg/ml)c |
| Mean precipitation time | 900 (s)d |
| Diffusion coefficient | 0.685 × 10⁻⁵ (cm2/s)b |
| Drug particle density | 1.2 (g/mL)d |
| Effective particle radius | 25 (μm)d |
| Body weight | 63.8 (kg) |
| Hepatic first past extraction/FPE | 34 (%)e |
| Blood/plasma concentration ratio | 0.671b |
| Unbound percent in plasma | 10 (%)f |
| Renal clearance (CLr) | 0.39471 (L/h/kg)b |
| Volume of distribution (Vc) | 1.3274 (L/kg)b |
| Elimination half life (t1/2) | 5.31 (h) |
| Simulation time | 24 (h) |
Fig. 1.

Scheme of the work in building IVIVC for risperidone IR tablet
Results and Discussion
Mechanistic Simulation-Model Validation
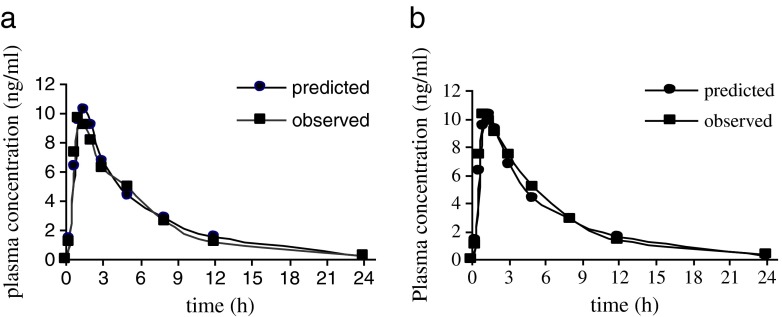
Gastrointestinal simulation for risperidone IR tablet based on the input parameters in Table I was performed using the Gastroplus™ single simulation mode. The simulated risperidone absorption profile is presented in Fig. 2, together with the mean plasma profile of the reference tablet and the test one. The predicted plasma concentration was similar to the observed one for both tablets.
Fig. 2.
Predicted and observed mean risperidone plasma Cp-time profiles following administration of a single 2-mg risperidone IR tablet; reference tablet (a); test tablet (b)
The prediction fraction of drug absorbed (Fa) was 99.79%. This value was in accordance with the literature which reported that risperidone when administered orally is rapidly and completely absorbed (4,14,16,17). GastroPlus™ succeeded in estimating the bioavailability of risperidone. The predicted value of bioavailability was 65.9%. This value was almost close to the value reported in some journals.
It has been reported that absolute bioavailability of risperidone was 66–70% (14,18). The predicted and observed pharmacokinetic parameters following oral administration of 2 mg risperidone IR reference tablet and test one are listed in Tables II and III, respectively. The percent prediction error for Cmax of test tablet is slightly smaller than the reference one (0.57% compared to 7.43%) but both of the values are less than 10%. On the other hand, the percent prediction error of the area under the curve of the reference tablet shows slightly smaller than the test one (1.22% compared to 7.12%) but those values are less than 10%. The percent prediction error values which is less than 10% for Cmax and area-under-the-curve values indicates that the generated absorption model gave good prediction of risperidone oral absorption. The percent prediction error for tmax is high (36%) for both reference and test tablet, but the value was still accordance with some published journal. Zhou et al. reported that tmax of risperidone in Chinese female patients with schizophrenia was 1.6 h. Belotto et al. reported that risperidone tmax in healthy Brazilian volunteers was 1.5 h, and Schaick et al. reported that tmax was 1.8 h in healthy volunteers (19–21).
Table II.
Comparison of Pharmacokinetic Parameters Between Simulated and In Vivo Observed Data for Risperidone After Oral Administration of 2-mg IR Reference Tablet
| Parameters | Observed | Simulated | PE (%) |
|---|---|---|---|
| Cmax (ng/ml) | 9.65 | 10.36 | 7.43 |
| tmax (h) | 1 | 1.36 | 36 |
| AUC0 → ∞ (ng h/mL) | 61.91 | 62.67 | 1.22 |
| AUC0 → t (ng h/mL) | 59.45 | 60.78 | 2.24 |
Table III.
Comparison of Pharmacokinetic Parameters Between Simulated and In Vivo Observed Data for Risperidone After Oral Administration Of 2-mg IR Test Tablet
| Parameters | Observed | Simulated | PE (%) |
|---|---|---|---|
| Cmax (ng/ml) | 10.30 | 10.36 | 0.57 |
| tmax (h) | 1 | 1.36 | 36 |
| AUC0 → ∞ (ng h/mL) | 67.48 | 62.67 | 7.12 |
| AUC0 → t (ng h/mL) | 65.23 | 60.78 | 6.82 |
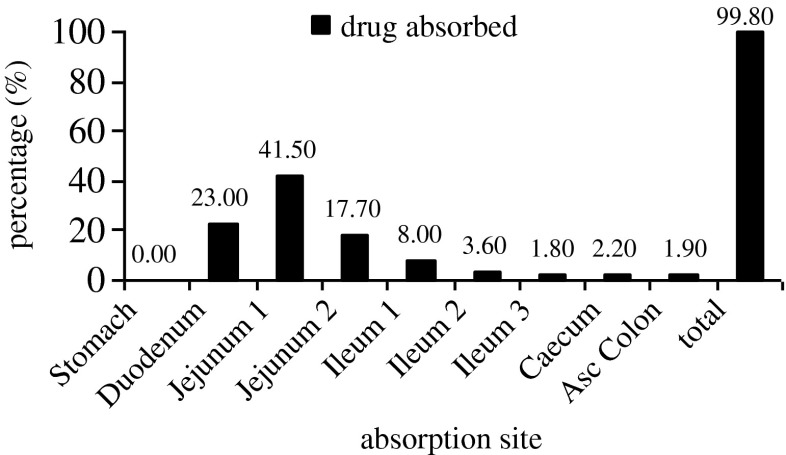
The regional absorption distribution generated by GastroPlus suggested that the majority of risperidone was absorbed in the duodenum and jejunum (82.2%), while the rest of dose was absorbed in middle and distal GI regions (Fig. 3). These results are in accordance with the general trend of drug absorption. Risperidone is a basic drug with two pKa (pKa1 = 3.11 and pKa2 = 8.4). With those pKa, the drug will be in the unionized form in the large amount in the duodenum and jejunum pH environment (4,22). This is also in accordance with a published journal that reported that risperidone, when administered orally, will rapidly and completely be absorbed. In the pH values 2–3 units over the pKa (3.11), which is the environment pH of the duodenum and jejunum, the majority of basic drugs will be in unionized form which will have linear correlation with the high permeability across the gastrointestinal membrane (22).
Fig. 3.
Compartmental absorption of risperidone
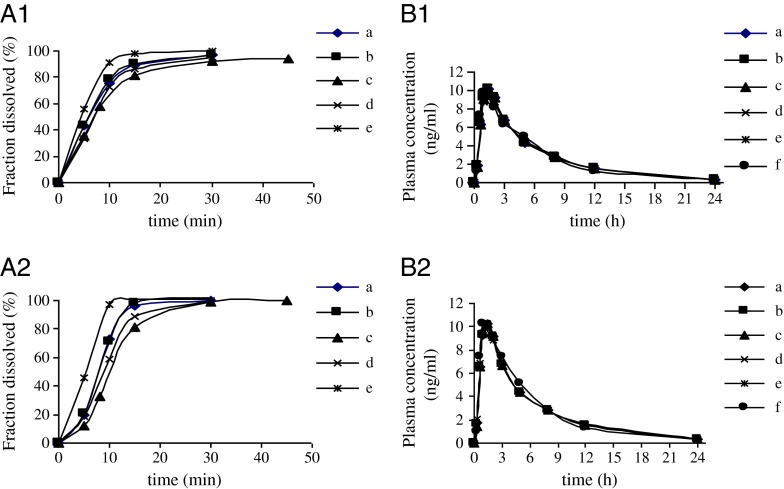
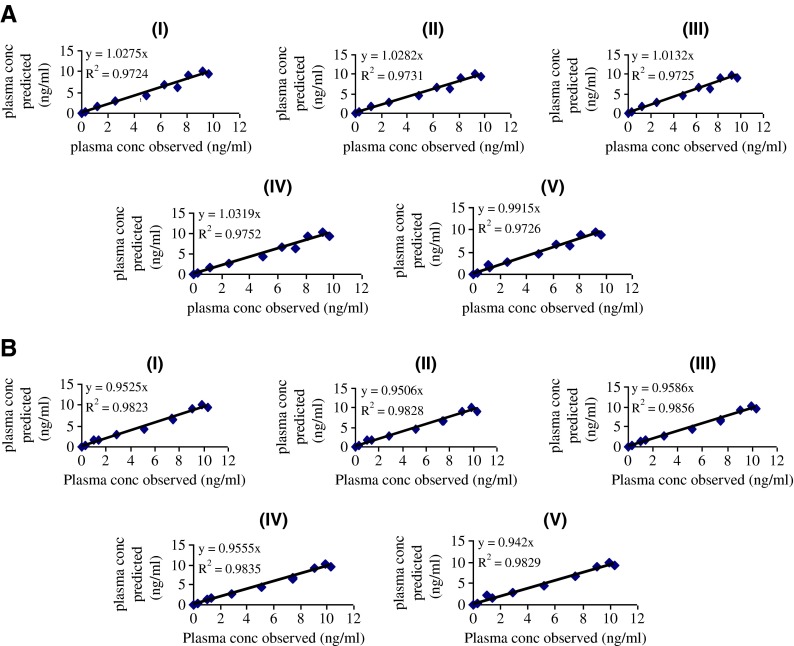
Different virtual dissolution profiles used as inputs for gastrointestinal simulations are presented in Fig. 4a (1,2). The corresponding Cp-time estimated on the basis of the generated risperidone-specific absorption model profiles are shown in Fig. 4b (1,2). In deconvolution methods, mechanistic absorption model was chosen to correlate the in vitro dissolution data and its corresponding plasma concentration data. This deconvolution method utilizes the full capabilities of the ACAT model. The simulated profiles of plasma concentration in all dissolution media were overlap. In establishing the IVIVC using deconvolution approach, in vivo release which calculated from GastroPlus™ was compared to the virtual in vitro dissolution profiles. Results from regression analysis are shown in Fig. 5. The correlation value (r2) which is very close to 1 for all dissolution media indicated that strong in vitro–in vivo correlation were successfully developed in those dissolution media. The correlation value showed that the test tablet had slightly stronger correlation than the reference one.
Fig. 4.
The observed and simulated plasma profiles using dissolution data from USP Apparatus 2 in all the dissolution media; reference tablet (A1,B1); test tablet (A2,B2). In phosphate buffer pH 4, 50 rpm (a); in phosphate buffer pH 1.2, 50 rpm (b); in phosphate buffer pH 6.8, 50 rpm (c); in water, 50 rpm (d); in phosphate buffer pH 6.8, 100 rpm (e); observed plasma concentration (f)
Fig. 5.
IVIVC plot for risperidone tablet, reference (a) and test (b); in phosphate buffer pH 4, 50 rpm (I); in phosphate buffer pH 1.2, 50 rpm (II); in phosphate buffer pH 6.8, 50 rpm (III); in water, 50 rpm (IV); in phosphate buffer pH 6.8, 100 rpm (V). In vitro–in vivo correlation
In the convolution approach, the level A IVIVC was developed by comparing the plasma concentration observed and plasma concentration predicted by GastroPlus™. Figure 6 showed the correlation. Result from regression analysis indicated that in vitro–in vivo correlation was also successfully established using the convolution approach. The value of correlation coefficient (r2) was close to 1. Again, the result showed that the test tablet had slightly stronger correlation compared to the reference one.
Fig. 6.
IVIVC plot for risperidone tablet reference (a) and test (b) using the convolution approach; in phosphate buffer pH 4, 50 rpm (I); in phosphate buffer pH 1.2, 50 rpm (II); in phosphate buffer pH 6.8, 50 rpm (III); in water, 50 rpm (IV); in phosphate buffer pH 6.8, 100 rpm (V)
Tables IV and V showed the percent prediction error for Cmax and AUC for reference and test tablet, respectively. Both Cmax and AUC of reference tablet gave the prediction error less than 10% which met with the U.S. FDA standard. The PE value of AUC of reference tablet in all dissolution media showed the similar extent (7.764, 7.766, 7.693, 7.764, 7.788%). This indicates that the extent of absorption is not affected by dissolution rate in all dissolution media. The similar value of percent prediction error of Cmax indicates that all dissolution media can be used as the media to establish the in vitro–in vivo correlation of risperidone tablet. Similar to the reference tablet, the value of percent prediction error of test tablet for Cmax and AUC also less than 10% and therefore met the FDA standard.
Table IV.
Percent Prediction Error (PE) for Cmax and AUC of Reference Tablet
| Observed values : Cmax = 9.648 (ng/ml), AUC = 57.83 (ng h/mL) | ||||
|---|---|---|---|---|
| Dissolution Media | Cmax (ng/ml) | PE (%) | AUC (ng h/mL) | PE (%) |
| Phosphate buffer pH 4 (50 rpm) | 10.28 | −6.55 | 60.77 | −5.08 |
| Phosphate buffer pH 1.2 (50 rpm) | 10.27 | −6.45 | 60.77 | −5.08 |
| Phosphate buffer pH 6.8 (50 rpm) | 9.94 | −3.01 | 60.74 | −5.03 |
| Water | 10.33 | −7.07 | 60.77 | −5.08 |
| Phosphate buffer pH 6.8 (100 rpm) | 9.51 | 1.41 | 60.70 | −4.96 |
Table V.
Percent Prediction Error (PE) for Cmax and AUC of Test Tablet
| Observed values : Cmax = 10.31 (ng/ml), AUC = 62.80(ng h/mL) | ||||
|---|---|---|---|---|
| Dissolution Media | Cmax (ng/ml) | PE (%) | AUC (ng/mL) | PE (%) |
| Phosphate buffer pH 4 (50 rpm) | 10.26 | 0.48 | 60.77 | 3.23 |
| Phosphate buffer pH 1.2 (50 rpm) | 10.19 | 1.16 | 60.77 | 3.23 |
| Phosphate buffer pH 6.8 (50 rpm) | 10.09 | 2.13 | 60.75 | 3.26 |
| Water | 10.35 | −0.39 | 60.77 | 3.23 |
| Phosphate buffer pH 6.8 (100 rpm) | 9.88 | 4.15 | 60.73 | 3.29 |
Biowaiver Consideration
The European Medicine Agency allows BCS-based biowaiver for immediate release tablet for BCS class I and III drugs (17). On the other hand, the Food and Drug Administration accepts BCS-based biowaiver for BCS class I drugs, highly soluble and highly permeable drugs. Recent suggestions point out that IVIVC-based biowaiver concept could be extended to some BCS class II drugs under assumption that the drug dissolves completely during the gastrointestinal passage. The scientific rationale for granting this extension biowaiver is that their oral absorption is most likely limited by in vivo dissolution. In vivo dissolution can be estimated in vitro; it is possible to establish an in vitro–in vivo correlation. Risperidone, both reference and test tablet showed, that the drug dissolved rapidly (more that 85% in the time less than 30 min), indicated that the IVIVC of the drug can be used as scientific basis of biowaiver. Risperidone immediate release tablet can be as a candidate of biowaiver.
Conclusion
The simulated absorption profile indicates that risperidone is a highly permeable drug where more than 90% of the dose was absorbed. With this value and its low water solubility, risperidone meets the criteria of class II of the biopharmaceutical classification system. The absorption of risperidone mainly takes place in the upper part of the gastrointestinal tract, i.e. duodenum and jejunum. Results from regression analysis indicate the in vitro–in vivo correlation for risperidone immediate release tablet can be established using the dissolution media which is regularly used in the Japanese Guideline for Bioequivalence Studies of Generic Products.
References
- 1.Janssen PAJ, Niemegreers CJE, Awouters F, Schellekens KHL, Megens AAHP, Meert TF. Pharmacology of risperidone (R64766), a new antipsychotic with serotonin-S2 and dopamine-D2 antagonistic properties. J Pharmacol Exp Ther. 1987;244:685–693. [PubMed] [Google Scholar]
- 2.Mannens G, Huang M, Meuldermans W, Hendrickk L, Woestenborghs R, Heykants J. Absorption, metabolism, and excretion of risperidone in humans. Drug Metabol Dispos. 1993;21:1134–1141. [PubMed] [Google Scholar]
- 3.http://www.drugbank.ca/drugs/DB00734
- 4.Janssen Inc. Risperdal Product Monograph: Canada, 2011, 1–58.
- 5.Grant S, Fitton A. Risperidone. A review of its pharmacology and therapeutic potential in the treatment of schizophrenia. Drugs. 1994;48:253–273. doi: 10.2165/00003495-199448020-00009. [DOI] [PubMed] [Google Scholar]
- 6.Takagi T, Ramachandran C, Bermejo M, Yamashita S, Yu LX, Amidon GL. A provisional biopharmaceutical classification of the top 200 oral drug products in the United States, Great Britain, Spain, and Japan. Mol Pharm. 2006;3:631–643. doi: 10.1021/mp0600182. [DOI] [PubMed] [Google Scholar]
- 7.Modi NB. In vitro–in vivo correlation. In Pharmaceutical Product Development, In Vitro–In Vivo Correlation, first edition; Dakshina M, Gangadhar S, David Y. Informa healthcare. 2007, pp 107–123.
- 8.Okumu A, Dimasi M, Lobenberg R. Computer simulation using GastroPlus™ to justify a biowaiver for etoricoxib solid oral drug product. Eur J Pharm Biopharm. 2009;72:91–98. doi: 10.1016/j.ejpb.2008.10.019. [DOI] [PubMed] [Google Scholar]
- 9.U.S. Department of Health and Human Services, Food and Drug Administration. Guidance for Industry, Dissolution Testing of Immediate Release Solid Oral Dosage Forms. 1997, 1–11.
- 10.Emami J. In vitro–in vivo correlation: from theory to applications. J Pharmaceut Sci. 2006;9:169–189. [PubMed] [Google Scholar]
- 11.Okumu A, Dimasi M, Lobenberg R. Dynamic dissolution testing to establish in vitro/in vivo correlation for montelukast sodium, a poorly soluble drug. Pharm Res. 2008;25:2778–2785. doi: 10.1007/s11095-008-9642-z. [DOI] [PubMed] [Google Scholar]
- 12.Simulationsplus,inc. GastroPlus™. Better Decisions through Better Science. 2010, 1–173.
- 13.http://www.nihs.go.jp/: Guideline for Bioequivalence Studies of Generic Products. 2006.
- 14.Huang ML, Van Peer R, Woestenborghs R. Pharmacokinetics of the novel antipsychotic agent risperidone and the prolactin response in healthy subjects. Clin Pharmacol Ther. 1993;54:257–268. doi: 10.1038/clpt.1993.146. [DOI] [PubMed] [Google Scholar]
- 15.Mannens G, Meuldermans W, Snoeck E, Heykants J. Plasma protein binding of risperidone and its distribution in blood. Psychopharmacology. 1994;114:566–572. doi: 10.1007/BF02244986. [DOI] [PubMed] [Google Scholar]
- 16.Paul E, Keck MD, Jr, Susan L. Clinical pharmacodynamics and pharmacokinetics of antimanic and mood-stabilizing medication. J Clin Psychiatr. 2002;63:3–11. [PubMed] [Google Scholar]
- 17.European Medicine Agency. Pre-authorisation evaluation of medicine for human use. 2007, 1–29.
- 18.He H, Richardson JS. A pharmacological, pharmacokinetic and clinical overview of risperidone, a new antipsychotic that blocks serotonin 5-HT2 and dopamine D2 receptors. Int Clin Psychopharmacol. 1995;10:19–30. doi: 10.1097/00004850-199503000-00003. [DOI] [PubMed] [Google Scholar]
- 19.Zhou Z, Li X, Peng H, Yu X, Yang M, Su F, Wang F, Zhu R, Deng C, Lin Q, Wang C, Li W, Lin S, Li H. Multiple dose pharmacokinetics of risperidone and 9-hydroxyrisperidone in Chinese female patients with schizoprenia. Acta Pharmacologica Sinica. 2006;27:381–386. doi: 10.1111/j.1745-7254.2006.00256.x. [DOI] [PubMed] [Google Scholar]
- 20.Belotto KC, Raposo NR, Ferreira AS, Gattaz WF. Relative bioavailability of two oral formulations of risperidone 2 mg: a single-dose, randomized-sequence, open-label, two-period crossover comparison in healthy BRAZILIAN volunteers. Clin Ther. 2010;32:2106–2115. doi: 10.1016/j.clinthera.2010.11.006. [DOI] [PubMed] [Google Scholar]
- 21.Schaick EA, Lechat P, Remmerie BM, Ko G, Lasseter KC, Mannaert E. Pharmacokinetic comparison of fast-disintegrating and conventional tablet formulations of risperidone in healthy volunteers. Clin Ther. 2003;25:1687–1699. doi: 10.1016/S0149-2918(03)80163-7. [DOI] [PubMed] [Google Scholar]
- 22.Chasseaud LF. Process of Absorption, Distribution, and Excretion, 1–33.


