Abstract
The interest in and need for formulating miconazole nitrate (MN), a broad-spectrum antifungal, as an oral disintegrating tablet for treatment of some forms of candidiasis have increased. Formulation of MN in this dosage form will be more advantageous, producing dual effect: local in the buccal cavity and systemic with rapid absorption. Four formulations were prepared utilizing the foam granulation technique. The prepared tablets were characterized by measuring the weight uniformity, thickness, tensile strength, friability, and drug content. In addition, tablet disintegration time, in vitro dissolution, and in vivo disintegration time were also evaluated. Stability testing for the prepared tablets under stress and accelerated conditions in two different packs were investigated. Each pack was incubated at two different elevated temperature and relative humidity (RH), namely 40 ± 2°C/75 ± 5% RH and 50 ± 2°C/75 ± 5% RH. The purpose of the study is to monitor any degradation reactions which will help to predict the shelf life of the product under the defined storage conditions. Finally, in vivo study was performed on the most stable formula to determine its pharmacokinetic parameters. The results revealed that all the prepared tablets showed acceptable tablet characteristics and were stable under the tested conditions. The most stable formula was that containing magnesium stearate as lubricant, hydrophobic Aerosil R972 as glidant, low urea content, mannitol/microcrystalline cellulose ratio 2:1, and 9% Plasdone XL100 as superdisintegrant. The in vivo results revealed that the tested formula showed rapid absorption compared to the physical blend (tmax were 1 and 4 h, respectively), while the extent of absorption was almost the same.
KEY WORDS: accelerated stability testing, bioavailability, foam granulation technique, miconazole nitrate, oral disintegrating tablet
INTRODUCTION
Granulation is a process of particle size enlargement that results in modification of the product physical properties like wettability, flowability, bulk density, and product appearance. Two types of granulation techniques are employed in pharmaceutical industry, namely wet Granulation and dry Granulation. In the former, a liquid solution is added to the powder which must be volatile so that it can be removed by drying to produce densely mass, and then the granules are milled. While in the latter, granules are formed without using a liquid solution under high pressure from either a heavy-duty tabletting press or the powder is squeezed between two rollers to produce a sheet of materials. It previously stated that dry granulation is not the most suitable technique for many active substances that are in high dosages or in fine powder form (1). Recently, novel granulation technologies have been sparked such as pneumatic dry granulation (2), freeze granulation technology (1,3), melt granulation technology (4), steam granulation (5), moisture-activated dry granulation (6), and thermal adhesion granulation process (7). Also, foamed binder technologies have recently been developed by Dow Chemical Company with a great number of benefits (8).
Miconazole nitrate (MN) is a broad-spectrum antifungal agent that has been extensively applied for the management of buccal (9), dermal (10), and vaginal (11) candidiasis. Several buccal drug delivery devices containing miconazole were developed such as chewing gum (12), oral gel, and bioadhesive buccal tablets (13). Foam granulation is an aqueous-based technique which is considered environmentally friendly, does not pollute the surrounding environment, and does not need special expensive flame area and equipment. It is based on the incorporation of air into conventional water-soluble polymeric excipients in which the resulting foam has a consistency like shaving cream. The technique provides easy and efficient particle coverage within a short time and excellent flow characteristics of the formed granules that make it superior to the other commonly used techniques such as spray liquid binders especially upon handling of potent drug compounds (1).
To evaluate a new drug product or formulation, stability testing which may be real time or accelerated (short term) must be performed. In the former, the duration of the test period should normally be long enough to allow determination of significant product degradation that may occur under normal storage conditions and the test should be extended for a period long enough to indicate clearly that no measurable degradation occurs during storage, while the stress conditions that accelerate drug degradation include exaggerated conditions of temperature, light, humidity, pH, and others. The International Conference on Harmonization (ICH) guidelines some rules that govern this stability testing (14). Of prime importance is the availability of validated stability-indicating testing methods that predict those features which are susceptible to change during storage and are likely to influence quality, safety, and/or efficacy. The ICH guidelines emphasize that these analytical procedures are valid and suitable for the qualitative and quantitative determination of the degradation products (15).
The effectiveness of new drug formulation requires determination of the drug pharmacokinetic profiles which are an essential part of a new drug product or formulation development steps that require blood sampling over several time points, preferably without disrupting the physiological status of the animals (16). Scientifically based methods to predict the in vivo drug release performance of pharmaceutical dosage forms are beneficial in order to minimize animal experiments, reduce drug development duration, and allow a quality control of the release properties of the dosage forms. Various physicochemical, biopharmaceutical, and physiological factors need to be considered to achieve a successful correlation between in vitro data and in vivo parameters. Guidance for IVIVC models are proposed for oral (17,18), parenteral (18,19), and transdermal dosage forms (17,18).
The main aim of the present study was to develop miconazole oral disintegrating tablets (ODT) to ensure satisfactory drug level in the blood and improve its bioavailability. Furthermore, accelerated stability study on the prepared tablet performance was investigated to help judging the quality of the new foam granulation technique.
MATERIALS AND METHODS
Materials
MN USP32 was supplied by Sharon Biomedicine Ltd. (Mumbai, India). Mannitol USP32 direct compression grade was supplied by Roquette (Lestrem, France). Microcrystalline cellulose (MCC; Avicel PH101) and croscarmellose sodium were supplied by FMC International (Wallingstown, Little Island Co. Cork, Ireland). Hydroxypropyl methylcellulose (HPMC) was supplied by BASF Company (Ulm, Germany). Urea analytical grade, sodium starch glycolate, and Explotab low pH and high pH were supplied by JRS (Rosenberg, Germany). Plasdone XL100 was supplied from ISP (Baar, Switzerland). Colloidal silicon dioxide; Aerosil 200, 300, and 380; and R972 were supplied from Evonik (Frankfurt, Germany). Sodium lauryl sulfate was from Fisher Scientific (Pittsburg, PA, USA). Magnesium stearate was supplied by Kirsch pharma company (Salzgitter, Germany). F D Green No. 3 (Fast green color) was supplied by Univar (Cheshire, UK). Methanol HPLC far UV and acetonitrile HPLC far UV were supplied from Merck Chemicals Co. (Darmstadt, Germany). Ammonium acetate and potassium bromide were supplied from Panreac Quimica SA (Barcelona, Spain). Other chemicals were of analytical grade and used as received.
Methods
Preparation of MN ODTs
The formulations composition and the parameters of granulation process are mentioned in Table I. The foam granulation technique was carried out using laboratory-scale high-shear double-jacketed granulator (Chitra, India), which is equipped with three-bladed impeller of plow-like shape fixed in the bottom of the pot; the impeller has variable speed and is equipped with chopper that is fixed in the lid. An accurately weighed 50 g MN was mixed with the predetermined intragranular disintegrant, mannitol, and MCC quantity. The granulating liquid was prepared by dispersing 2 g HPMC (1% w/w of the formula) in the predetermined amount of purified water then dissolving the specified amount of urea. The granulating liquid quantity was fixed to be 35% w/w of the dry granulating mass, it was pumped through the foam generating pump after 5 min of starting the granulation process, and the chopper was operated at fixed speed 800 rpm. The granulation process was continued till getting the suitable type of granules. The wet granules were dried by placing in trays in vacuum oven (Binder, Germany) at 70–80°C till the residual moisture content does not exceed 2%. The loss on drying was measured using moisture analyzer apparatus (Mettler Toledo, Switzerland). The dried granules were milled by using the predetermined milling parameters. The theoretical weight of each formula was 200 g.
Table I.
Formulations Composition and Processing Parameters for Preparing MN Tablets
| Parameter | Formula code | |||
|---|---|---|---|---|
| F1 | F2 | F3 | F4 | |
| Lubricant type | Sodium lauryl sulfate | Sodium lauryl sulfate | Magnesium stearate | Magnesium stearate |
| Disintegrant type | Croscarmellose sodium | Explotab low pH | Plasdone XL100 | Croscarmellose sodium |
| Intragranular disintegrant (g) | 4.8 | 10.8 | 9.0 | 14.4 |
| Disintegrant (%) | 6 | 9 | 9 | 12 |
| Glidant type | Aerosil 300 | Aerosil 300 | Aerosil R972 | Aerosil 380 |
| Urea (g) | 18 | 24 | 6 | 6 |
| Mannitol (g) | 58 | 78 | 81 | 58 |
| Microcrystalline cellulose (g) | 58 | 26 | 41 | 58 |
| Impeller speed (rpm) | 100 | 80 | 100 | 80 |
| Milling parameters | ||||
| (a) Sieve diameter (μm) | 1,000 | 1,000 | 500 | 500 |
| (b) Speed (rpm) | 1,000 | 2,000 | 1,000 | 2,000 |
| Volume of water (ml) | 59.8 | 57.7 | 63.4 | 63.1 |
| Tablet hardness (N) | 25 | 25 | 25 | 35 |
The milled granules were evaluated by calculating their densities (20), Hausner ratio, Carr’s index (21), flow rate (22), and angle of repose (22). The glidant (Aerosil) and lubricant were added to the granules and mixed for 2 min using three-dimensional blender of 5 l capacity (Hualian, China). The lubricated granules were compressed to the prespecified tablet hardness using rotary press with variable speed (Karnavati Engineering Ltd., India) equipped with 8-mm-diameter tools in which the tablet weight was adjusted to 200 mg. The rotary tablet press was run at low speed 5 rpm to guarantee accurate filling of the die.
Differential Scanning Calorimetry
Miconazole nitrate and mixtures of the drug with the studied excipients were examined using differential scanning calorimetry (DSC) ambient-type apparatus (PerkinElmer Corp., USA). The temperature range was from 20°C to 400°C with a heating range 10°C/min.
Fourier Transform Infrared Spectroscopy
The spectra of miconazole and the studied excipients were obtained from a KBr disk with a PerkinElmer GX FT-IR spectrophotometer (Beacons-field, United Kingdom). The frequency range was between 4,500 and 600 cm−1.
Evaluation of the Prepared MN ODTs
The prepared MN ODTs were subjected to the common quality control tests viz. visual inspection, thickness, weight uniformity, friability, drug content, hardness, as well as in vitro disintegration test. The prepared tablets were visually inspected; the upper and lower punches were checked by the naked eye for the presence of sticking or picking. Tablet thickness was measured using dial thickness gauge (Mitutoya, Japan) in which thickness measurement was performed directly after compression process. Uniformity of weight test was performed according to the method described in USP34. Friability was determined according to standard method described in USP34 using Friability tester (Pharmatest, Germany). The drug content was determined by accurately weighing portion of the ground tablets equivalent to about 50 mg MN, dispersed in 25 ml of 50% methanol after which the samples were filtered using syringe filter and assayed using the HPLC method described in analytical method validation.
Hardness was determined according to standard method described in BP 2010 using tablet hardness tester (Pharmatest, Germany). The tablet tensile strength was calculated by using the following equation: σt = 2P/[πDt], where σt is tablet tensile strength, P is fracture load in newtons, D is tablet diameter in centimeters, and t is tablet thickness in centimeters (23). In vitro disintegration time of ODTs was determined according to standard method described in USP34 using tablet disintegration test apparatus (Pharmatest).
In Vitro Dissolution Studies
The drug release was determined using USP standard dissolution tester, Apparatus I that has an autosampler system based on peristaltic pump (Pharmatest). Dissolution was carried out in 900 ml 0.45% w/w sodium lauryl sulfate pH adjusted to 6.5 ± 0.5. The basket was rotated at 75 rpm at 37 ± 0.5°C. Samples were withdrawn and immediately replaced with equal volumes of freshly prepared 0.45% sodium lauryl sulfate at specified time intervals (0.5, 1, 2, 3, 5, 7.5, 10, 15, 20, and 30 min). Samples were adequately diluted and analyzed spectrophotometrically for their MN content at 230 nm (UV Spectrophotometer, 1650 PC, Shimadzu, Kyoto, Japan). These conditions were selected to maintain the sink condition since miconazole is slightly soluble in water and to be in agreement with the dissolution of MN vaginal suppositories stated in the USFDA except for slight modification to make the process more discriminating (24). The experiments were done in triplicates.
In Vivo Disintegration Time
Measurement of the disintegration time for the prepared four formulae was carried out according to the method previously described by Okuda et al. (25). Briefly, six healthy volunteers were randomized selected and asked to rinse their mouth with sufficient water before starting of the test. Each person was asked to place the ODT on his/her tongue, and the time taken from placing the tablets until complete disintegration of the administered formulae was recorded. The test was performed at 24-h intervals. To avoid bias and ensure better judgment, the following instructions were advised to each person participating:
Only gentle movement of the tablet against the upper part of the mouth with their tongue is to be done.
No crushing, chewing, or tumbling from side to side of the tablet is allowed.
Swallowing of the saliva is prohibited during the evaluation.
Each person was informed to rinse his/her mouth after each measurement.
It is important to mention that all personnel participating were informed about the purpose of the test and their consents were taken.
Accelerated Stability Testing
The prepared tablets were packed in two different package materials and kept in incubators; one of them was maintained at 40 ± 2°C/75 ± 5% relative humidity (RH) while, the other was maintained at 50 ± 2°C/75 ± 5% RH for 6 months. The first group of the formulae was packed in a blister pack consisting of transparent colorless polyvinylidene chloride (PVdC) laminate heated at temperature 135 ± 2°C and sealed with plain heat sealable side lacquered hard aluminum at 120 ± 2°C, while the second group was packed in glass bottles closed with 28-mm child-resistant cap. The bottles were filled manually with 30 tablets and closed properly. The tablets were evaluated for the change in the appearance, drug content, dissolution and disintegration time during 1–6 months. The loss on drying was carried out after 3 and 6 months on the tablets packed into blisters. The data presented were the mean of three determinations. Accelerated and stress stability were conducted to calculate the proposed shelf life of the prepared MN ODTs. The tested tablets were investigated using scanning electron microscope (SEM) to help understanding and interpreting the results.
In Vivo Evaluation of Selected MN ODTs
The most stable formulated ODTs containing MN and having selective release characteristics were chosen for the in vivo study compared to a physical blend have MN with the same excipients of the tested formula.
Study Design
A single-dose, one-period parallel design was chosen. The drug dose (3 mg) and the sampling points were determined as per USFDA guidance “the sampling times should extend to at least three multiples of the drug’s apparent terminal elimination half-life, beyond the time when maximum blood concentrations are achieved” (26). A previous study stated that the t1/2 for MN is 1.8 ± 0.4 h and tmax is 1.7 ± 0.2 h (27). Wistar rats with average weight 180 g were used for the in vivo study. The rats were acclimatized for 1 week before the study in a temperature-controlled room. The rats were kept with free access to food and water. During this week, the animals were maintained with a 12-h light/darkness cycles. The study was started during the light cycle. Animals were divided into two groups (n = 3), and the drugs were administered as follows:
-
Group I
Miconazole nitrate ODTs
-
Group II
MN physical blend with mannitol and microcrystalline cellulose (30:47:23).
The ratio of mannitol/ microcrystalline cellulose was the same of the testing formula. The dose was administered in the form of oral suspension using gastric tube.
Sample Collection
Blood samples were collected in glass tubes before administration of the dosage form, and at 0.5, 1, 2, 4, 6, and 9 h after drug administration. All samples were collected through the orbital plexus, and plasma was immediately separated from the blood cells by centrifugation at 6,000 rpm for 10 min and stored frozen at −20°C till HPLC analysis.
HPLC Determination of MN in Rat Plasma
A Waters HPLC system (Waters Corporation, MA, USA) apparatus was used, consisting of Waters In-Line Degasser AF Model code DG2, Waters 2487 Dual λ Absorbance Detector, Waters 1525 Binary HPLC Pump, and Waters 717 plus Autosampler. For separation, Kromasil 100® C18, 5 μm (150 × 4.6 mm) column was used and the UV detector was set at 235 nm wave length. The injection volume was 20 μl. Stock solution of the drug was prepared by dissolving known concentration of MN in methanol. Different drug concentrations were prepared by diluting the stock solution using Wistar rat plasma. The mobile phase was prepared by dissolving 6 g ammonium acetate in 1 l of a mixture of acetonitrile, methanol, and water in ratio 45:35:20, respectively, and was delivered to the system at a flow rate of 1.5 ml/min. The mobile phase was prepared weekly and filtered before use through a 0.45-mm membrane filter and degassed prior to use. MN standard solution was prepared by dissolving 50 mg of the drug in 25 ml methanol. From this stock solution, different drug concentrations were prepared to construct the standard calibration curve.
Pharmacokinetic Data Analysis
The following pharmacokinetic parameters were determined; maximum plasma concentration (Cmax), time point of maximum plasma concentration (tmax), area under the plasma concentration–time curve from 0 h to the last measurable concentration (AUC0–t), area under the plasma concentration–time curve from 0 h to infinity (AUC0–∞), and the area under the moment curve from zero time to the end (AUMC0–end). Similarly, the apparent volume of distribution (Vd), and the total renal clearance were determined using pharmacokinetic software Kinetica™ (version 4, Thermo Scientific, MA, USA).
Results and Discussions
Analytical Method Validation for MN Assay
The chromatographic conditions were selected to be in consistence with that stated in the USP except for slight modification in the mobile phase. The results of the analytical method validation showed that the developed method is sensitive and selective enough to be used for quantitative analysis of potency. The system was found to be repeatable as the percentage relative standard deviation of six replicates of the standard solution was 0.12%. The correlation coefficient (r) was 0.9994. The linearity was established within the range 1.0–2.4 mg/ml and obeys Beer’s law in that range. No interference between MN and other excipients in the product was found, and the method was considered selective.
HPLC Standard Curve for MN in PLASMA
The chromatogram of the drug-free plasma did not show any endogenous plasma interference at the retention time of MN. The drug retention time was 8 min, and the chromatogram of the drug-free plasma did not show any interfering compound extracted from the sample.
Preparation of MN ODTs
The proposed design for the four formulae stated in Table I was chosen among our previous work since they gave the best results among the previously studied trials in the characterization of granules formed. These characterizations showed in Table II include densities and flowability parameters of granules. The foam quality for the binder solution composed of HPMC, and different percent of urea showed that the binder solution with low urea content results in fine foam while high urea content results in coarse foam. Scaling up of such formulation shall be much easier than routine wet granulation since the formula is insensitive to the processing variables. For the aforementioned concept, the foam granulation is easily scaled up taking into account few issues such as the rate of binder addition and nozzle placement (28).
Table II.
Characters of MN Granules Prepared by Foam Granulation Technique
| Parameter | Formula code | |||
|---|---|---|---|---|
| F1 | F2 | F3 | F4 | |
| Bulk density (g/cc) | 0.36 | 0.40 | 0.38 | 0.40 |
| Tapped density (g/cc) | 0.49 | 0.52 | 0.50 | 0.52 |
| Hausner ratio | 1.36 | 1.30 | 1.32 | 1.30 |
| Carr’s index (%) | 26 | 24 | 24 | 23 |
| Angle of repose (°) | 31.3 | 30.9 | 28.1 | 26.6 |
| Flow rate (g/s) | 1.7 | 1.0 | 0.8 | 0.6 |
DSC Chromatogram
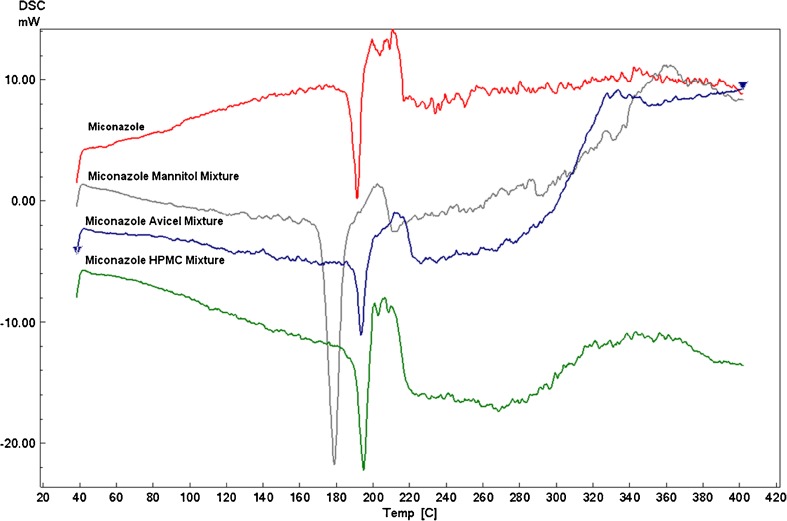
Mixing the drug with the studied excipients does not significantly affect the miconazole endothermic peak which was displayed at around 190°C as illustrated in Fig. 1. Avicel and HPMC drug mixtures maintain the same drug endothermic peak while mannitol shifts the peak slightly to the left and so need further investigation which was performed by the FT-IR.
Fig. 1.
DSC thermograms of MN alone and MN–mannitol, MN–Avicel, and MN-HPMC physical mixtures
IR Spectroscopy
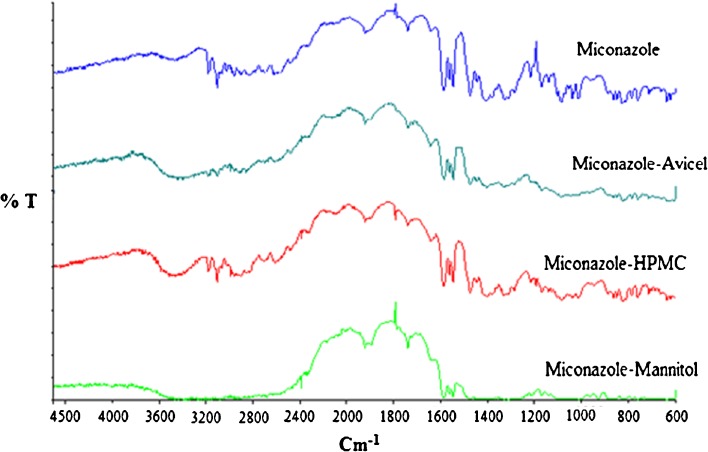
The IR spectrum of the drug alone showed a characteristic peak at 1,589 cm−1 related to stretching of C–C bond of dichloro-substituted benzene ring, and a peak at 1,470 cm−1 related to CH bending of the two dichlorobenzene groups and to the CH bending of the C6 and C17 (29,30). The spectra of the drug mixtures showed the same drug characteristic peaks which indicate compatibility as depicted in Fig. 2.
Fig. 2.
FT-IR spectra of MN alone and MN–mannitol, MN–Avicel, and MN–HPMC physical mixtures
Characterization of the Prepared Tablets
The compressed tablets showed neither sticking nor picking. The punches were clean and the tablet logos were clear. Table III shows the results of the tablet thickness which was used to calculate the tensile strength, weight variation, and friability. Tablet weight variation is significantly affected by mannitol/MCC ratio. The increase in mannitol resulted in more weight variation. The SEM micrographs of the tablets surfaces show that mannitol exhibited crystal change into needle shaped which had poor flowability. These obtained results consistent with previous work, emphasizing that the moisture could induce polymorphic transition of crystalline mannitol (31). Tablet tensile strength was affected by urea concentration, Aerosil type, and lubricant type, but these effects were not significant. The tensile strength of tablets may be affected by a variety of factors such as particle shape, surface texture, particle size, and crystal structure. The increase in urea concentration results in higher tensile strength of the produced tablets which may be explained by the ability of urea molecules to form hydrogen bonding between the molecules. One urea molecule is able to make eight hydrogen bonding (32). Tablet friability is significantly affected by tablet hardness. Increasing tablet hardness is a result of increasing the compression force which results in increasing the bonding of the granules and hence decreasing the tablet friability. The results of the drug content in the prepared compressed tablets were within the range 90.0–110% which met the common pharmacopeia limit (33).
Table III.
Quality Control Tests of the Prepared MN ODTs
| Formula code | Thickness (mm) | Tensile strength (N/cm2) | Weight variation (%) | Friability (%) | Drug content (%) | In vitro disintegration time (s) | Cumulative % released after 15 min |
|---|---|---|---|---|---|---|---|
| F1 | 3.53 | 56.4 | 0.62 | 0.45 | 100.8 | 40 | 94.4 |
| F2 | 3.02 | 65.9 | 2.10 | 0.67 | 101.5 | 35 | 98.5 |
| F3 | 3.76 | 52.9 | 0.95 | 0.44 | 97.9 | 35 | 100.0 |
| F4 | 3.52 | 79.2 | 1.70 | 0.18 | 96.6 | 18 | 100.0 |
In Vitro Disintegration Time
The disintegration time for all the studied formulae was below 180 s which is the limit in the European pharmacopeia as shown in Table III The studied formulae contain not less than 9% superdisintegrant, and 50% of this concentration was added as intragranular disintegrant. All these formulations were compressed to get hardness 35 N or less. F4 showed the fast disintegration (18 s) followed by F2 and F3. F4 contains 12% croscarmellose sodium, relative high content of MCC, and hydrophilic Aerosil 380; these ingredients may attribute in accelerating the disintegration of the tablets. F2 and F3 have the same disintegration time (35 s); both have the same tablet hardness and same disintegrant concentration. F2 has more hydrophilic tablet surface than F3 due to the presence of hydrophilic glidant, hydrophilic lubricant, and high concentration of urea. On the other hand, F3 was characterized by higher total porosity (30% more than that of F2) and higher MCC content. MCC has disintegrating properties which may add positive effect to enhance the tablet wetting time and disintegration time. The tablet hardness is directly proportional to the disintegration time; at the same time, it was concluded that the calculated tablet total porosity does not have any significant effect on the disintegration time.
In Vitro Dissolution Study
The results of the cumulative percentage drug released after 15 min were shown in Table III. The enhanced dissolution is related to the use of hydrophilic excipients which ensure wettability as well as rapid uptake of water. The main advantage of using water as granulating liquid is the enhancement of the hydrophilization of MN and hence enhancing its dissolution. It is previously demonstrated that the release of hydrophobic drugs can be improved by the hydrophilization process which was achieved by creation of hydrophilic surface on the drug (34). Also, the solubility of MN could be enhanced by water-soluble excipients as previously reported (35).
In Vivo Disintegration Time
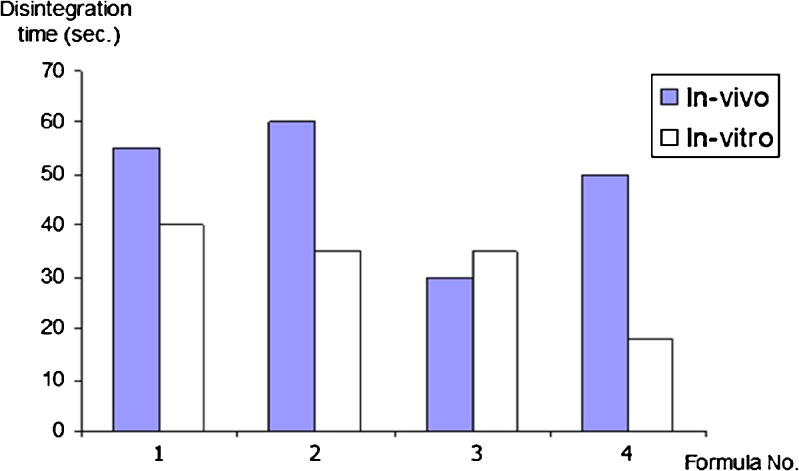
The in vivo disintegration time compared to the in vitro results is illustrated in Fig. 3. It was noted that most of the in vivo disintegration time results are longer than that of in vitro; this could be explained by the low saliva volume (7 ml) compared to the high-volume in vitro testing (700 ml). All the results are complying with the European pharmacopeia standard for oral dispersible tablets (NMT 3 min).
Fig. 3.
In vivo and in vitro disintegration time of MN ODTs
Accelerated Stability Testing
ODTs containing MN were subjected to stability study maintained at 40 ± 0.5°C/75 ± 5% RH and 50 ± 0.5°C/75 ± 5% RH for 6 months with fulfillment of ICH guidelines for stress testing (36), except for a slight modification in the testing frequency which was modified to be 0, 2, 4, 8, 12, 16, 20, and 24 weeks. Patches of F1 and F2 packed in blisters and stored at 40°C and 50°C showed marked deformation than the other two formulae as illustrated in Fig. 4, which may be attributed to the high urea content of the former. This remarkable deformation may be due to partial sublimation of the residual urea during storage that results in expansion of the tablet pocket and deformation in PVdC blisters. The sublimation was confirmed by SEM micrograph at 6 months interval that revealed the porous surface for F1 and F2 tablets.
Fig. 4.
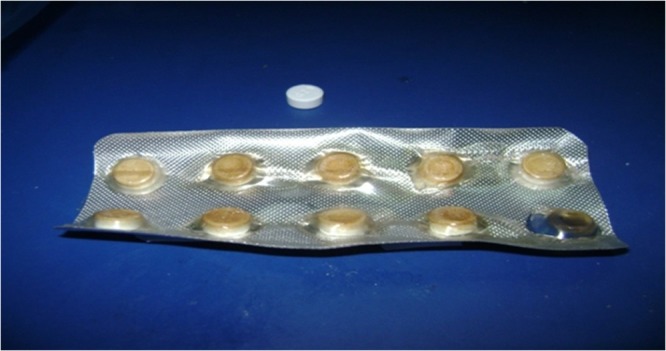
Deformation of blister of MN ODTs (F2) after storage at 50°C for 2 months
The results of the disintegration time showed that all samples at zero time were below 60 s. The disintegration time of tablets stored in glass bottle at both storage conditions was below 180 s which comply with the EP disintegration limit for ODTs (37). Whereas, tablets packed in PVdC blisters showed prolonged disintegration time which may be due to the absorption of moisture during storage which decreases the efficiency of the disintegrant. F1 showed more prolonged disintegration time than that of F2 owing to the presence of croscarmellose sodium which have high tendency to adsorb more moisture than Explotab in F2 which is in agreement with Faroongsarng et al. (38) who reported that croscarmellose sodium adsorb more than 400% of moisture upon storage at 85% RH while Explotab adsorb more than 300% of moisture if kept at same humidity level. Also, porosity of the tablets plays a major role in the disintegration as shown from the results of F1 and F4 which have the same disintegrant type and mannitol/MCC ratio, but the disintegration of F1 was increased five times although it contains 50% less of the disintegrant concentration of F4. This increase may be due to F1 is more porous (34.6%) than F4 (30.0%) which may be attributed to the presence of residual urea that sublime with time resulted in more porous matrix which disintegrates rapidly. F3 and F4 were not affected by storage conditions. F3 was the most stable formula even in PVdC blisters at 75% RH although it contains relatively high percentage of disintegrant (9% Plasdone XL), but the effect of hydrophobic lubricant, magnesium stearate, and the hydrophobic glidant, Aerosil R972, seems to protect the compressed tablets.
The release profiles of MN ODTs stored in glass bottles at different conditions revealed that the amount of drug released exceed 70% which is the common limit for dissolution for nonofficial drugs in British pharmacopeia 2010. While the dissolution of MN ODTs packed in PVdC blisters especially, F1 stored at 40°C/75% RH showed a considerable decline in the dissolution rate. The dissolution rate was 15% after 24 weeks which is due to prolonged time of disintegration. This may be related to loss on drying that was sharply increased from 1.77% to 9.14% after 12 weeks. Also, F4 packed in PVdC blister showed deterioration after 24 weeks storage at 40°C/75% RH and the dissolution rate was 35%.
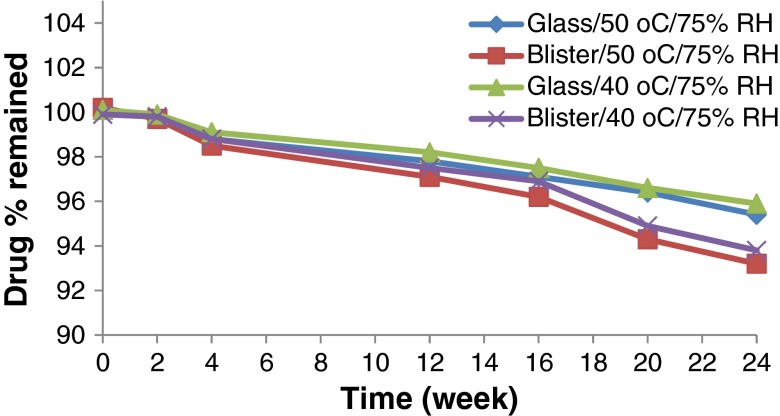
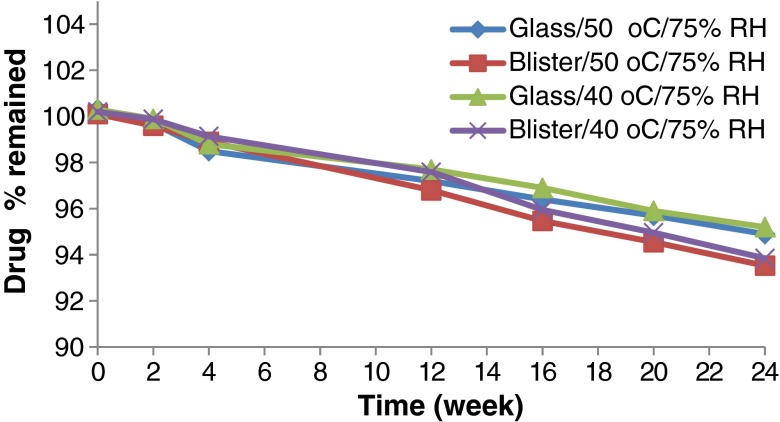
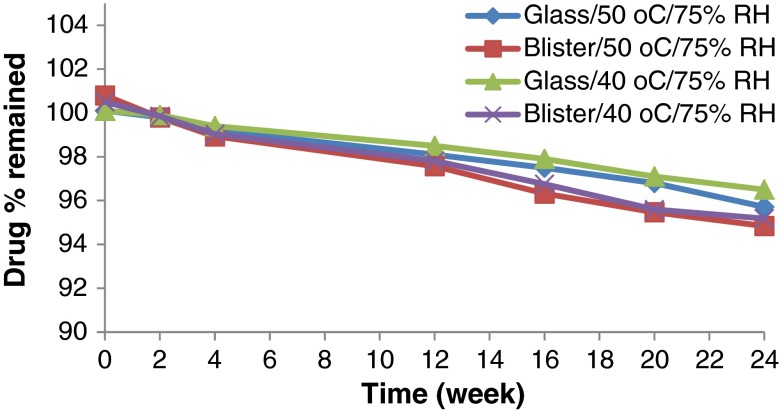
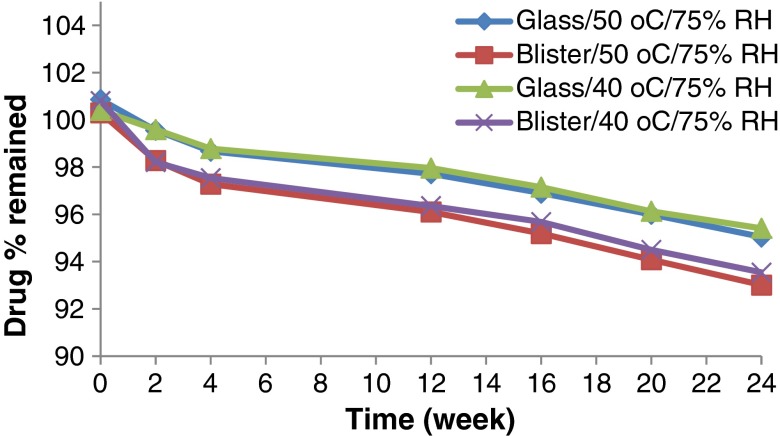
Accelerated stability testing could be of value in monitoring any degradation reactions which will help to predict the shelf life of a drug substance or drug product under the defined (ICH) storage conditions. The effect of storage of the formulated MN ODTs at two elevated temperatures (40°C and 50°C) on drug chemical stability was studied. All the formulation exhibited excellent drug content over the period of 6 months that met the common pharmacopeia limit (90–110%) as declared from Figs. 5, 6, 7 and 8. The correlation coefficient (r) values were determined according to zero-, first-, and second-order equations using the percentage of drug remaining after specified time intervals over a period of 6 months. The degradation of MN was found to be a zero-order reaction based on the mean values of the correlation coefficient (r). The decomposition rate constants K40 and K50 were determined at each temperature using Arrhenius’ equation. The energy of activation (Ea) and the decomposition reaction rate constant at room temperature (K20) were determined. The value of t1/2 and t90 were also estimated for each formula. Figures 5, 6, 7 and 8 show the accelerated stability testing of MN ODTs at the two elevated temperatures. The data of t90 of F3 tablets packed in glass bottles seems promising from the marketing point of view, because t90 was about 2 years as shown in Table IV which complies with the official requirements.
Fig. 5.
Effect of ageing on the drug content of F1 stored under different stress conditions
Fig. 6.
Effect of ageing on the drug content of F2 stored under different stress conditions
Fig. 7.
Effect of ageing on the drug content of F3 stored under different stress conditions
Fig. 8.
Effect of ageing on the drg content of F4 stored under different stress conditions
Table IV.
Kinetic Parameters for Accelerated Stability Testing of MN ODTs Packed in Different Package at Two Elevated Temperatures After 6 Months
| Formula code | K 40 (week−1) | K 50 (week−1) | E a (cal/mol) | K 20 (week−1) | t 1/2 (year) | t 90 (year) | |
|---|---|---|---|---|---|---|---|
| F1 | Packed in glass bottles | 0.169 | 0.183 | 1,607.6 | 0.142 | 7.342 | 1.468 |
| F2 | 0.200 | 0.209 | 841.2 | 0.183 | 5.701 | 1.140 | |
| F3 | 0.146 | 0.170 | 3,081.3 | 0.104 | 9.999 | 1.9997 | |
| F4 | 0.183 | 0.195 | 1,265.5 | 0.159 | 6.540 | 1.308 | |
| F1 | Packed in PVdC blisters | 0.248 | 0.276 | 2,161.2 | 0.196 | 5.328 | 1.066 |
| F2 | 0.262 | 0.276 | 988.0 | 0.235 | 4.426 | 0.885 | |
| F3 | 0.210 | 0.222 | 1,177.5 | 0.184 | 5.657 | 1.131 | |
| F4 | 0.231 | 0.254 | 1,881.9 | 0.188 | 5.535 | 1.107 | |
The results for loss on drying (LOD) were shown in Table V. In F1 packed in PVdC blisters, the presence of high MCC content (29%) and the hygroscopic croscarmellose sodium (6%) enhanced the water adsorption. Microcrystalline cellulose is capable of adsorbing up to 10% moisture when stored at high relative humidity, while croscarmellose sodium can adsorb 25%, urea can adsorb up to 4% and mannitol can adsorb up to 5%. The real adsorbed moisture was higher than theoretical calculated adsorbed moisture (7.98%). This may be explained by the highly hydrophilic nature of the tablet surface caused by the water-soluble lubricant “sodium lauryl sulfate,” the hydrophilic glidant “Aerosil 300,” and the relatively high porosity (34.6%). In F2 packed in PVdC blisters, the presence of low MCC content (13%), the high quantity of mannitol (39%), urea (12%), Explotab (9%), and the hydrophilic lubricant on the tablet surface (sodium lauryl sulfate) enhanced the water adsorption. It was noted that the real adsorbed moisture (9.72%) is higher than theoretical calculated adsorbed moisture (6.4%). This may be explained by the highly hydrophilic nature of the tablet surface caused by the water-soluble lubricant “sodium lauryl sulfate” and the hydrophilic glidant “Aerosil 300.” In F3 packed in PVdC blisters, the presence of low MCC content (20%), the high quantity of mannitol (40%), urea (3%), Plasdone XL (9%), and the hydrophobic lubricant on the tablet surface (magnesium stearate) discourage the water adsorption. The real adsorbed moisture (4.68%) was lower than theoretical calculated adsorbed moisture (6.7%); this may be explained by the hydrophobic nature of the tablet surface caused by the lubricant “magnesium stearate” and the hydrophobic glidant “Aerosil R972”. The theoretical calculated adsorbed moisture for F4 was (7.2%) while the actual result of tablet packed in Alu/PVdC blisters is 6.24%; this could be explained by the relative hydrophobic tablet surface imparted by magnesium stearate and the relatively low porosity (30.0%).
Table V.
The Loss on Drying Percentage for MN ODTs at Different Time Intervals
| Formula code | Zero time | 3 months at 40°C/75% RH | 6 months at 40°C/75% RH |
|---|---|---|---|
| F1 | 1.77 | 9.14 | 9.27 |
| F2 | 0.93 | 8.70 | 9.72 |
| F3 | 1.46 | 5.00 | 4.68 |
| F4 | 1.28 | 6.10 | 6.24 |
MN ODTs stored in glass bottles at 40°C and 50°C showed acceptable properties compared to that packed in PVdC blisters. Statistical analysis of the data showed that the lubricant type and the Aerosil type significantly affect the loss on drying of the ODTs. The increase in hydrophobicity of the lubricant results in decreasing the expected LOD. The use of hydrophobic material results in lower LOD result during the stability study. This principle can be used as new tool to enhance the physical stability of ODTs.
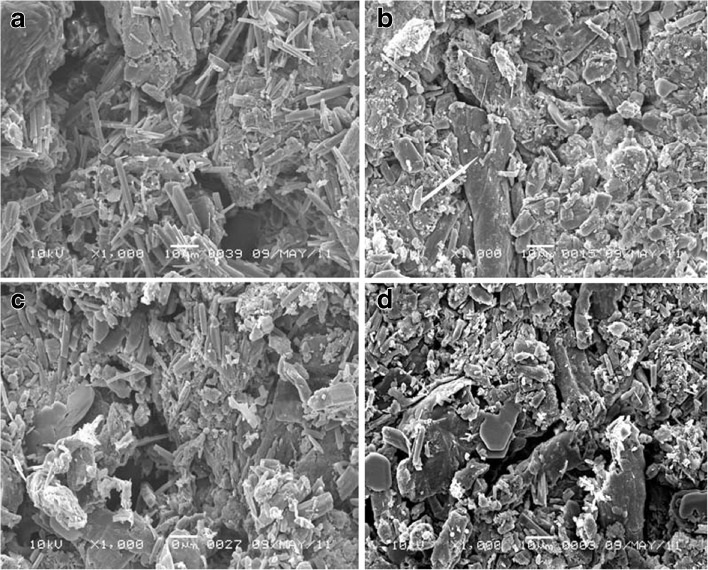
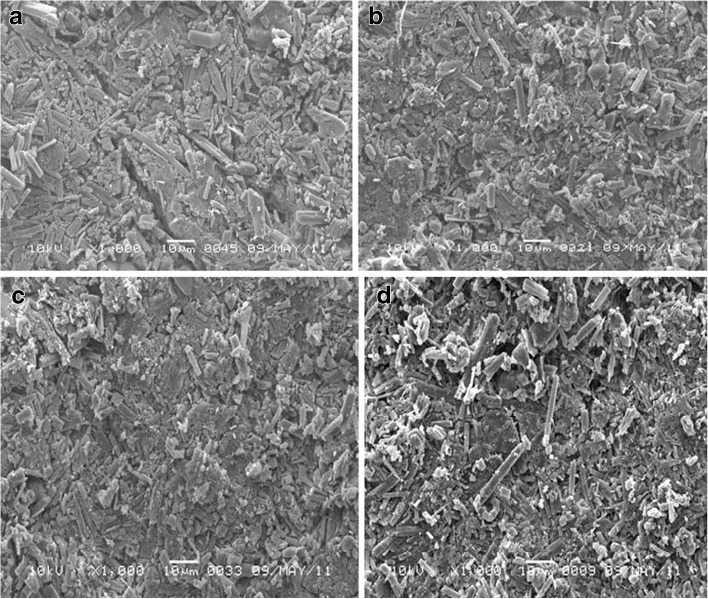
SEM for F1 tablets stored at different conditions and in different packs was displayed in Fig. 9. The micrograph showed dramatic change in the void sizes. The tablets are characterized by hydrophilic surface due to hydrophilic lubricant and glidant and hydrophilic core due to presence of high urea concentration, high MCC content, and 6% croscarmellose sodium. The formula also has relatively porous structure (34.6% porosity) due to the sublimation of urea during the stability study. In addition to, croscarmellose sodium has a filament-like structure and adsorbs the moisture by wicking effect. This moisture adsorption resulted in gelling of the croscarmellose sodium leading to severe change of disintegration time and dissolution rate to be >600 s and 35%, respectively, after 12 weeks only.
Fig. 9.
SEM micrograph of F1 tablet surface packed in PVdC blister and stored at a 40°C/75% RH, b PVdC blister and stored at 50°C/75% RH, c glass bottle and stored at 40°C/75% RH, d and glass bottle and stored at 50°C /75% RH, for 6 months
Also, F2 tablets micrograph showed dramatic increase in void numbers and sizes. The tablets are characterized by hydrophilic surface due to hydrophilic lubricant and glidant and hydrophilic core due to presence of high urea concentration and 9% Explotab. The formula also has relatively low porous structure (25% porosity). The formula was considered less hygroscopic than that of F1 due to low porosity and presence of relatively high concentration of mannitol which is considered as nonhygroscopic excipients. It was stated that the acceptable porosity for ODTs is 30%. The increase in moisture content was associated with change in the dissolution rate (87%). The change may be explained by the gelling of Explotab which has higher tendency to adsorb 20% moisture in few hours and forming gel (39). It is previously described that mannitol crystals exhibit crystal transition during wet granulation process from the common oblong shape to the needle shaped which increased compressibility of the new needle-shaped mannitol (31).
While F3 tablet micrograph represented in Fig. 10 shows cracks on tablet surfaces packed in PVdC blisters stored at 40°C/75% RH, the presence of cracks may be explained by expansion of the hydrated Plasdone XL. The tablet has hydrophobic surface due to presence of magnesium stearate and Aerosil R972. The tablet core contains high concentration of mannitol and 9% Plasdone XL. Plasdone XL has superior advantage on the other disintegrants as it is insoluble and does not form gel (40).
Fig. 10.
SEM micrograph of F3 tablet surface packed in PVdC blister and stored at a 40°C/75% RH, b PVdC blister and stored at 50°C/75% RH, c glass bottle and stored at 40°C/75% RH, and d glass bottle and stored at 50°C /75% RH, for 6 months
The micrograph for F4 tablets shows increase in void size on the tablets surfaces packed in PVdC blisters stored at 40°C/75% RH. The presence of cracks may be explained by expansion of the hydrated croscarmellose sodium. F4 tablets contain hydrophobic magnesium stearate, high content of MCC, 12% croscarmellose sodium, and Aerosil 380. The presence of 12% croscarmellose sodium at high humidity may lead to gel formation which affect disintegration time and dissolution to be >600 s and 35%, respectively, after 6 months storage.
From the results obtained, F3 was the most stable one among all the studied formulae in glass bottles and blisters under different storage conditions. F3 is characterized by high physical stability against the adsorbed moisture from atmosphere that may be due to presence of hydrophobic glidant and lubricant. Presence of high percent of mannitol enhances the physical stability. The effect of hydrophobic stearate on the performance of ODTs may be compensated by adjusting the hydrophilicity of the formula, in addition to the reasonable values of t1/2 and t90 which reach to 9.999 and 1.999 years, respectively. So, the glass is the most suitable packaging material for MN ODTs and it was clear that the promising formula for the in vivo study is F3 as it shows good balance between the performance and the stability results.
In Vivo Study and Pharmacokinetic Analysis
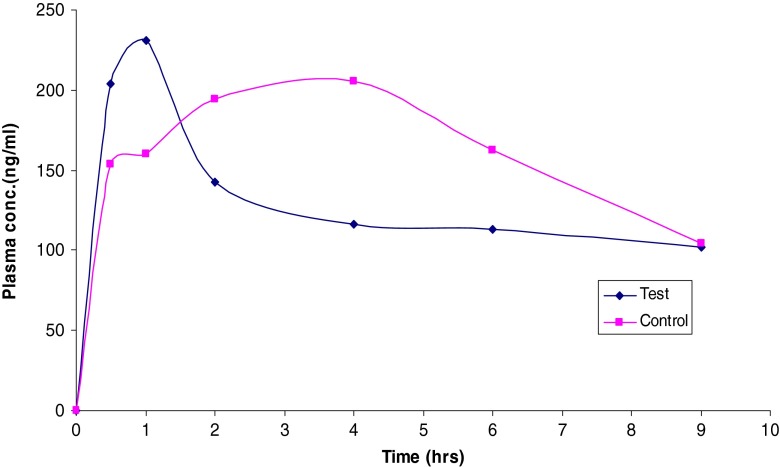
The in vivo studies were carried out on F3 as it provided the shortest disintegration time. The mean plasma concentration–time data of MN following the administration of the control and F3 ODT is presented in Table VI and shown in Fig. 11. The mean peak plasma concentration (Cmax) of MN ODT was 230 ng/ml with mean tmax of 1 h, while the control group showed a Cmax of 205 ng/ml with mean tmax of 4 h. This may be due to the foam granulation technique using HPMC/urea solution that enhances the dissolution and absorption of MN ODTs. Both HPMC and urea possess surface activity which may enhance the absorption rate. The work is in a good agreement with previous work, which enhanced the dissolution and oral absorption of griseofulvin, a poorly water-soluble drug, by utilization of hydrophilic surfactant (41). Other reports demonstrated that the Cmax of the physical blend of MN/cyclodextrin/tartaric acid was 240 ng/ml while that of the supercritical CO2-based complex was 590 ng/ml (42).
Table VI.
Mean Bioavailability and Pharmacokinetic Parameters of MN Following the Administration of a Single Dose of the Control Formula and the Selected ODT Formula
| Parameters | Control formula | Testes formula (F3) |
|---|---|---|
| Dose (mg) | 3 | 3 |
| C max (μg/ml) | 0.205 | 0.230 |
| t max (h) | 4 | 1 |
| k ab (h−1) | 0.832 | 1.971 |
| k el (h−1) | 0.148 | 0.144 |
| V d (l) | 9.280 | 7.555 |
| TRC (ml/min) | 22.846 | 18.128 |
| AUC0–24 (μg h/ml) | 1.155 | 1.155 |
| AUC24–∞ (μg h/ml) | 0.704 | 0.708 |
| AUC0–∞ (μg h/ml) | 1.859 | 1.863 |
| AUMC0–24 (μg h2/ml) | 3.656 | 4.650 |
| AUMC24–∞ (μg h2/ml) | 6.337 | 6.376 |
| AUMC0–∞ (μg h2/ml) | 9.993 | 11.026 |
| MRT (h) | 5.376 | 5.917 |
| C max/AUC0–24 (h−1) | 0.178 | 0.199 |
TRC total renal clearance, AUC area under the curve, AUMC area under the moment curve, MRT mean retention time
Fig. 11.
Means of plasma concentrations–time profiles of MN from (F3) ODT and physical blend formula
The mean AUC0–∞ was found to be 1.859 and 1.863 μg h/ml for both control and F3, respectively, which seems approximately the same. The AUMC0–end was found to be 10.0 and 11.0 μg h2/ml for the control and F3, respectively. The apparent volume of distribution was found to be 9.28 and 7.56 l for the control and F3, respectively. Similarly, the total renal clearance was found to be 22.2 and 18.1 ml/min for the control and F3, respectively.
CONCLUSION
The current study has proven the acceptability of the foam granulation technique for preparing MN ODTs. The formula that contains Plasdone XL100 as superdisintegrant, mannitol/MCC ratio at 2/1, magnesium stearate as lubricant, and Aerosil R972 as glidant and compressed to get 25 N hardness (F3) is the promising among all the studied formulae as characterized by its short disintegration time, reasonable stability, and acceptable in vivo results.
ACKNOWLEDGMENTS
The authors highly appreciated the cooperation of DEEF Pharmaceutical Industries Company for giving the research team the permission to use the foam granulation machine.
REFERENCES
- 1.Himanshu KS, Tarashankar B, Jalaram HT, Chirag AP. Recent advances in granulation technology. Int J Pharm Sci Rev Res. 2010;5(3):Article-008. [Google Scholar]
- 2.Sandler N, Lammens RF. Pneumatic dry granulation: potential to improve roller compaction technology in drug manufacture. Expert Opin Drug Deliv. 2011;8(2):225–236. doi: 10.1517/17425247.2011.548382. [DOI] [PubMed] [Google Scholar]
- 3.Powder pro (2012) http://www.powderpro.se/products/technology/. Accessed 8 Apr 2012.
- 4.Ochoa L, Igartua M, Hernández RM, Gascón AR, Pedraz JL. Preparation of sustained release hydrophilic matrices by melt granulation in a high-shear mixer. J Pharm Pharm Sci. 2005;8(2):132–140. [PubMed] [Google Scholar]
- 5.Rodriguez L, Cavallari C, Passerini N, Albertini B, González-Rodríguez M, Fini A. Preparation and characterization by morphological analysis of diclofenac/PEG 4000 granules obtained using three different techniques. Int J Pharm. 2002;242(1–2):285–289. doi: 10.1016/S0378-5173(02)00189-8. [DOI] [PubMed] [Google Scholar]
- 6.Ismat U, Jennifer W, Shih-Ying C, Gary JW, Nemichand BJ, San K. Moisture activated dry granulation—part I: a guide to excipient and equipment selection and formulation development. Pharm Technol. 2009;33(11):62–70. [Google Scholar]
- 7.Lin HL, Ho HO, Chen CC, Yeh TS, Sheu MT. Process and formulation characterizations of the thermal adhesion granulation (TAG) process for improving granular properties. Int J Pharm. 2008;357(1–2):206–212. doi: 10.1016/j.ijpharm.2008.02.002. [DOI] [PubMed] [Google Scholar]
- 8.Paul J, Shesky R, Colin K. New foam binder technology from Dow improves granulation process. Pharm Can. 2006; 19–22.
- 9.Bouckaert S, Remon JP. In vitro bioadhesion of a buccal, miconazole slow release tablets. J Pharm Pharmacol. 1993;45:504–507. doi: 10.1111/j.2042-7158.1993.tb05588.x. [DOI] [PubMed] [Google Scholar]
- 10.Minghetti P, Cilurzo F, Casiraghi A, Molla FA, Montanari L. Dermal patches for the controlled release of miconazole: influence of the drug concentration on the technological characteristics. Drug Dev Ind Pharm. 1999;25:679–684. doi: 10.1081/DDC-100102225. [DOI] [PubMed] [Google Scholar]
- 11.Mandal TK. Swelling-controlled release system for the vaginal delivery of miconazole. Eur J Pharm Biopharm. 2000;50:337–343. doi: 10.1016/S0939-6411(00)00124-7. [DOI] [PubMed] [Google Scholar]
- 12.Pedersen M, Rassing MR. Miconazole chewing gum as a drug delivery system: test of release promoting additives. Drug Dev Ind Pharm. 1991;17:411–420. doi: 10.3109/03639049109043835. [DOI] [Google Scholar]
- 13.Bouckaert S, Schautteet H, Lefebvre RA, Remon JP, van Clooster R. Comparison of salivary miconazole concentrations after administration of a bioadhesive slow-release buccal tablet and an oral gel. Eur J Clin Phamacol. 1992;43:137–140. doi: 10.1007/BF01740659. [DOI] [PubMed] [Google Scholar]
- 14.ICH . Stability testing of new drug substances and products. Geneva: International Conference on Harmonization, IFPMA; 1993. [Google Scholar]
- 15.ICH . Impurities in new drug products. Geneva: International Conference on Harmonization, IFPMA; 1996. [Google Scholar]
- 16.Hui Y, Huang NH, Ebbert L, Bina H, Chiang A, Maples C, Pritt M, Kern T, Patel N. Pharmacokinetic comparisons of tail-bleeding with cannula- or retro-orbital bleeding techniques in rats using six marketed drugs. J Pharmacol Toxicol Methods. 2007;56:256–264. doi: 10.1016/j.vascn.2007.05.006. [DOI] [PubMed] [Google Scholar]
- 17.EMEA, The European Agency for the Evaluation of Medicinal Products, Human Medicines Evaluation Unit. Committee for Proprietary Medicinal Products (CPMP). Note for guidance on quality of modified release products. A: oral dosage forms. B: transdermal dosage forms, Section I (quality). 1999. CPMP/QWP/604/96, 1–15.
- 18.USP 28, the United States Pharmacopoeia, 28th Revision. Rockville, MD: Pharmacopoeial Convention, Inc. 2005.
- 19.Burgess DJ, Crommelin DJA, Hussain AS, Chen ML. Assuring quality and performance of sustained and controlled release parenterals: EUFEPS workshop report. AAPS PharmSci. 2004;6(1):Article 11. doi: 10.1208/ps060111. [DOI] [PMC free article] [PubMed] [Google Scholar]
- 20.Harshal AP, Priscilla MD. Development and evaluation of herbal laxative granules. J Chem Pharm Res. 2011;3(3):646–650. [Google Scholar]
- 21.Aulton ME. Pharmaceutics: the science of dosage form design. 2. New York: Churchill Livingstone; 2002. pp. 154–155. [Google Scholar]
- 22.Wells J. Pharmaceutical preformulation. In: Aulton ME, editor. Pharmaceutics the science of dosage form design. 2. Edinburgh: Churchill Livingstone; 2003. pp. 133–134. [Google Scholar]
- 23.Haririan I, Newton JM. Tensile strength of circular flat and convex-faced avicel PH102 tablets. Daru. 1999;7(3):36–39. [Google Scholar]
- 24.USFDA. Dissolution methods database. 2010. accessdata.fda.gov/scripts/cder/dissolution. Accessed on 15 Jun 2010.
- 25.Okuda Y, Irisawa Y, Okimoto K, Osawa T, Yamashita S. A new formulation for orally disintegrating tablets using a suspension spray-coating method. Int J Pharm. 2009;382:80–87. doi: 10.1016/j.ijpharm.2009.08.010. [DOI] [PubMed] [Google Scholar]
- 26.USFDA. Bioequivalence guidelines. 2010. accessdata.fda.gov/scripts/cder/dissolution. Accessed 15 Jun 2010.
- 27.Kobylifiska M, Kobylifiska K, Sobik B. High-performance liquid chromatographic analysis for the determination of miconazole in human plasma using solid phase extraction. J Chromatogr B Biomed Appl. 1996;685:191–195. doi: 10.1016/0378-4347(96)00125-9. [DOI] [PubMed] [Google Scholar]
- 28.Sheskey P, Keary C, Clark D, Balwinski K. Scale up formulae of foam granulation technology-high shear. Pharm Technol. 2007;31(4):94–99. [Google Scholar]
- 29.Barillaro V, Bertholet P, Sandrine HH. Effect of acidic ternary compounds on the formation of miconazole/cyclodextrin inclusion complexes by means of supercritical carbon dioxide. J Pharm Pharm Sci. 2004;7(3):378–388. [PubMed] [Google Scholar]
- 30.Barillaro V, Dive G, Bertholet P, Evrard B, Delattre L, Frederich M, Ziemons E, Piel G. Theoretical and experimental investigations of organic acids/ cyclodextrin complexes and their consequences upon the formation of miconazole/previous termcyclodextrin/acid ternary inclusion complexes. Int J Pharm. 2007;342:152–160. doi: 10.1016/j.ijpharm.2007.05.003. [DOI] [PubMed] [Google Scholar]
- 31.Yoshinari T, Forbes RT, York P, Kawashima Y. The improved compaction properties of mannitol after a moisture-induced polymorphic transition. Int J Pharm. 2003;258:121–131. doi: 10.1016/S0378-5173(03)00157-1. [DOI] [PubMed] [Google Scholar]
- 32.Nie X. Heat and moisture migration within a porous urea particle bed. PhD thesis, University of Saskatchewan, 2010; p. 8–9.
- 33.USP, the United States Pharmacopoeia. 34th edn., Rockville, MD: Pharmacopoeial Convention, Inc. 2011.
- 34.Lerk CF, Lagas M, Fell JT, Nauta P. Effect of hydrophilization of hydrophobic drugs on release rate from capsules. J Pharm Sci. 1978;67(7):935–939. doi: 10.1002/jps.2600670716. [DOI] [PubMed] [Google Scholar]
- 35.Jafari MR, Danti AG, Ahmed I. Comparison of polyethylene glycol, polyvinylpyrrolidone and urea as excipients for solid dispersion systems of MN. Int J Pharm. 1988;48:207–215. doi: 10.1016/0378-5173(88)90265-7. [DOI] [Google Scholar]
- 36.ICH. International Conference on Harmonization of technical requirements for registration of pharmaceuticals for human use, by the ICH Steering Committee, version 2, 2005.
- 37.The European Pharmacopoeia (Ph.Eur.). 6th ed., Strasbourg, France: European Directorate for the Quality of Medicines, Council of Europe. 2010.
- 38.Faroongsarng D, Peck GE. Thermal porosity analysis of croscarmellose sodium and sodium starch glycolate by differential scanning calorimetry. AAPS Pharma Sci Tech. 2003;4:E67. doi: 10.1208/pt040467. [DOI] [PMC free article] [PubMed] [Google Scholar]
- 39.Stubberud L, Arwidsson HG, Graffner C. Water–solid interactions: a technique for studying moisture sorption/ desorption. Int J Pharm. 1995;114:55–64. doi: 10.1016/0378-5173(94)00212-N. [DOI] [Google Scholar]
- 40.Rowe RC, Shesky PJ, Quinn ME. Handbook of pharmaceutical excipients. 6. London: Pharmaceutical Press; 2009. pp. 196–198. [Google Scholar]
- 41.Wong SM, Kellaway IW, Murdan S. Enhancement of the dissolution rate and oral absorption of a poorly water soluble drug by formation of surfactant-containing microparticles. Int J Pharm. 2006;317:61–68. doi: 10.1016/j.ijpharm.2006.03.001. [DOI] [PubMed] [Google Scholar]
- 42.Barillaro V, Bertholet P, Sandrine HH. Effect of acidic ternary compounds on the formation of miconazole/cyclodextrin inclusion complexes by means of supercritical carbon dioxide. J Pharm Sci. 2004;7(3):378–388. [PubMed] [Google Scholar]


