Abstract
The focus of the present investigation was to evaluate the feasibility of using cyclamic salt of lamotrigine in order to improve its solubility and intrinsic dissolution rate (IDR). The salt was prepared by solution crystallization method and characterized chemically by fourier transform infrared spectroscopy (FTIR), proton (1H) and carbon (13C) nuclear magnetic resonance (liquid and solid, NMR) spectroscopy, physically by powder X-ray diffraction (PXRD), thermally by differential scanning calorimetry (DSC) and thermogravimetric analysis (TGA), physicochemically for solubility, IDR, solution and solid-state stability, and polymorphism by solution recrystallization and slurry conversion studies. The FTIR, NMR, PXRD, DSC, and TGA spectra and thermograms indicated the salt formation. The salt formation increased lamotrigine solubility by 19-fold and IDR by 4.9-fold in water. The solution and solid-state stability were similar to parent molecule and were resistant to polymorphic transformation. In conclusion, cyclamic salt of lamotrigine provides another potential avenue for the pharmaceutical development of lamotrigine with improved physicochemical properties especially for pediatric population. It is also possible that appropriate dosage forms can be formulated with much lower drug amount and better safety profile than existing products.
Key words: cyclamic acid, dissolution, lamotrigine, salt, solubility
INTRODUCTION
Lamotrigine (3,5-diamino-6-(2,3-dichlorophenyl)-1,2,4-triazine) (LMT) is a phenyltriazine derivative. It has been approved by the FDA to control the following conditions of epilepsy—partial seizure, primary generalized tonic–clonic seizures, generalized seizures of Lennox–Gastaut syndrome, and bipolar disorder. It is used as a monotherapy or adjunct with other antiepileptic agents. It is used as an adjunct with other antiepilepsy drugs in the pediatric population ≥2 years (1,2). It has been shown to act at voltage-sensitive sodium channels, stabilizing neural membranes and inhibiting the release of excitatory neural transmitters (1). The most common side effect is life-threatening Stevens–Johnson syndrome which is dose-dependent (3).
LMT is a Biopharmaceutics Classification System (BCS) class II drug, and the rate-limiting step in its oral absorption would be solubility and dissolution rate (4). Various formulation strategies were reported to improve its solubility and dissolution rate such as prodrug approach (5), nanosuspension (6), solid dispersion with polyethylene glycol and polyvinyl pyrollidone (7,8), complexation with cyclodextrins (8,9) and multicomponent molecular crystals such as solvates, salt, and cocrystals (10,11). Salts are usually formed between ionic drugs and the counter ions, and this approach has been used extensively to improve the solubility of BCS class II drugs. Ionized species have higher solubility than unionized species because of dipolar interaction of ions with water (12). Salt formation of LMT with saccharine, adipic acid, and malic acid has been reported (11). However, these approaches achieved limited success in improving solubility and dissolution rate of LMT.
Cyclamic acid (CYA) is a sulphonic acid derivative of cyclohexane. It is a white crystalline powder with a sweet–sour taste and about 30 times sweeter than sucrose. Its sodium and calcium salts are used as a low-calorie sweetener in food, beverage, and pharmaceutical formulations. It is stable to cooking, pasteurization, and ultra-high temperature treatment (13,14). Cyclamates’ pH stability range is 2–7 (14) and have a shelf life of 7 years (15). It is most commonly used in combination with saccharin in a ratio of 10:1 to mask the aftertaste of individual sweetener (13–15). It was banned by FDA in 1969 because of its suspected carcinogenicity. But extensive long-term animal feeding studies and epidemiological studies in humans have failed to establish evidence that cyclamate is carcinogenic or mutagenic (16,17). As a result, sodium and calcium cyclamate have now been accepted in many countries for human consumption in foods and pharmaceutical formulations. The WHO has set an estimated acceptable daily intake for sodium and calcium cyclamate, expressed as CYA, at up to 11 mg/kg body weight (18). In Europe, acceptable daily intake for sodium and calcium cyclamate, expressed as CYA, has been set at up to 0–7 mg/kg body weight (19). It is also included in the FDA Inactive Ingredients Database (oral powder, solutions, chewable tablets, and suspensions) (20), in non-parenteral medicines licensed in the UK (21), and in the Canadian List of Acceptable Natural Health Products Ingredients (22).
LMT has the capability to form both salts and cocrystals depending upon the acidities of counter ion or coformer because of its relative basic nature (pKa, 5.5–5.7) (11,23). ΔpKa (ΔpKa = pKa base − pKa acid) is widely used to predict the outcome of adduct products of acids and basic molecules. It is generally assumed that the resulting adduct would be a salt if ΔpKa > 3, whereas if ΔpKa < 0, it would be a cocrystal (24,25). Adduct could be either salt or cocrystal or complex with partial proton transfer if ΔpKa is between ΔpKa > 0 and ΔpKa < 3 (26). The pKa of CYA is 1.9 (27), and ΔpKa value would be 3.6–3.8, and thus, adduct product of LMT and CYA would be salt.
The focus of the present investigation was to prepare a novel salt of LMT with CYA, and secondly, to assess the chemical and physicochemical properties such as pH-solubility profile, dissolution rate, stability against polymorphic transformation, and solution and solid-state stability. This salt makes it feasible to develop appropriate dosage forms for adult as well as pediatric population with better bioavailability and safety profile.
MATERIALS AND METHODS
Materials
LMT and CYA were purchased from Hangzhou Starshine Pharmaceuticals Co. Ltd. (HongZhou, China) and Acros Organics USA (Morris Plains, NJ, USA), respectively. Methanol, ethanol, acetone, beeswax, potassium hydrogen phosphate, potassium chloride, and sodium hydroxide were obtained from Fisher Scientific Co. (Norcross, GA, USA). Deutrated dimethyl sulfoxide (DMSO-d6) was purchased from Sigma-Aldrich, St Louis, MO. All other chemicals and reagents were of analytical grade or better.
Methods
Salt Preparation
Equimolar quantities of LMT (20 g, 0.078 mol) and CYA (14 g, 0.078 mol) were dissolved in 200 ml of ethanol in 500 ml of a round bottom flask attached to a condenser at 70°C and refluxed for 30 min while stirring. Stirring was continued, and the solution was cooled to room temperature. The salts of LMT and CYA started to appear in the reaction vessel during the cooling process. The salts were collected by filtration, washed twice with 20 ml of ice-cold acetone, air dried for 24 h, and vacuum oven dried at 30°C for 48 h. Dried salts were crushed, passed through a sieve #80 mesh ASTM kept in a closed container until the characterization studies.
Fourier Transform Infrared Spectroscopy
Chemical identification was done using fourier transform infrared (FTIR) equipped with attenuated total reflectance accessory (Thermo Nicolet Nexus 670 FTIR, GMI Inc., Ramsey, MN, USA). Spectra were collected in transmittance mode with 50 scans and 4.0 points resolutions. OMNIC ESP software (version 5.1) was used to capture and analyze the spectra.
Differential Scanning Calorimetry and Thermogravimetric Analysis
Thermal properties were investigated by differential scanning calorimetry (DSC) and thermogravimetric analysis (TGA). DSC thermograms were collected with a SDT 2960 Simultaneous DSC/TGA system (TA Instruments Co., New Castle, DE, USA). The temperature ramping rate was 10°C/min and ramped up to 300°C. This temperature range covered the melting point of both salt components. The nitrogen gas was flowing at a pressure of 20 psi to provide inert atmosphere during the measurement and prevent oxidation reaction. TGA of the samples were collected using the same instrument at a heating rate of 10°C/min and heated up to 300°C.
Scanning Electron Microscopy
Crystal habit was visualized by scanning electron microscopy (SEM, JSM-6390 LV, JEOL, Tokyo, Japan) at a working distance of 20 mm and an accelerated voltage of 5 kV. Samples were gold coated with sputter coater (Desk V, Denton Vacuum, NJ, USA) before SEM observation under high vacuum 70 mTorr and high voltage of 30 mV.
Powder and Single Crystal X-ray Diffraction
The salt crystallinity was determined by powder X-ray diffraction (PXRD). Powder X-ray diffractograms were obtained using an X-ray diffractometer (MD-10 mini diffractometer, MTI Corporation, Richmond, CA, USA) with Cu K α1 rays (λ = 1.54056 Å), a voltage of 25 kV, and a current of 30 mA, in flat plate θ/2θ geometry, over the 2θ ranges 15–75°, and diffraction pattern was recorded for 20 min.
Nuclear Magnetic Resonance Spectroscopy
1H and 13C NMR spectra were collected in DMSO-d6 at 400 and 100 MHz, respectively, on a Varian VNMR 400 spectrometer (Varian Inc., Palo Alto, CA) using a Varian 5-mm AutoX DB probe. Residual DMSO was used as a reference and set at 2.50 ppm for 1H NMR and 39.52 ppm for 13C NMR. 13C solid-state NMR (ssNMR) experiments were performed using a Varian T3 narrow-bore double-resonance probe fitted with a 4-mm PENCIL™ module. All solid-state experiments included ramped-amplitude cross polarization (28,29) and magic angle spinning (30) at a rate of 5 kHz, and SPINAL64 decoupling (31) at a field strength of ∼72 kHz. Spectral acquisitions included total suppression of spinning sidebands (32), and samples were externally referenced with 3-methylglutaric acid (33) Pulse delays of at least 1.5 times the 1H T1 (obtained via inversion recovery) were used 400, 65, and 45 s for LMT, CYA, and their salt, respectively. All spectral acquisitions took place at ambient temperature.
pH-Solubility Studies
The solubilities of LMT and its salt with CYA were determined at pH values of 1.2, 2 (HCl buffers), 3, 4, 5, 6, 7, 8 (phosphate buffers) and water at 25°C. Excess amount of LMT and its salt were added to the vials containing the media, sonicated, and vortexed for 20 s. The vials were placed in a horizontal shaker maintained at 100 rpm and 25°C for 72 h. After separating undissolved drug by filtration through a 0.45-μm membrane filter, the solubilized drug was estimated by high-performance liquid chromatography (HPLC) system. A reported HPLC method was modified to estimate LMT from the solubility samples (11). An HP 1050 (Agilent Technologies, CA, USA) HPLC system fitted with quaternary pumps, autosampler, and UV detector set at a wavelength of 210 nm and column temperature maintained at 26°C was used. The stationary phase was a reversed-phase Luna C18 (2), 4.6 × 254-mm (5 μm packing) column and a C18, 4.6 × 12.5-mm (5 μm packing) Luna C18 (2) guard column (Phenomenex Torrance, CA, USA). The composition of the mobile phase was methanol/potassium monobasic phosphate buffer pH 3 (50 mM), 55:45, and pumped isocratically at a flow rate of 1 ml/min. The HPLC method was validated as per ICH method validation guidance (34).
Intrinsic Dissolution Rate
Intrinsic dissolution studies were performed by a static disk method (35). Nondisintegrating compact was prepared by a tablet press (Mini Press-1, Globe Pharma Inc., New Brunswick, NJ, USA) using an 8-mm die and flat-faced punches (Natoli Engineering Company Inc., Saint Charles, MO, USA). The die was filled with 200 mg of either LMT or its salts and compressed with 2,500 lb force for 30 s dwell time. The die was removed, and the lower side opening was covered with beeswax to limit the drug release to the top side of the compacts during the study. Each die containing a compact was placed in a USP apparatus 2 vessels and oriented so that the blocked side of the die was directed towards the bottom of the vessel. The distance maintained between the paddle and the surface of compact was 2.54 cm. The intrinsic dissolution rate (IDR) was determined in water at 37°C and 100 rpm paddle speed. Aliquots of 1.5 ml were withdrawn at 10, 20, 30, 45, 60, 90, and 120 min, and withdrawn samples were not replaced with the fresh media but were accounted for in the calculations. Samples were filtered by a 0.45-μm Millipore nylon filter and injected into the HPLC to determine the amount of drug dissolved in the medium.
Solution and Solid-State Stability
Solution stability of LMT and its salt was assessed in phosphate buffer at pH values of 3, 4, 5, 6, 7, and 8 (0.2 M) and hydrochloride buffer of pHs 1.2 and 2, and water. Briefly, 100-μg/ml solutions of LMT and its salt were prepared, kept at room temperature (23°C), and sampled at 8, 16, 24, 48, and 72 h. Undegraded drug in solutions was determined by HPLC method. Experiments were done in triplicate. Solid-state stability studies were also done by storing LMT and its salt powder at accelerated condition 40°C/75% RH for 6 months (time points 1, 2, 3, and 6 months) and stress conditions 50, 60°C, and 94% RH (maintained by saturated solution of potassium phosphate in desiccator) for 4 weeks (2 and 4 weeks). About 200 mg of samples was transferred to 20-ml glass vials and stored at thermal stability condition. The samples were withdrawn at defined time points and characterized by TGA, DSC, FTIR, XRD, SEM, and drug contents by HPLC.
Polymorphism Studies
The prepared salt was dissolved; recrystallized from ethanol, methanol, water, and isopropyl alcohol; filtered and air dried; and characterized by DSC, FTIR, and PXRD. Slurry conversion experiments were also conducted to rule out the polymorphic transformation of salts. The excess salt was suspended in four solvents namely, ethanol, methanol, water, and isopropyl for 4 days. The solvents were decanted after 4 days, and solids were dried using a stream of nitrogen and characterized by PXRD, DSC, and FTIR.
RESULTS AND DISCUSSION
Fourier Transform Infrared Spectroscopy
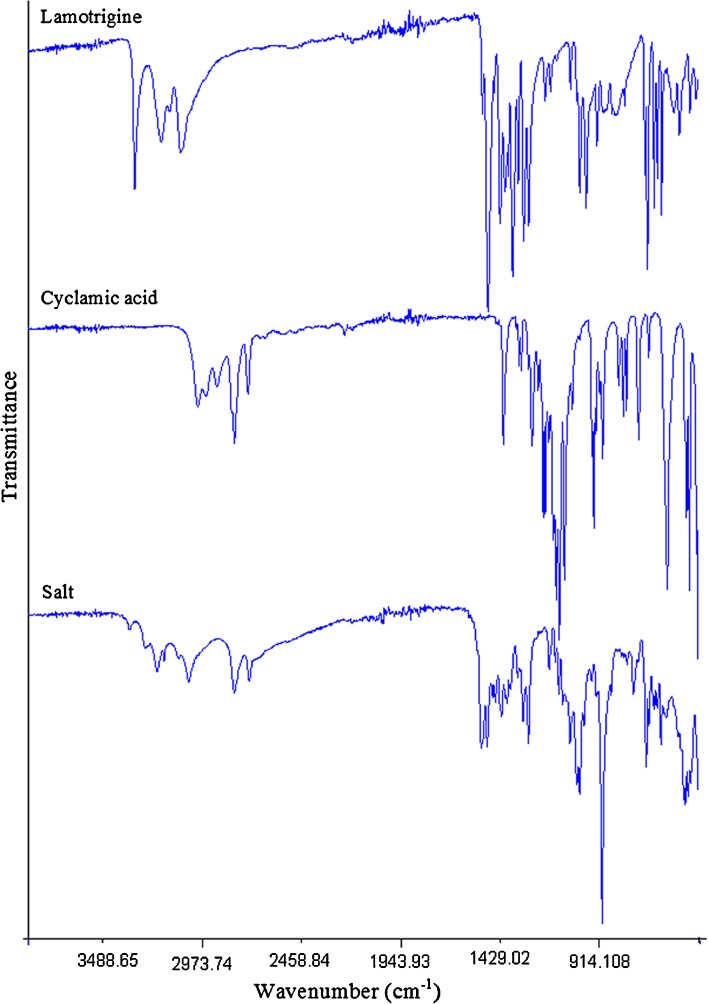
FTIR spectra are shown in Fig. 1. LMT spectrum showed principal absorption peaks at 3,448 cm−1 (N–H aromatic), 3,210 cm−1 (C–H aromatic); 1,556, 1,583, 1,616, and 1,645 cm−1 (C=N); 1,292, 1,319 cm−1 (two weak intensity sharp peaks for C–N bending vibration); 1,405–1,488 cm−1 (four peaks in pairs for aromatic C=C stretch benzene ring); 1,051 cm−1 (C–Cl); 717 cm−1 (ortho substituted benzene); 738, 755, and 790 cm−1 (meta substituted benzene). CYA showed C–H stretching vibration at 2,858 and 2,931 cm−1, CH2 bending deformation at 1,535 cm−1, medium-intensity triplet peaks for S=O stretch of sulfonic acid moiety at 1,301, 1,319, and 1,330 cm−1, S–O stretch at 835 cm−1, N–H out of plane bending vibration at 688 cm−1, C–N stretch at 1,220 cm−1, broad medium-intensity stretch at 2,800–3,200 cm−1 for O–H group. The FTIR spectrum of their salt was different from individual components which indicated formation of new chemical phase. The four peaks of C=N vibration of LMT have shifted to 1,579, 1,592, 1,643, and 1,673 cm−1. Also, the salt showed broad peak of primary amine N–H vibration, an indication of hydrogen bonding between its components. The S=O peak of sulfonic acid at 1,319 and 1,330 cm−1 disappeared, and S–O has shifted to 858 cm−1. These observations suggested the chemical interaction between the two components through hydrogen bonding and salt formation which was further proved by results of other studies.
Fig. 1.
FTIR spectra of the lamotrigine, cyclamic acid, and their salt
Differential Scanning Calorimetry and Thermogravimetric Analysis
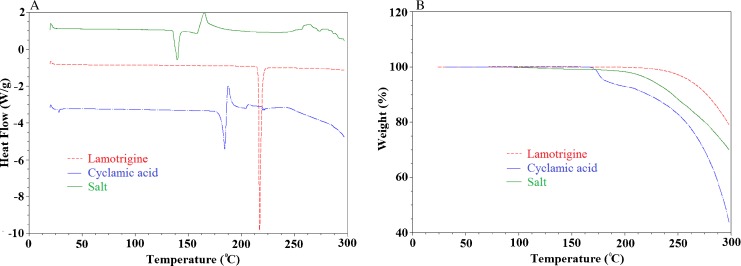
DSC thermograms of LMT, CYA, and their salt are shown in Fig. 2a. LMT showed the sharp melting endothermic peak at 216.8°C. On the other hand, CYA showed decomposition melting peak at 184.60°C. These thermograms indicated that the primary components were crystalline in nature. Their salt showed melting endotherm at 139°C and broad exothermic peak at 164.9°C which might probably be due to decomposition of CYA. These results indicated the formation of a new crystalline phase which is entirely different from starting raw materials. Similarly, TGA thermograms of LMT (Fig. 2b) lost about 20% of its mass at 300°C. It started losing weight at 212°C that was close to its melting point. Likewise, CYA lost about 7.3% from 173.43°C to 184.5°C which was its melting decomposition temperature range and loss about 56.2% mass at 300°C. The TGA thermogram of their salt lost about 31.3% mass at 300°C, and weight loss started at about 120°C. Thus, thermal analysis indicated the formation of new crystalline phase.
Fig. 2.
a DSC and b TGA thermograms of the lamotrigine, cyclamic acid, and their salt
Scanning Electron Microscopy
SEM photomicrographs are shown in Fig. 3. LMT and CYA showed the irregular broken crystals, while their salts showed prismatic-shaped crystals again pointing to the formation of new crystalline form.
Fig. 3.
SEM photomicrographs of the lamotrigine, cyclamic acid, and their salt
Powder X-ray Diffraction
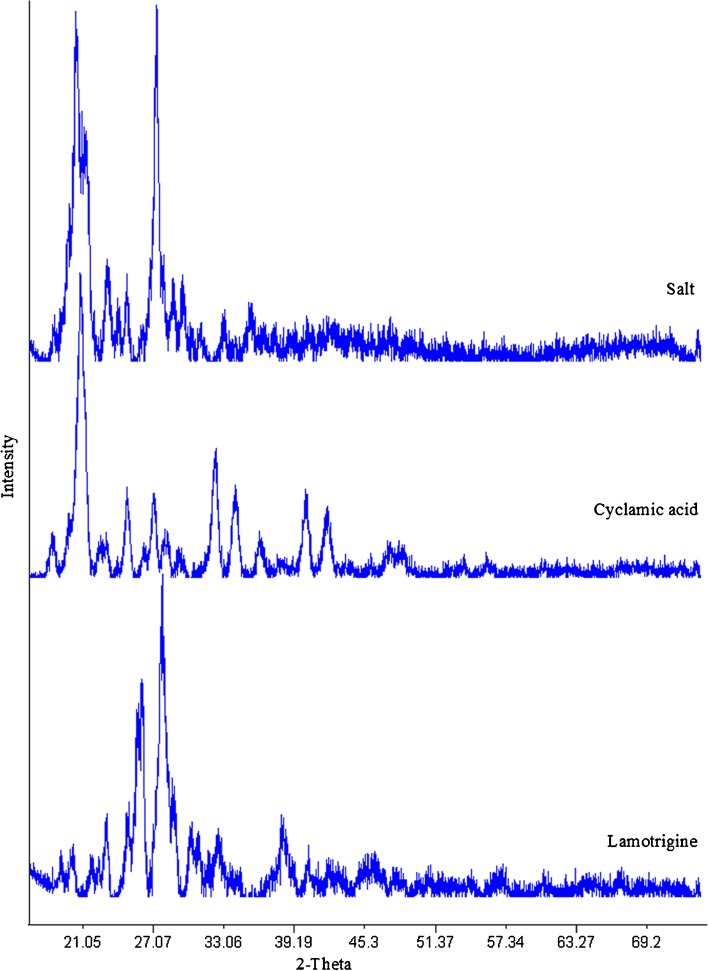
Powder X-ray diffraction pattern of the pure components and their salt are shown in Fig. 4. LMT and CYA showed peaks at 2θ values of 23.11, 25.01, 25.78, 26.09, 27.82, 28.68, 30.37, 30.98, 32.59, and 38.01° and 18.42, 20.85, 24.80, 27.13, 32.40, 34.07, 36.12, 40.13, and 42.2°, respectively, which further confirmed the crystalline nature of pure components. The salt showed the diffraction pattern at 2θ values of 20.45, 21.42, 23.02, 24.80, 27.25, and 29.46° which indicated the transformation of LMT and CYA into new crystalline phase.
Fig. 4.
PXRD diffractograms of the lamotrigine, cyclamic acid, and their salt
Nuclear Magnetic Resonance Spectroscopy
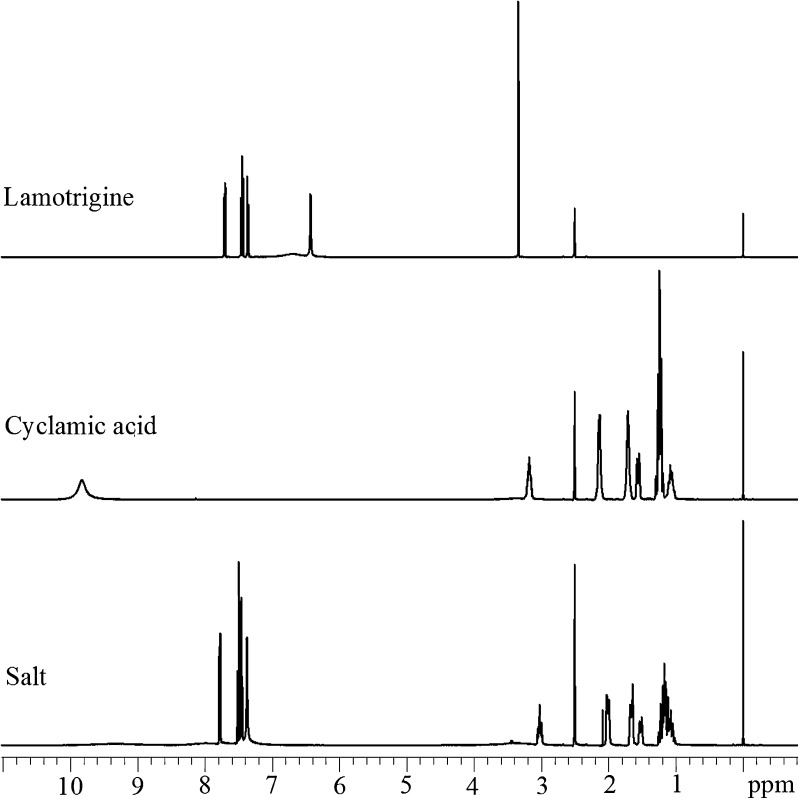
The 1H NMR spectra of LMT, CYA, and their salt are shown in Fig. 5. 1H NMR chemical shift [δ, parts per million (ppm)] data of LMT are 6.43 (2H, s), 6.69 (2H, br s), 7.34–7.36 (1H, m), 7.37–7.46 (1H, m), and 7.69–7.71 (1H, m); for CYA are 1.04–1.29 (5H, m), 1.54–1.58 (1H, m), 1.70–1.72 (2H, m), 2.12–2.14 (2H, m), 3.15–3.20 (1H, m), and 9.82 (2H, br s); and of their salt are 1.04–1.23 (5H, m), 1.50–1.54 (1H, m), 1.64–1.68 (2H, m), 1.99–2.02 (2H, m), 2.99–3.03 (1H, m), 7.37 (2H, br s), 7.44–7.51 (2H, m), 7.76–7.79 (1H, m) in DMSO-d6. NMR spectrum of the salt conforms 1:1 molar ratio based on integration between the CYA methine (CH) proton (δ 2.99–3.03 ppm, 1H, m) to the aromatic proton of LMT (δ 7.76–7.79 ppm, 1H, m). Further evidence towards formation of the salt is that all protons of the salt have different chemical shift values as compared to LMT and CYA 1H NMR spectra (36).
Fig. 5.
1H NMR spectra of lamotrigine, cyclamic acid, and their salt in DMSO-d6
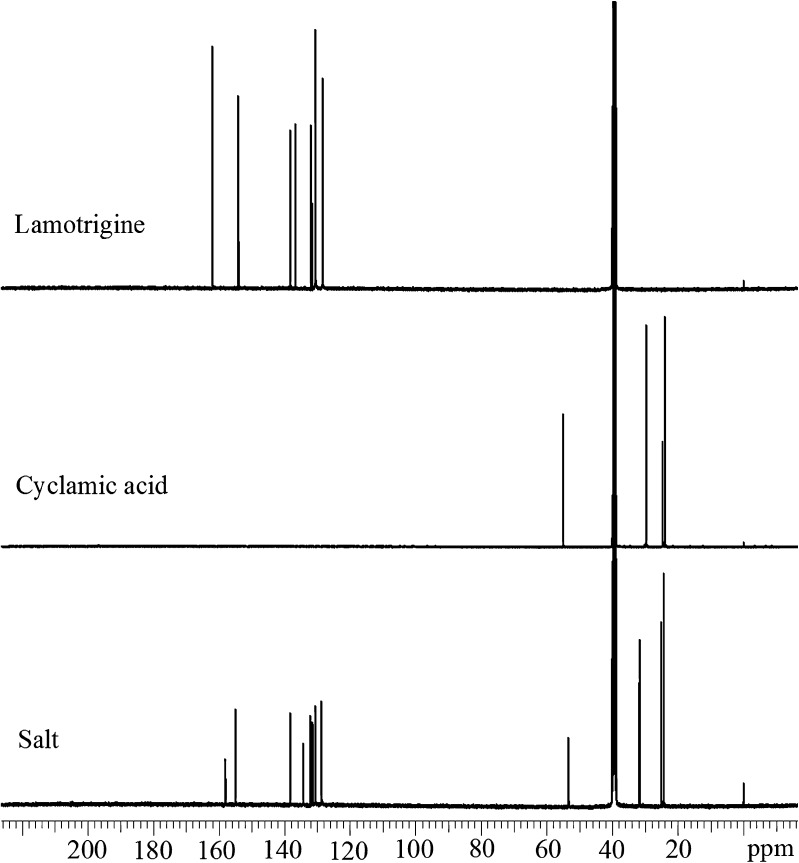
Figure 8 shows 13C NMR spectra of powdered LMT, CYA, and their salt. The 13C NMR spectra LMT, CYA, and their salt are shown in Fig. 6. Similarly, 13C NMR chemical shift (δ, ppm) data of LMT are 128.4, 130.6, 131.6, 132.0, 136.8, 138.3, 154.1, and 162.1; for CYA are 24.1, 24.7, 29.8, and 55.1; and of their salt are 24.4, 25.2, 31.8, 53.5, 128.8, 130.6, 131.4, 131.6, 132.2, 138.4, 155.0, and 158.0. The chemical shifts of all the carbon atoms in the salt are different from their respective starting materials, thus confirming salt formation.
Fig. 8.
a Solubility profile and b dissolution profile of lamotrigine and its cyclamic acid salt
Fig. 6.
13C NMR spectra of lamotrigine, cyclamic acid, and their salt in DMSO-d6
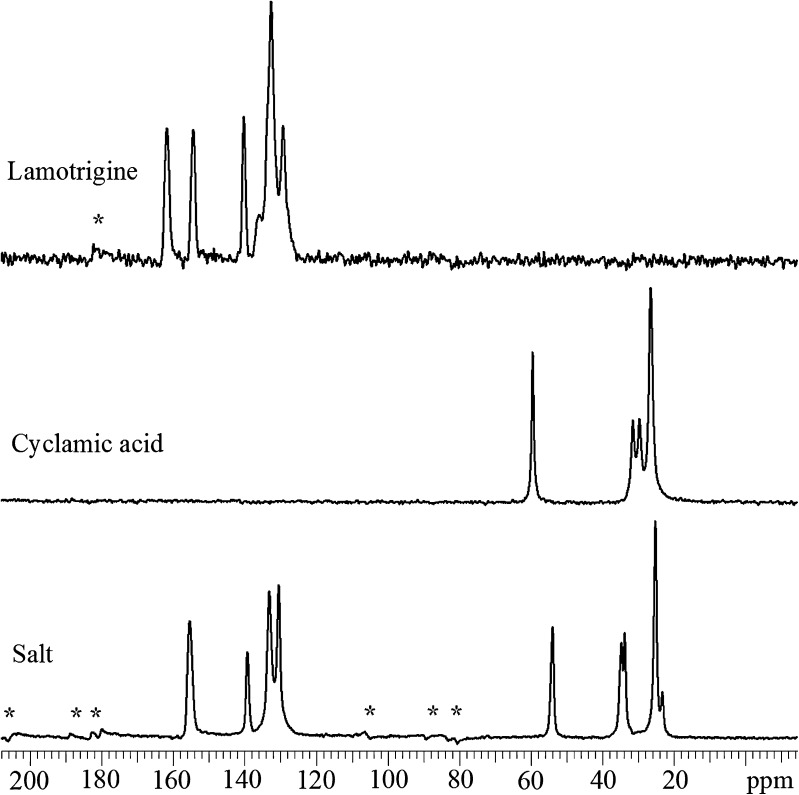
Further evidence was provided by 13C ssNMR chemical shift data of LMT, CYA, and their salt. Figure 7 shows 13C solid-state NMR spectra of powdered LMT, CYA, and their salt. Chemical shift data (δ, ppm) of LMT are 129.3, 132.6, 140.2, 154.4, and 161.7; for CYA are 26.0, 29.1, 30.9, and 58.9; and for their salt are 23.2, 25.9, 33.7, 34.6, 53.9, 130.4, 133.1, 139.2, and 55.4, respectively. The chemical shifts of all the carbon atoms in the salt differed from those of the individual components. These spectral differences were consistent with salt formation. In contrast, a spectrum that contained only chemical shifts of the LMT and CYA components would indicate the presence of a phase-separated mixture, not a single phase such as a salt. Further evidence for the presence of a single phase was provided through 1HT1 relaxation measurements. All peaks within the spectrum of the salt possessed a similar 1HT1 relaxation value (data not shown). This could indicate the presence of a single phase, as opposed to a physical mixture of multiple components, in which case each component could possess a distinct 1HT1 value (37–39).
Fig. 7.
13C solid-state NMR data of lamotrigine, cyclamic acid, and their salt, and asterisks denote spinning side band artifacts
pH Solubility
The pH solubility results are shown in Table I and Fig. 8a. LMT is a weak base with pka of 5.5–5.7 and thus has a good solubility in the acidic than the alkaline pH conditions (11,30). The salt of LMT with cyclamic acid caused a statistically significant (p < 0.05) increase in the solubility of LMT in the alkaline conditions. The solubility of salt at pH 3, 4, 5, 6, 7, and 8 was 1.67-, 2.56-, 4.07-, 6.80-, 1.75-, and 1.81-fold, respectively, that of LMT. However, salt solubility at pH 1.2 and 2 was similar to parent molecule. The solubility of the salt increased steeply after pH 2 when compared with LMT at the same pH. The increase in the solubility of LMT by CYA could be explained by the lowering of microenvironment-pH phenomenon. CYA is a strong acid, and LMT is a basic molecule with pka 1.9 (34) and 5.5–5.7 (11,21), respectively. It produced acidic microenvironment around the LMT molecule that favored its ionization and thus caused more drugs to dissolve in the media. Similar results were reported about the saccharinate salt of LMT resulted in an insignificant increase in its solubility by the same principle (11,40). Most remarkable improvement in the solubility of LMT was observed in water (0.23 ± 0.01 and 4.36 ± 0.11 mg/ml for LMT and its salt, respectively) whereby it caused 19-fold increase in its solubility. This could be explained by the same phenomenon of microenvironment pH. Surprisingly, a similar solubility trend was observed for salt in water and at pH 4 (4.36 ± 0.11 and 4.50 ± 0.12 mg/ml, respectively). This could be explained by the drop in the pH of water from 6 to 4.1 by CYA molecules of the salt.
Table I.
Solubility Results of Lamotrigine and Its Cyclamic Acid Salt
| pH | Lamotrigine (mg/ml) | Salt (mg/ml) |
|---|---|---|
| 1.2 | 0.91 ± 0.10 | 0.86 ± 0.01 |
| 2 | 5.50 ± 0.05 | 5.54 ± 0.18 |
| 3 | 3.17 ± 0.07 | 5.30 ± 0.10 |
| 4 | 1.76 ± 0.20 | 4.50 ± 0.12 |
| 5 | 0.89 ± 0.15 | 3.61 ± 0.06 |
| 6 | 0.37 ± 0.03 | 2.49 ± 0.02 |
| 7 | 0.18 ± 0.00 | 0.32 ± 0.03 |
| 8 | 0.16 ± 0.01 | 0.29 ± 0.02 |
| Water | 0.23 ± 0.01 | 4.36 ± 0.11 |
Values are shown mean ± SD (n = 3)
Intrinsic Dissolution Rate
Dissolution profile of LMT and its salt is shown in Fig. 8b. The IDR was calculated from the linear portion of dissolution profile curve and found to be 0.044 ± 0.004 and 0.21 ± 0.014 mg/min/cm2 for LMT and its CYA salt. Salt formation has increased its IDR by 4.99-fold in water. It was expected that the salt form of LMT would have higher IDR than parent drug in water. The lowering of pH-microenvironment phenomenon could explain the higher IDR of the salt.
Solution and Solid-State Stability
Stability studies were performed to compare the stability of LMT and its salt. pH-solution stability indicated that LMT and its salt have a comparable stability profile over the pH range 1.2 to 8. Both lost less than 2.2% potency after 96 h at all the studied pH and room temperature. Similarly, the solid-state stability of salt was similar to that of the parent drug. LMT and its salt lost about 1.5% potency from their initial values after 6 months and 4 weeks of accelerated and stress temperature and/or humidity storage conditions. Likewise, no change in PXRD, FTIR, DSC, and SEM was observed from their initial time point that indicated that salt is a stable form and retained its physical and chemical characteristics. TGA thermogram of salt lost about 1.8% and 2.1% w/w at temperatures 76°C and 78°C stored at 40°C/75%RH and 94% RH storage conditions after 6 months and 4 weeks, respectively. On the other hand, lamotrigine lost about 0.3% and 0.4% w/w at same storage conditions and durations. This loss in weight was probably due to absorption of water. These results indicated that salt form of LMT is relatively more hygroscopic than LMT which is probably due to its higher affinity toward water as indicated by solubility results. These studies indicated that their solid- and solution-state stability profiles are similar.
Polymorphism Studies
FTIR, DSC, and PXRD spectra (not shown) of the salt sample recovered from solution recrystallization and slurry experiments were identical with the original spectra, which indicated that no conversion to other polymorphs, hydrate, or solvates occurred. This observation suggested that the salt form existed only in one polymorph that is resistant to solvates or hydrate conversion.
CONCLUSIONS
All the characterization studies indicated the formation of CYA salt of LMT. The salt formation has greatly improved LMT solubility in the alkaline pH and water, and IDR in water. Comparable solid and solution stability of salt and LMT provided another avenue for product development. Additionally, another possible advantage expected from the salt is the suppression of bitter taste of lamotrigine by the sweet taste of cyclamic acid. Hence, this approach might result in better treatment compliance of children and geriatric patients. Further prospects would be the development of orally disintegrating or chewable tablet with ease for these patient populations.
Acknowledgments
Part of the work was supported by FDA-NIH grant# IAG Y1-HD-0052-01. The authors would like to thank the Oak Ridge Institute for Science and Education (ORISE) for supporting the postdoctoral research. The authors also extend this acknowledgment to Dr. Robert T. Berendt (FDA).
Footnotes
Disclaimer
The views and opinions expressed in this paper are only those of the authors and do not necessarily reflect the views or policies of the FDA.
REFERENCES
- 1.Ramsay RE. Advances in the pharmacotherapy of epilepsy. Epilepsia. 1993;34S:S9–S16. doi: 10.1111/j.1528-1157.1993.tb05922.x. [DOI] [PubMed] [Google Scholar]
- 2.FDA Pediatric Advisory Committee. Oct 2010. http://www.fda.gov/downloads/AdvisoryCommittees/CommitteesMeetingMaterials/PediatricAdvisoryCommittee/UCM234450.pdf, Oct 2010. Accessed 01 Nov 2011.
- 3.Yalcin B, Karaduman A. Stevens-Johnson syndrome associated with concomitant use of lamotrigine and valproic acid. J Am Acad Dermatol. 2000;43:898–899. doi: 10.1067/mjd.2000.100544. [DOI] [PubMed] [Google Scholar]
- 4.Shah HJ, Subbaiah G, Patel DM, Patel CN. In vitro–in vivo correlation of modified release dosage form of lamotrigine. Biopharm Drug Dispos. 2009;30:524–531. doi: 10.1002/bdd.688. [DOI] [PubMed] [Google Scholar]
- 5.Pugazhendhy S, Shrivastava PK, Sinha PK, Shrivastava SK. Lamotrigine-dextran conjugates—synthesis, characterization, and biological evaluation. Med Chem Res. 2011;20:595–600. doi: 10.1007/s00044-010-9355-9. [DOI] [Google Scholar]
- 6.Mishra B, Arya N, Tiwari S. Investigation of formulation variables affecting the properties of lamotrigine nanosuspension using fractional factorial design. DARU. 2010;18:1–8. [PMC free article] [PubMed] [Google Scholar]
- 7.Yadav VB, Yadav AV. Enhancement of solubility and dissolution rate of BCS class II pharmaceuticals by nonaquious granulation technique. Int J Pharm Res Dev. 2010;1:1–12. [Google Scholar]
- 8.Shinde VR, Shelake MR, Shetty SS, Patil ABC, Pore YV, Late SG. Enhanced solubility and dissolution rate of lamotrigine by inclusion complexation and solid dispersion technique. J Pharm Pharmacol. 2008;60:1121–1129. doi: 10.1211/jpp.60.9.0002. [DOI] [PubMed] [Google Scholar]
- 9.Parmar KR, Patel KA, Shah SA, Sheth NR. Inclusion complexes of lamotrigine and hydroxy propyl b-cyclodextrin: solid state characterization and dissolution studies. J Incl Phenom Macro Chem. 2009;65:263–268. doi: 10.1007/s10847-009-9577-y. [DOI] [Google Scholar]
- 10.Galcera J, Molins E. Effect of the counterion on the solubility of isostructural pharmaceutical lamotrigine salts. Cryst Growth Des. 2009;9:327–334. doi: 10.1021/cg8005025. [DOI] [Google Scholar]
- 11.Cheney ML, Shan N, Healey ER, Hanna M, Wojtas L, Zaworotko MJ, Sava V, Song S, Sanchez-Ramos JR. Effects of crystal form on solubility and pharmacokinetics: a crystal engineering case study of lamotrigine. Cryst Growth Des. 2010;10:394–405. doi: 10.1021/cg901010v. [DOI] [Google Scholar]
- 12.Serajuddin ATM. Salt formation to improve drug solubility. Adv Drug Deliv Rev. 2007;59:603–616. doi: 10.1016/j.addr.2007.05.010. [DOI] [PubMed] [Google Scholar]
- 13.Mortensen A. Sweeteners permitted in the European Union: safety aspects. Scand J Food Nutr. 2006;50:104–116. doi: 10.1080/17482970600982719. [DOI] [Google Scholar]
- 14.Shum LH. Cyclamate. In: Smith J, Shum LH, editors. Food additives databook. Chichester: Wiley; 2011. pp. 1002–1009. [Google Scholar]
- 15.Hunt F, Bopp BA, Price P. Cyclamates. In: Nabors LO, editor. Alternate sweeteners. Boca Raton: CRC Press; 2011. pp. 93–116. [Google Scholar]
- 16.D’Arcy PF. Adverse reactions to excipients in pharmaceutical formulations. In: Florence AT, Salole EG, editors. Formulation factors in adverse reactions. London: Wright; 1990. pp. 1–22. [Google Scholar]
- 17.Schmähl D, Habs M. Investigations on the carcinogenicity of the artificial sweeteners sodium cyclamate and sodium saccharin in rats in a two-generation experiment. Arzneimittelforschung. 1984;34:604–606. [PubMed] [Google Scholar]
- 18.FAO/WHO. Evaluation of certain food additives and contaminants. Twenty-sixth report of the joint FAO/WHO expert committee on food additives. World Health Organ Tech Rep Ser 1982; No. 683.
- 19.SCF. Revised opinion of the Scientific Committee on Food on cyclamic acid and its sodium and calcium salts (expressed on 9 March 2000). SCF; 2000. http://ec.europa.eu/comm/food/fs/sc/scf/out53_en.pdf. Accessed 01 Nov 2011.
- 20.FDA. Inactive ingredients list. http://www.accessdata.fda.gov/scripts/cder/iig/getiigWEB.cfm. Accessed 01 Nov 2011.
- 21.Thomas B, Bishop J. Manual of dietetic practices edition 4. Iowa: Blackwell Publishing; 2007. [Google Scholar]
- 22.Health Canada. Natural Health Products Ingredients database. http://webprod.hc-sc.gc.ca/nhpid-bdipsn/ingredsReq.do?srchRchTxt=cyclamate&srchRchRole=−1&mthd=Search&lang=eng. Accessed 11 Nov 2011.
- 23.Venkatraman N, O’Neil D, Hall AP. Life-threatening overdose with lamotrigine, citalopram, and chlorpheniramine. J Postgrad Med. 2008;54:316–317. doi: 10.4103/0022-3859.43516. [DOI] [PubMed] [Google Scholar]
- 24.Johnson SL, Rumon KA. Infrared spectra of solid 1:1 pyridine–benzoic acid complexes; the nature of the hydrogen bond as a function of the acid–base levels in the complex. J Phys Chem. 1965;69:74–86. doi: 10.1021/j100885a013. [DOI] [Google Scholar]
- 25.Black SN, Collier EA, Davey RJ, Roberts RJ. Structure, solubility, screening, and synthesis of molecular salts. J Pharm Sci. 2007;96:1053–1068. doi: 10.1002/jps.20927. [DOI] [PubMed] [Google Scholar]
- 26.Childs SL, Stahly GP, Park A. The salt-cocrystal continuum: the influence of crystal structure on ionization state. Mol Pharm. 2007;4:323–328. doi: 10.1021/mp0601345. [DOI] [PubMed] [Google Scholar]
- 27.Renwick AG, Williams RT. The fate of cyclamate in man and other species. Biochem J. 1972;129:869–879. doi: 10.1042/bj1290869. [DOI] [PMC free article] [PubMed] [Google Scholar]
- 28.Metz G, Wu XL, Smith SO. Ramped-amplitude cross polarization in magic-angle-spinning NMR. J Magn Reson Ser A. 1994;110:219–227. doi: 10.1006/jmra.1994.1208. [DOI] [Google Scholar]
- 29.Pines AMG, Gibby MJ, Waugh JS. Proton-enhanced NMR of dilute spins in solids. J Chem Phys. 1973;59:569–590. doi: 10.1063/1.1680061. [DOI] [Google Scholar]
- 30.Andrew ER, Bradbury A, Eades RG. Removal of dipolar broadening of nuclear magnetic resonance spectra of solids by specimen rotation. Nature. 1959;183:1802–1803. doi: 10.1038/1831802a0. [DOI] [Google Scholar]
- 31.Fung BM, Khitrin AK, Ermolaev K. An improved broadband decoupling sequence for liquid crystals and solids. J Magn Reson. 2000;142:97–101. doi: 10.1006/jmre.1999.1896. [DOI] [PubMed] [Google Scholar]
- 32.Dixon WT, Schaefer J, Sefcik MD, Stejskal EO, McKay RA. Total suppression of sidebands in CPMAS carbon-13 NMR. J Magn Reson. 1982;49:341–345. [Google Scholar]
- 33.Barich DH, Gorman EM, Zell MT, Munson EJ. 3-Methylglutaric acid as a 13C solid-state NMR standard. Solid State Nucl Magn Reson. 2006;30:125–129. doi: 10.1016/j.ssnmr.2006.06.001. [DOI] [PubMed] [Google Scholar]
- 34.ICH harmonized tripartite guideline. Validation of analytical procedures: text and methodology Q2(R1), November 2005;1–13.
- 35.Rahman Z, Samy R, Sayeed VA, Khan MA. Physicochemical and mechanical properties of carbamazepine cocrystals with saccharin. Pharm Dev Technol. 2011. doi:10.3109/10837450.2010.546412. [DOI] [PubMed]
- 36.Alhalaweh A, Velaga SP. Formation of cocrystals from stoichiometric solutions of incongruently saturating systems by spray drying. Cryst Growth Des. 2010;10:3302–3305. doi: 10.1021/cg100451q. [DOI] [Google Scholar]
- 37.Campbell GC, Vanderhart DL, Feng Y, Han CC. Proton NMR study of the intimacy of mixing in a hydrogen-bonded blend of polystyrene and poly(butyl methacrylate) Macromol. 1992;25:2107–2111. doi: 10.1021/ma00034a008. [DOI] [Google Scholar]
- 38.Zumbulyadis N, Antalek B, Windig W, Scaringe RP, Lanzafame AM, Blanton T, Helber M. Elucidation of polymorph mixtures using solid-state 13 CP/MAS NMR spectroscopy and direct exponential curve resolution algorithm. J Am Chem Soc. 1999;121:11554–11557. doi: 10.1021/ja9929786. [DOI] [Google Scholar]
- 39.Vogt FG, Clawson JS, Strohmeier M, Edwards AJ, Pham TN, Watson SA. Solid-state NMR analysis of organic cocrystals and complexes. Cryst Growth Des. 2009;9:921–937. doi: 10.1021/cg8007014. [DOI] [Google Scholar]
- 40.Chadha R, Saini A, Arora P, Jain DS, Dasgupta A, Row TNG. Multicomponent solids of lamotrigine with some selected coformers and their characterization by thermoanalytical, spectroscopic and X-ray diffraction methods. CrystEngComm. 2011;13:6271–6284. doi: 10.1039/c1ce05458a. [DOI] [Google Scholar]


