

Abstract
Three different approaches have been evaluated for monitoring ribbon density through real-time near-infrared spectroscopy measurements. The roll compactor was operated to produce microcrystalline cellulose (MCC) ribbons of varying densities. The first approach used the slope of the spectra which showed a variation through the ribbon that could be attributed to density. A second qualitative approach was also developed with a principal component analysis (PCA) model with spectra taken in-line during the production of ribbons in an ideal roll pressure range. The PCA (i.e., real-time) density scans show that the model was able to qualitatively capture the density responses resulting from variation in process parameters. The third approach involved multivariate partial least squares (PLS) calibration models developed at wavelength regions of 1,120–1,310 and 1,305–2,205 nm. Also, various PLS models were developed using three reference methods: caliper, pycnometer, and in-line laser. The third approach shows a quantitative difference between the model-predicted and the measured densities. Models developed at high-wavelength region showed highest accuracy compared with models at low-wavelength region. All the PLS models showed a high accuracy along the spectra collected throughout the production of the ribbons. The three methods showed applicability to process control monitoring by describing the changes in density during in-line sampling.
Key words: density distribution, near-infrared spectroscopy, process analytical technology, quality by design, roller compaction
INTRODUCTION
Dry granulation is used in many industries because of its cost-effectiveness and its ability to process drugs sensitive to heat and moisture (1). Dry granulation may be obtained through roll compaction. In roll compaction, powder is fed by gravity or by means of a screw through two counter-rotating rollers, rearranging the particles by the compaction pressure applied by the rollers, thus inducing a densification of the resulting material. The key-operating goal of the compactor is to maintain a range of pressure independent of the fluctuations in the flow of the material fed to the rolls (2). The advantages of using roller compaction also include its low demand for space, personnel, energy, and time consumption. Furthermore, lot size is not dictated by the dimensions of the manufacturing equipment. Lot size may be adjusted by running the equipment for a shorter or longer time period to fulfill customer orders while avoiding the costs associated with prolonged product storage.
One of the problems encountered when using the roller compactor is a density distribution through the compact (3). A uniform and continuous flow of material must be provided by the feeding system to minimize the variation on the formed “ribbons.” High densities are obtained at the middle of the ribbon while low densities are obtained at the edges. The feed stress also affects granules. Higher feed stress increases the density of the powder in the feeder. Because densification is the result of the feed stress, higher-entry angles require significantly higher feed pressure to maintain a constant feed stress, which cannot be obtained with the screw feeder. The over densification may lead to tablets with low hardness and high friability. Low-density ribbons may also lead to problems with flow resulting in high weight variability in the tablet. Previous studies have demonstrated the effects of the feed screw in the changes of the granulation characteristics, in which the feed screw controls the roll gap by controlling the amount of material between the rolls (4).
The roll gap is a parameter that defines the ribbon thickness and the product quality. The average density of the produced ribbons is inversely proportional to the roll gap. The relation between density and roll gap is attributed to the fact that the powder is compressed at a much higher compaction pressure when the roll gap is reduced; therefore, more significant densification takes place (5). Roller compactors may be implemented with roll gap control to minimize the density distribution along the ribbon. When this option is not used, the density distribution through the ribbon depends on other operational parameters, such as the roll pressure and feed screw speed. These parameters may be correlated, and a number of models have been developed to explain the effect of operating conditions on material properties. Johanson proposed one of the most recognized models to predict the behavior of the material undergoing continuous shear deformation between the rolls in the compaction process. In the Johanson model, the material is assumed to be isotropic, frictional, cohesive, and compressible and to obey the effective yield function. The first equation from the Johanson model describes the pressure gradient for the direction parallel to the rollers, assuming that slip occurs along the roll surface. The second equation describes the pressure gradient when slip does not take place between compacted material and the rolls (6–8). This model has served to describe an ideal operation of the roller compaction processes since the material is assumed to be isotropic, frictional, cohesive, and compressible. The resulting ribbon may frequently present a wide density variation that affects the desired product properties and is not described by the Johanson model. Recent studies demonstrate that the compression pressure in the middle of ribbon width is higher than that at the edges (9). The density variations in roller compacts have been recently investigated with ultrasonic testing and X-ray tomography (10). A recent study demonstrates the density distribution along the ribbon by analyzing off-line images of MCC ribbons obtained via near-infrared (NIR) chemical imaging (11). This technique relates the intensity of the pixels with the porosity of the ribbon via a calibration method. The off-line analysis showed that the edges of the ribbons had highest porosity which reflects low-density portions.
The interest in understanding the effect of operating parameters and material properties has also lead to research efforts for real-time monitoring of ribbon density, where near-infrared spectroscopy (NIRS) has been the principal analytical technique used (12–15). Real-time monitoring with subsequent control of roller compaction parameters is being followed to minimize the effects of density variation and control the properties of manufactured tablets. The determination of density in roll compacts has been reported taking advantage of the fact that NIR spectra are affected by the physical properties of the materials analyzed (12). A linear correlation between the relative density of roll-compacts with concentration, relative humidity, and compression pressure was demonstrated. Previous studies also showed a correlation between the slope of the NIR spectra and thickness of a roll-compact (13), which was used to predict the density of roll-compacts in real time. The density variation was monitored after uniform feeding was achieved.
Previous studies have demonstrated the feasibility of NIR spectroscopy for real-time monitoring of roller compaction processes (12–15). The objective of this study is to advance from the feasibility stage to the implementation of NIRS to monitor the physical changes that occur in ribbons due to variation in operation conditions. NIR implementation requires a thorough evaluation on the use of the information obtained from real-time NIR spectra. To this end, three different approaches are used to monitor and elucidate the physical changes that occur during roller compaction, as a result of changes in operational conditions. The first approach consists of evaluating the variation in the slope of NIR spectra after changes in the operational conditions of roll pressure. The second approach consisted of a qualitative principal component analysis (PCA) model, which is capable of detecting and correlating spectral changes observed during processing. In the third approach, the NIR spectra were also used to develop partial least squares (PLS) calibration models for envelope density. Results were confirmed with off-line envelope density results. In addition, the NIR results were compared with off-line and in-line thickness measurements obtained using a digital caliper and laser, respectively.
The production of ribbons with the specified density during a continuous process requires the development and validation of control methods that can predict “in-line” (in the process) density distribution accurately. This study seeks to further contribute to the current initiative for developing manufacturing process based on modern quality assurance principles. The effort was started with the process analytical technology initiative and continued with the evolution of Quality by Design and studies to understand the materials science related to pharmaceutical processes.
EXPERIMENTAL
Materials
The ribbons analyzed were produced with MCC Avicel PH 200 and 102 (FMC, Philadelphia, USA).
Preparation of Ribbons
The ribbons were produced using a lab-scale roller compactor (Alexanderwerks®, Remsheid, Germany) with diamond knurl and flat rollers of a 12 cm diameter and 4 cm width. For the experiments, the roll gap control was turned off. Therefore, the density obtained depended on the roll pressure and screw speed selected by the operator. The vacuum option was used to minimize the loss of powder in the experiments. A set of “real-time” ribbons were produced during 2 min for in-line measurements. These ribbons were produced varying the roll pressure from 25 to 70 bar. Three roll pressure conditions were analyzed (25, 40, and 70 bar). An average thickness of 1.3 cm was obtained. Table I shows the parameters and conditions used for the production of the ribbons.
Table I.
Operational Conditions Used to Produce Ribbons
| MCC 200 | MCC 102 | Flat surface models | In-line | |
|---|---|---|---|---|
| Feeding system | Screw | Piston | Screw | Screw |
| Roller type | Rough | Rough | Flat | Rough/flat |
| Roll pressure (bar) | 15, 20, 25, 35, 45 | 15, 25 | 25, 33, 40, 48, 55, 63, 70 | Varied |
| Inlet pressure (bar) | n/a | 1.5, 2.0, 2.5, 3.0 | n/a | n/a |
| Screw speed (rpm) | 35 | n/a | 35 | 35 |
| Roll speed (rpm) | 9 | 9 | 9 | 9 |
| Vacuum option | On | Off | Off | On |
| Roll gap control | Off | Off | Off | Off |
Determination of Envelope Density
The envelope density values were obtained via a GeoPyc 1360 pycnometer (Micromeritics, Norcross, GA). A 12.7-mm-diameter chamber was used to obtain the measurements with a conversion factor and consolidation pressure of 0.1284 and 28 N. Three replicate readings were carried out for each ribbon section. Dry Flo® was used as the medium to obtain the measurements. An amount higher than 250 mg of material was obtained for accurate measurements as specified by the GeoPyc instrument manual. For the ribbons produced offline, samples of approximately 1 cm of length and 0.8 cm of width were analyzed in triplicate. Samples of ribbons produced for in-line analysis were obtained every 30 cm length of ribbon produced during the experiment in order to compare the predictions of the models.
Thickness Measurements
A digital caliper was used to measure the thickness of the samples as a second reference method. In addition, an optoNCDT 1402 economic laser sensor (micro-epsilon, UK) at 3,333 Hz was used to obtain in-line measurements of ribbon thickness. This laser was located 8 cm after the NIR probe to obtain the highest approximation of the thickness. The samples were weighed on a high precision balance. Two volumes were obtained for the sample by varying the thickness value using the caliper and laser results. Therefore, two density measurements were obtained by dividing the mass measured by the volume calculated. These two reference methods were used only during the production of the flat surface ribbons.
Acquisition of Near-Infrared Spectra
Spectra of the ribbons were collected using a CDI non-contact diffuse reflectance spectrometer (SNIR 278, Control Development Inc. South Bend, IN). NIR spectra were obtained by placing the fiber optic probe 7.5 cm above the samples. The integration time established was 69.9 ms with a sampling average of eight spectra. Reference spectra were obtained with a CDH 50 Standard White disk, made with Albrillon, an organic microcrystalline fluorinated polymer that provides a strong reflectance.
Samples were placed over and parallel to a linear transverse’s moving stage, which is controlled by a MATLAB 7.1 code (The Math-Works, Natick, MA). Two sampling techniques were used for the acquisition of the spectra. The ribbons of rough surface were divided in four sections of approximately 0.8 cm. This width was chosen because the NIRS sampling area is approximately 0.5 cm. Figure 1 shows the sampling method used for the collection of the spectra along four sections across the ribbon width. A total of ten spectra were obtained off-line and averaged for 0.5–0.6 cm segments of the rough roller compacted ribbons. For the flat surface ribbons, only the middle section of the ribbons was analyzed to minimize the influence of stray light reflection from the moving stage’s plate in the spectra. A sample of approximately 1 cm length was cut to obtain the reference envelope density and thickness measurements. Spectra were obtained along approximately 28 cm of the ribbons produced. A total of eight spectra were obtained for each condition analyzed.
Fig. 1.
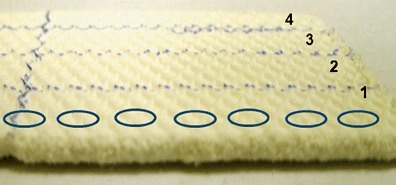
Sectioning method used for calibration and validation experiments of model MCC 200
Real-time spectra were obtained during the production of pure MCC 200 using the diamond knurl and flat rollers. Figure 2 shows the in-line setup in which the NIR probe was located at the exit of the roller compactor. Spectra were collected for two sets of ribbons. For the set of ribbons of rough surface, spectra were obtained when the roll pressure was varied at 15-bar increments of roll pressure during approximately 15 to 30 s of process. A set of spectra for flat surface ribbons was collected through 2 min of production varying the roll pressure from 25 to 70 bar.
Fig. 2.
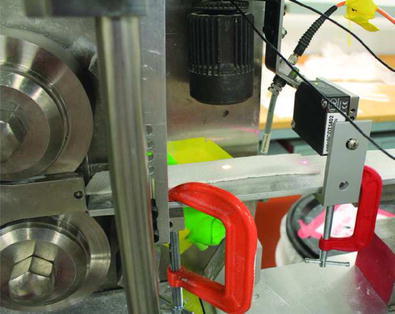
Online experiment setup
Development of PCA and PLS Calibration Models
The Pirouette 4.0 (Infometrix, Bothell, WA) software was utilized for PCA and development of multivariate calibration models with PLS regression. PCA was used with spectra acquired in-line to develop qualitative models to detect changes in the density of ribbons. A PCA model was developed with the spectra obtained for the in-line experiment in which the roll pressure was varied from 30 to 35 bar. The PCA model was developed in a wavelength region from 1,305 to 2,205 nm. This PCA model was applied to the spectra collected on in-line experiments. Also, a PCA model was developed from 1,305 to 2,205 nm with the spectra obtained off-line for the flat surface ribbons produced at 33 and 40 bar to describe the behavior of the in-line experiment of flat ribbons’ surface. The PCA models were developed with one PCA factor.
The spectra obtained were analyzed to determine the steps required to develop accurate and precise models. Figure 3 shows NIR spectra as obtained, without spectral pretreatment. A calibration model was developed with the region from 1,120 to 1,310 nm. At these shorter wavelengths, the depth of penetration from the NIR radiation is expected to be greatest, due to the low molecular absorption from the particles (16). Thus, the low wavelength region could be promising for density measurements since a higher volume of the material interacts with the NIR radiation. A second calibration model was evaluated encompassing the wider 1,305–2,205 nm region.
Fig. 3.
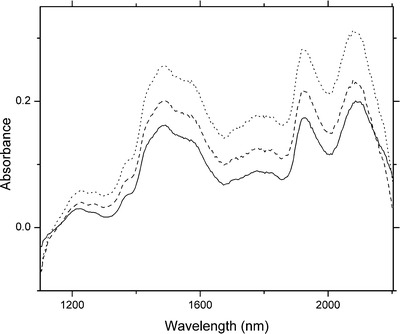
NIR spectra without spectral pretreatment (1,100–2,205 nm) obtained from ribbons of MCC 200 produced at 15 (straight), 25 (dash), and 45 bar (dot)
Two calibration models were developed using the off-line spectra obtained from the ribbons placed on the linear transverse. The development of the calibration model required the evaluation of suitable spectral pretreatments for the application. The subtract pretreatment was applied bringing all the spectra to a value of 0 at 1,121 and 1,306 nm in the models developed at 1,120–1,310 and 1,305–2,205 nm model, respectively. Following subtraction, the slopes of the spectra were obtained from the values at 2,100 nm. The subtract pretreatment corrects the baseline but does not affect the slope of the spectra (17). The PLS calibration model was developed with mean centering and provided a calibration model with two PLS factors.
RESULTS AND DISCUSSION
Spectra Variation Dependence
Off-line and real-time NIR spectra were obtained for ribbons produced with MCC. The NIR spectra obtained when the ribbon movement was controlled by the linear transverse stage were used for the development of the multivariate models. The spectra shown in Fig. 3 were obtained when the density of the ribbon was varied by applying different roll pressure conditions to the powder. These spectra showed significant variation in their baselines. The spectral baseline increased as the roll pressure was increased. These results confirm that NIR spectroscopy detects the physical changes in the ribbons when the roll pressure changes, as described by previous studies (11–15). The fact that the ribbons were composed of only one material (MCC 200) means that spectral changes are the result of physical changes and not chemical changes. Hence, the slope changes are the result of physical changes to the ribbon. To obtain the slope value, all spectra were first baseline-corrected to a value of zero at 1,121 or 1,306 nm (subtract pretreatment), and the value at 2,100 nm was used. The slope of NIR spectra was found to be proportional to the roll pressure. Figure 4 shows the average of the slope of the spectra and envelope density measured for ribbons produced from 20 to 45 bar. A linear relationship between the density and the slope of the spectra was obtained for these ribbons with a correlation coefficient of 0.9812. These results are consistent with those previously obtained by Gupta (13).
Fig. 4.
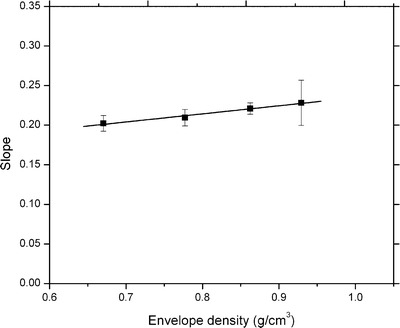
Average slopes and envelope density of rough surface ribbons of MCC 200 produced from 20 to 45 bar. Range of slope was calculated for each average envelope density
Qualitative Modeling (Principal Component Analysis)
PCA was used to evaluate spectral changes that occurred as the roller compaction operating parameters were varied. In this second approach, a PCA model was developed for the in-line experiment of rough surface ribbons considering a process in which the roll pressure was varied from 30 to 35 bar. The NIR spectra obtained when the roll pressure varied from 30 to 35 bar served as training set for the PCA model. The variation between 30 and 35 bar was considered normal process variation for the purposes of this study, and the objective of the PCA model was to use the NIR spectrum to detect changes from these desired operating conditions. Figure 5 shows predictions for in-line experiments for conditions above and below the roll pressure conditions used for the development of the model. Figure 5a shows the Mahalanobis distance (distance from the multivariate mean) for the predictions obtained with roll pressure varying from 25 to 30 bar in the in-line experiment. The moment in which the pressure was varied is represented with an arrow. The gradient observed indicates the variation of density as the roll pressure is incremented. The spectra obtained at the initial portion of the ribbon at 25 bar were not between the 95% confidence interval of the model marked by the horizontal line (Mahalanobis distance critical value) shown in Fig. 5. The gradient continues until the system reaches 30 bar, and then all spectra are predicted within the 95% confidence interval of the model since the model was developed (30 to 35 bar). Figure 5b shows the results obtained when the roll pressure was varied from 35 to 40 bar. Figure 5b shows that the initial spectra obtained were not within the 95% confidence interval of the model. These initial spectra could result from low-density ribbons obtained at system start-up since the first portion suffers from sub-feeding. The rest of the spectra obtained were described within the accepted 95% confidence interval, except for the final measurements as the roll pressure is increased to 40 bar. The changes observed in the ribbon density are gradual, since the material properties do not vary immediately after the setting changes. The model correctly predicted the change from 35 to 40 bar and shows that the effect on material properties is not immediate. This is an important observation, considering that the end goal is to control the material properties.
Fig. 5.
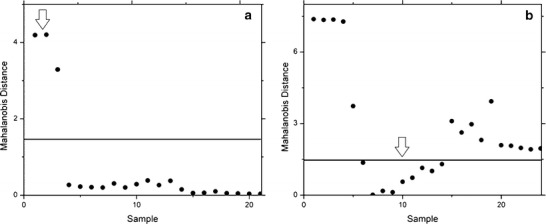
The 30 to 35 bar PCA model Mahalanobis distance predictions of spectra of MCC 200 ribbons when the roll force was varied from: a 25 to 30 bar and b 35 to 40 bar. The horizontal line marks the Mahalanobis distance critical value above which a sample may be considered different from those in the calibration set
A second PCA model was also developed for flat ribbons with off-line spectra of ribbons produced at 33 and 40 bar. The PCA model was used for real-time prediction in a longer production run where the roller compaction pressure was varied from 25 to 70 bar. Figure 6 shows the Mahalanobis distance of the ribbons of flat surface produced from 25 to 70 bar. The score plot shows the variation on the ribbon as the roll pressure was varied during the experiment. A linear gradient is described by the model which can be related to the increment of the density as the roll pressure was varied. As the roll pressure starts to increase, the in-line spectra start to appear within the 95% confidence interval of the 33 to 40 bar model. The predictions move outside of the confidence interval as the system approaches the final roll pressure of 70 bar. Therefore, the PCA model correctly predicted the changes in the ribbon.
Fig. 6.
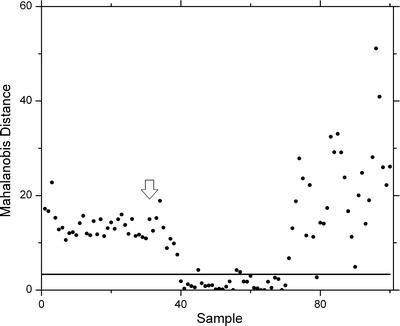
Mahalanobis distance of flat surface ribbons produced from 25 to 70 bar applying a PCA model developed off-line spectra obtained at 33 and 40 bar. The horizontal line marks the Mahalanobis distance critical value above which a sample may be considered different from those in the calibration set
Quantitative Modeling (PLS Analysis)
The third approach involved the use of NIR spectra obtained during off-line sampling of MCC 200 and MCC 102 ribbons to develop envelope density calibration models with the PLS algorithm as described in Table II. A total of eight samples per ribbon were used for the development of the calibration model MCC 200; and a total of 37 samples were included in this model. The calibration model for MCC 102 was developed obtaining 12 samples per ribbon and a total of 60 samples. Two PLS models were developed for each set with different wavelength regions (1,120–1,310 and 1,305–2,205 nm), yielding a total of four calibration models. All models showed very good accuracy in predicting the independent validation samples as evidenced by the low bias described in Table II. Higher root mean squared errors of prediction (RMSEP) were obtained for each set of predictions with the models developed at low-wavelength regions. These results were not expected since, at the lower-wavelength spectral range, the NIR radiation should interact with a higher volume of material yielding a better estimate of density (16).
Table II.
Validation Experiments Results for PLS Calibration Models of Rough Surface Ribbons
| Model | Spectral area (nm) | Calibration samples (#) | Density range (g/cm3) | RMSEC | Validation experiment | ||
|---|---|---|---|---|---|---|---|
| RMSEP | RSEP (%) | Bias (g/cm3) | |||||
| MCC 200 | 1,120–1,310 | 37 | 0.6–1.0 | 0.067 | 0.097 | 10.2 | 0.013 |
| 1,305–2,205 | 0.071 | 0.067 | 7.55 | 0.029 | |||
| MCC 102 | 1,120–1,310 | 60 | 0.6–1.1 | 0.054 | 0.116 | 14.0 | 0.044 |
| 1,305–2,205 | 0.054 | 0.062 | 7.47 | 0.029 | |||
In-line measurements were analyzed with the PLS models developed and compared with the reference density values to verify the accuracy and precision for the models. Average reference values obtained before and after the roll pressure change were 0.82 and 0.98 g/cm3, respectively. Figure 7 shows the results obtained for an in-line experiment when the roll pressure was varied from 15 to 45 bar. Figure 7a shows the results obtained with the models developed at 1,120–1,310 nm. The prediction obtained follows the same trend as the reference values but with an offset between the values. However, model MCC 102 predictions were most accurate when the roll pressure was increased. The density predictions by NIR were lower, but increasing values were observed in a manner similar to the pycnometer measurements. Figure 7b shows reduced differences between the in-line predictions with the model developed from 1,305 to 2,205 nm and off-line pycnometer measurements. The model MCC 102 developed at 1,305-2,205 nm showed a difference through the predictions of 3% to 5%; for the 1,120–1,310 nm model, the predictions were between 3% and 23% of difference. One possible explanation is that the sample area measured by the pycnometer is larger than the samples area analyzed by the NIR spectrum (15). The density variations are averaged through the larger volume analyzed by the pycnometer. The NIR method is likely providing a more realistic view of the differences in density, as discussed in previous studies (14).
Fig. 7.
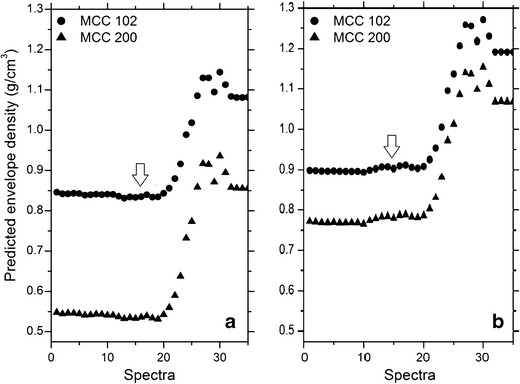
In-line predictions and reference envelope density (square) values for ribbons produced varying the roll pressure from 15 to 45 bar applying models developed of MCC 102 (circle) and MCC 200 (triangle) at a 1,120–1,310 and b 1,305–2,205 nm
PLS calibration models were also developed with different reference methods where the bulk density was estimated through caliper and laser measurements of the flat surface ribbons. A model of offline spectra obtained at the linear transverse was developed using the reference values of density obtained by weighing and measuring the thickness, length, and width of samples. The roll pressure range of this model was from 25 to 70 bar. A second model was developed using the envelope density values obtained with the GeoPyc 1360 of a certain amount of samples (three samples per condition). The density values calculated via the laser thickness measurements were also used to develop a model of in-line spectra collected during the production of the flat surface ribbons. The calibration models developed with the three reference methods are summarized in Table III.
Table III.
Validation Experiment Results for PLS Calibration Models of Flat Surface MCC 200 Ribbons
| Reference method | Model | Calibration samples (#) | Density range (g/cm3) | RMSEC | Validation experiment | ||
|---|---|---|---|---|---|---|---|
| RMSEP | RSEP% | Bias (g/cm3) | |||||
| Caliper | Offline | 43 | 0.7–1.1 | 0.051 | 0.096 | 8.97 | 0.002 |
| Geopyc | Offline | 18 | 0.6–1.0 | 0.106 | 0.117 | 10.9 | 0.022 |
| Laser | In-line | 39 | 0.8–1.1 | 0.064 | 0.168 | 15.7 | 0.076 |
A validation set of ribbons was produced with the same processing conditions as the flat surface ribbons. Table III summarizes the results obtained for this validation experiment where calibration models were developed with the three reference methods. These models showed less accuracy when compared with the results obtained for the rough surface ribbons described in Table II. The model that showed the highest accuracy is the caliper model in which the RMSEP obtained is below 10%. The model that showed the lowest accuracy was the laser model in which the RMSEP value obtained was above the 15%. This low accuracy can be attributed to the fact that the spectra that the model are predicting were obtained offline and the model was developed with in-line spectra. Therefore, a bias in the prediction of the spectra can be attributed to this difference. However, a high accuracy was obtained with the model developed with the spectra used for the development of the NIR models described before. The model developed with the Geopyc envelope density values showed good accuracy compared with the results obtained with the in-line NIR calibration model. The GeoPyc model was developed with offline spectra. The acquisition of off-line spectra has the advantage of a more accurate matching of the area analyzed by the Geopyc and the area analyzed by the NIR. In addition, the area required for accurate measurements in the Geopyc is much greater than the area sampled by the NIR. The differences in the three calibration models are also related to the difficulty in estimating the volume of solids since these are not completely flat surfaces and the roller compacted material includes a number of voids or pores. The differences in porosity affect the scattering of NIR radiation and will also have an effect on the Geopyc measurements. The porosity of the roller compacted material likely has a minimal effect on the caliper and laser measurements.
The in-line results obtained for these models showed higher accuracy compared with the models developed with the spectra of rough surface ribbons. Figure 8 shows the in-line predictions of the models developed in this set of experiments. All the models showed a high accuracy along the spectra collected through the production of ribbons of MCC 200. However, there is an offset between the prediction values of the models. The model that describes values near to the reference values obtained (GeoPyc) was the caliper model. Predictions at the initial portion of the ribbon were up to 10% of differences where reference values fluctuated between 0.87 and 0.96 g/cm3. This model showed high accuracy through the first portion of the experiment. However, this model did not follow the expected variation when the roll pressure was varied. Therefore, the model showed a low response to the variations of the density resulting from changes in the process parameters as the roll pressure was increased from 25 to 70 bar. A higher response to the increase from 25 to 70 bar was obtained with the model developed with the envelope density values obtained with the GeoPyc. Predictions of the final portion of the ribbon were up to 12% different compared with the reference envelope density measured with the GeoPyc. This can be attributed to the fact that a wide density range was obtained with this reference method. Therefore, the model can describe a higher range of density values. However, the offset between the reference values and the prediction similar to the obtained for the models developed for the rough surface ribbons can be attributed as explained before to the difference between the sample amount analyzed by the GeoPyc and the sampling area of the NIR.
Fig. 8.
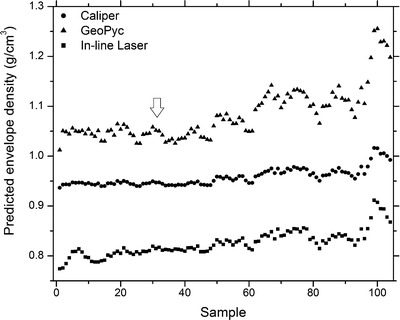
In-line predictions obtained for flat surface ribbons produced varying the roll pressure from 25 to 70 bar applying models developed using the GeoPyc (triangle), caliper (circle), and in-line laser (square) as reference method
To provide some application context, in-line density measurements can be used as part of a larger closed-loop control system (18) to provide automatic control of critical process parameters (CPPs). In addition to automatic control to correct process deviations automatically and maintain CPPs, it is also possible to use in-line density and composition measurements to detect and diagnose process faults, or exceptional events. Prior work has been done in exceptional events management by Hamdan et al. and Hamdan (19,20), mostly focusing on equipment parameters such as rpm and pressure settings. The current work makes it possible to read density and composition values in-line, opening up a new set of process variables that can be used to diagnose and remedy process faults that cannot be handled by proportional–integral–derivative control loops.
CONCLUSION
The methods presented in this study showed high potential for monitoring the density and density distribution in roll-compacts. The slope of the NIR spectra vary when operational parameters such as the roll pressure are changed which influences the variation density. The slope of the spectra increases with higher roll pressures, and this roll pressure results in an increase in the density of the ribbons. The correlation between NIR spectral slope and roll pressure was not followed at 15 bar and could be a limitation for “real-time” monitoring. The second method, PCA, was found to be a suitable qualitative approach for monitoring changes on ribbons due to changes on operational parameters. PCA and slope methods are based on spectral measurements, avoiding the sampling error associated with relating the spectra and density measurements. The disadvantage of PCA and slope methods is that the density values are not included in the slope and PCA approaches.
A quantitative monitoring approach was developed with PLS algorithm using both high- and low-wavelength regions. The results showed that the models followed the trend of increasing density but with an offset from the reference density values. The results showed the difficulty in matching the sample volume analyzed by the NIR method and the reference envelope density measurements.
In the current setup, the PCA model appears to be the most suitable for real-time monitoring changes on the density distribution. The application of a quantitative NIR calibration model will require additional efforts in matching the material analyzed in-line with the material analyzed by the reference method.
Acknowledgments
The authors acknowledge the support of National Science Foundation (ERC research grant EEC-054085) for conducting this research work. The SURF program at Purdue University for the opportunity of work on the summer. Ms. Yleana Colon of the University of Puerto Rico at Mayaguez is thanked for help on the use of the Pirouette 4.0 software.
References
- 1.Yusof YA, Smith AC, Briscoe BJ. Roll compaction of maize powder. Chem Eng Sci. 2005;60(14):3919–3931. doi: 10.1016/j.ces.2005.02.025. [DOI] [Google Scholar]
- 2.Miller R. Roller compaction technology. In: Parikh DM, editor. Handbook of pharmaceutical granulation technology. New York: Marcel Dekker, Inc; 1997. pp. 99–148. [Google Scholar]
- 3.Cunningham JC, Winstead D, Zavaliangos A. Understanding variation in roller compaction through finite element-based process modeling. Comput Chem Eng. 2010;34(7):1058–1071. doi: 10.1016/j.compchemeng.2010.04.008. [DOI] [Google Scholar]
- 4.Falzone AM, Peck GE, Mccabe GP. Effects of changes in roller compactor parameters on granulations produced by compaction. Drug Dev Ind Pharm. 1992;18(4):469–489. doi: 10.3109/03639049209043864. [DOI] [Google Scholar]
- 5.Lecompte T, Doremus P, Thomas G, Perier-Camby L, Le Thiesse J-C, Masteau J-C, et al. Dry granulation of organic powders—dependence of pressure 2D-distribution on different process parameters. Chem Eng Sci. 2005;60(14):3933–3940. doi: 10.1016/j.ces.2005.02.026. [DOI] [Google Scholar]
- 6.Johanson JR. A rolling theory for granular solids. J Appl Mech. 1965;32(4):842–848. doi: 10.1115/1.3627325. [DOI] [Google Scholar]
- 7.Bindhumadhavan G, Seville JPK, Adams MJ, Greenwood RW, Fitzpatrick S. Roll compaction of a pharmaceutical excipient: experimental validation of rolling theory for granular solids. Chem Eng Sci. 2005;60(14):3891–3897. doi: 10.1016/j.ces.2005.02.022. [DOI] [Google Scholar]
- 8.Peter K. Roll compaction/dry granulation: pharmaceutical applications. Eur J Pharm Biopharm. 2004;58(2):317–326. doi: 10.1016/j.ejpb.2004.04.014. [DOI] [PubMed] [Google Scholar]
- 9.Miguélez-Morán AM, Wu C-Y, Dong H, Seville JPK. Characterisation of density distributions in roller-compacted ribbons using micro-indentation and X-ray micro-computed tomography. Eur J Pharm Biopharm. 2009;72(1):173–182. doi: 10.1016/j.ejpb.2008.12.005. [DOI] [PubMed] [Google Scholar]
- 10.Akseli I, Lyer S, Lee HP, Cuitiño AM. A quantitative correlation of the effect of density distributions in roller-compacted ribbons on the mechanical properties of tablets using ultrasonics and X-ray tomography. AAPS PharmSciTech. 2011;12(3):834–853. doi: 10.1208/s12249-011-9640-z. [DOI] [PMC free article] [PubMed] [Google Scholar]
- 11.Lim H, Dave VS, Kidder L, Neil Lewis E, Fahmy R, Hoag SW. Assessment of the critical factors affecting the porosity of roller compacted ribbons and the feasibility of using NIR chemical imaging to evaluate the porosity distribution. Int J Pharm. 2011;410(1–2):1–8. doi: 10.1016/j.ijpharm.2011.02.028. [DOI] [PubMed] [Google Scholar]
- 12.Gupta A, Peck GE, Miller RW, Morris KR. Real-time near-infrared monitoring of content uniformity, moisture content, compact density, tensile strength, and young’s modulus of roller compacted powder blends. J Pharm Sci. 2005;94(7):1589–1597. doi: 10.1002/jps.20375. [DOI] [PubMed] [Google Scholar]
- 13.Gupta A, Peck GE, Miller RW, Morris KR. Nondestructive measurements of the compact strength and the particle-size distribution after milling of roller compacted powders by near-infrared spectroscopy. J Pharm Sci. 2004;93(4):1047–1053. doi: 10.1002/jps.20003. [DOI] [PubMed] [Google Scholar]
- 14.Soh JLP, Boersen N, Carvajal MT, Morris KR, Peck GE, Pinal R. Importance of raw material attributes for modeling ribbon and granule properties in roller compaction: multivariate analysis on roll gap and NIR spectral slope as process critical control parameters. J Pharm Innov. 2007;2(3):106–124. doi: 10.1007/s12247-007-9013-z. [DOI] [Google Scholar]
- 15.Feng T, Wang F, Pinal R, Wassgren C, Carvajal MT. Investigation of the variability of NIR in-line monitoring of roller compaction process by using fast Fourier transform (FFT) analysis. AAPS PharmSciTech. 2008;9(2):419–424. doi: 10.1208/s12249-008-9054-8. [DOI] [PMC free article] [PubMed] [Google Scholar]
- 16.Dahm J, Dahm K, Pedroa A, Ferreira M. Speaking theoretically… understanding confusing phenomena in remission spectra. NIR News. 2010;21(3):14–18. doi: 10.1255/nirn.1176. [DOI] [Google Scholar]
- 17.Barajas MJ, Rodriguez A, Vargas W, Conde C, Ropero J, Figueroa J, et al. A near infrared spectroscopic method for real time monitoring of pharmaceutical powders during voiding. Appl Spectrosc. 2007;61(5):490–496. doi: 10.1366/000370207780807713. [DOI] [PubMed] [Google Scholar]
- 18.Giridhar A, Hamdan IM, Joglekar G, Venkatasubramanian V, Reklaiti GV. Real-time process management in particulate and pharmaceutical systems. European Symposium for Computer Aided Process Engineering (ESCAPE) 21; May 29-June 1; Greece 2011.
- 19.Hamdan IM, Reklaitis GV, Venkatasubramanian V. Exceptional events management applied to roller compaction of pharmaceutical powders. J Pharm Innov. 2010;5(4):147–160. doi: 10.1007/s12247-010-9087-x. [DOI] [Google Scholar]
- 20.Hamdan IM. Exceptional events management applied to continuous pharmaceutical manufacturing. Purdue University; West Lafayette, IN, 2010.