

Abstract
Ice-core records show that climate changes in the past have been large, rapid, and synchronous over broad areas extending into low latitudes, with less variability over historical times. These ice-core records come from high mountain glaciers and the polar regions, including small ice caps and the large ice sheets of Greenland and Antarctica.
As the world slid into and out of the last ice age, the general cooling and warming trends were punctuated by abrupt changes. Climate shifts up to half as large as the entire difference between ice age and modern conditions occurred over hemispheric or broader regions in mere years to decades. Such abrupt changes have been absent during the few key millennia when agriculture and industry have arisen. The speed, size, and extent of these abrupt changes required a reappraisal of climate stability. Records of these changes are especially clear in high-resolution ice cores. Ice cores can preserve histories of local climate (snowfall, temperature), regional (wind-blown dust, sea salt, etc.), and broader (trace gases in the air) conditions, on a common time scale, demonstrating synchrony of climate changes over broad regions.
Ice-Core Interpretation
Dating and Accumulation.
On some glaciers and ice sheets, sufficient snow falls each year to form recognizable annual layers, marked by seasonal variations in physical, chemical, electrical, and isotopic properties. These can be counted to determine ages (e.g., refs. 1 and 2). Accuracy can be assessed by comparison to the chemically identified fallout of historically dated volcanoes and in other ways (3); errors can be less than 1% of estimated ages. Ice flow may disrupt layers quite close to the bed (4, 5), and ice flow progressively thins layers with increasing burial so that diffusion or sampling limitations eventually obscure annual layers.
Where annual layers are not observed because of depositional or postdepositional effects, by dating is conducted by correlation to other well-dated records, radiometric techniques in favorable circumstances, and by ice-flow modeling if needed. Most ice lacks sufficient appropriate materials to allow precise radiometric dating, but mountain glaciers sometimes contain enough material for radiocarbon dating (2), and other techniques are possible.
An especially powerful technique for correlation is to use the composition of atmospheric gases trapped in bubbles in the ice (6). Because most gases reside in the atmosphere long enough to be well mixed globally, ice cores around the world record the same atmospheric composition in bubbles trapped at the same time. Several species show sufficiently variable histories to allow accurate correlations at many times in the past. A complication is that air diffuses through spaces in snow and firn (old snow) in the upper tens of meters, until the weight of additional snow accumulation squeezes the firn to ice and traps bubbles. The trapped gas is thus a little younger than the ice in which it occurs; uncertainty in this gas age/ice age difference complicates some interpretations but still allows rather accurate dating in most cases (6, 7). In some circumstances, the gas age/ice age difference can be determined precisely with gas-isotope anomalies that record rapid temperature change, as detailed below (8).
The amount of ice between two time lines in a core, corrected for the layer thinning from ice flow, is the snow accumulation (9). The flow corrections range from trivial and highly accurate to difficult and uncertain, depending on the site and its history. Buried snow drifts introduce noise in the records, and sublimation may be important in especially low-accumulation zones, but accumulation typically provides a useful history of atmospheric delivery of snowfall to a site (9).
Paleothermometry.
Ice cores are local paleothermometers, telling past temperature where they are (or where the snow fell, if glacier flow has caused ice in a core to have come from a significant distance). The classic paleothermometer is the stable-isotopic composition of water in the ice core (10). Natural waters typically contain a fraction of a percent of isotopically heavy molecules (in which the hydrogen or oxygen contains one or two “extra” neutrons). The vapor pressure of this heavy water is less than for “normal” light water. As an air mass is cooled and precipitates, it preferentially loses heavy water and must increasingly precipitate light water. At very low temperatures, heavy water has been greatly depleted and precipitation is isotopically light. Empirically and theoretically, isotopic composition of precipitation and site temperature are strongly correlated in time and space (10, 11); colder places and colder times have isotopically lighter precipitation.
Atmospheric and glaciologic factors other than temperature can affect the isotopic paleothermometer, but several other paleothermometers allow calibration and validation. The physical temperature of the ice is important. Just as it takes a while to warm the center of cold food placed in a hot oven, deeper regions of the large ice sheets have not completed warming from the low temperatures of the previous global ice age, revealing how cold the ice age was. Joint interpretation of the ice-isotopic and ice-temperature paleothermometers gives greater confidence in the results (12, 13).
Additional paleothermometers are provided at times of rapid climate change. An abrupt air-temperature change causes a temperature difference between the snow surface and the bubble-trapping depth, and this temperature difference then relaxes over a century or so as the deeper layers adjust to the new surface temperature. Temperature gradients cause gas-isotope fractionation by the process of thermal diffusion, with heavier isotopes migrating toward colder regions. Diffusion of gases through pore spaces in firn is faster than diffusion of heat, so the isotope signal reaches the bubble-trapping depth before the heat does, and the isotope anomaly is recorded as the air is trapped in the bubbles (8). The degree of enrichment reveals how big the temperature difference was, and thus the magnitude of any abrupt climate change. In addition, the number of annual layers between the record in the ice and in the bubbles of an abrupt climate change is a known function of temperature and snow accumulation; using snow-accumulation data, one can learn the absolute temperature just before the abrupt climate change (8).
These paleothermometers agree closely on the size, speed, and timing of surface-temperature changes in central Greenland. Results from other regions rest on fewer paleothermometers and are somewhat less secure, especially in meteorologically complex areas (10, 14).
Aerosols.
Anything in the atmosphere eventually can end up in an ice core. Some materials are reversibly deposited (15), but most remain in the ice unchanged. The details of the air-snow transfer process are very complex but are being elucidated (16). Careful statistical and physical analyses are needed to make sense of small, short-lived changes, but large changes in concentrations of most materials in ice reflect changes in their atmospheric loading, with high confidence (16, 17).
Isotopic composition of dust allows “fingerprinting” of source regions (18). Major ions provide information on sea salt, continental dust, and biogenic contributions; pollen tracks productivity on land nearby; methane sulfonate responds to oceanic productivity; and other insights are possible. Cosmogenic and extraterrestrial indicators also are of interest for some studies.
Gases.
Trapped gases in ice-core bubbles are highly reliable records of atmospheric composition, as shown by intercomparisons among cores from different ice sheets and intercomparison with instrumental records and the air in firn above the bubble-trapping depth (19, 20). The slight differences between bubble and air composition caused by gravitational and thermal effects are well understood and recognizable (8). Chemical reactions in impure ice can produce anomalous compositions for some gases (21). However, the ice chemistry warns of trouble, and the close association of the gas and ice-chemistry anomalies, rather than being offset by the age difference between gas records and ice records of a climate change, is a clear indicator (5, 21).
Methane is of particular interest in studying abrupt changes. It was primarily “swamp gas” in preindustrial times and thus gives an indication of global wetland area (22). Methane destruction occurs globally, but sources may be localized. The residence time in the atmosphere is short enough that when methane sources are predominantly in the Northern Hemisphere, Greenland ice shows significantly higher methane concentrations than similar-age samples from the Antarctic; hence, changes in the concentration difference between Greenland and Antarctica record changes in the latitudinal distribution of methane sources (5, 22–24).
Ice-Core Results
Changes in Greenland.
The ice-core records from the Greenland Ice Core Project and Greenland Ice Sheet Project 2 (GISP2) deep cores (Fig. 1) in central Greenland often are used as reference standards for abrupt climate changes. These records provide annual resolution for some indicators through 110,000 years (older ice has been disturbed by ice flow; refs. 4 and 5) and provide an exceptionally clear picture of events in Greenland (temperature and accumulation), regionally (wind-blown sea salt and continental dust), and more broadly (trapped-gas records, especially of methane).
Figure 1.
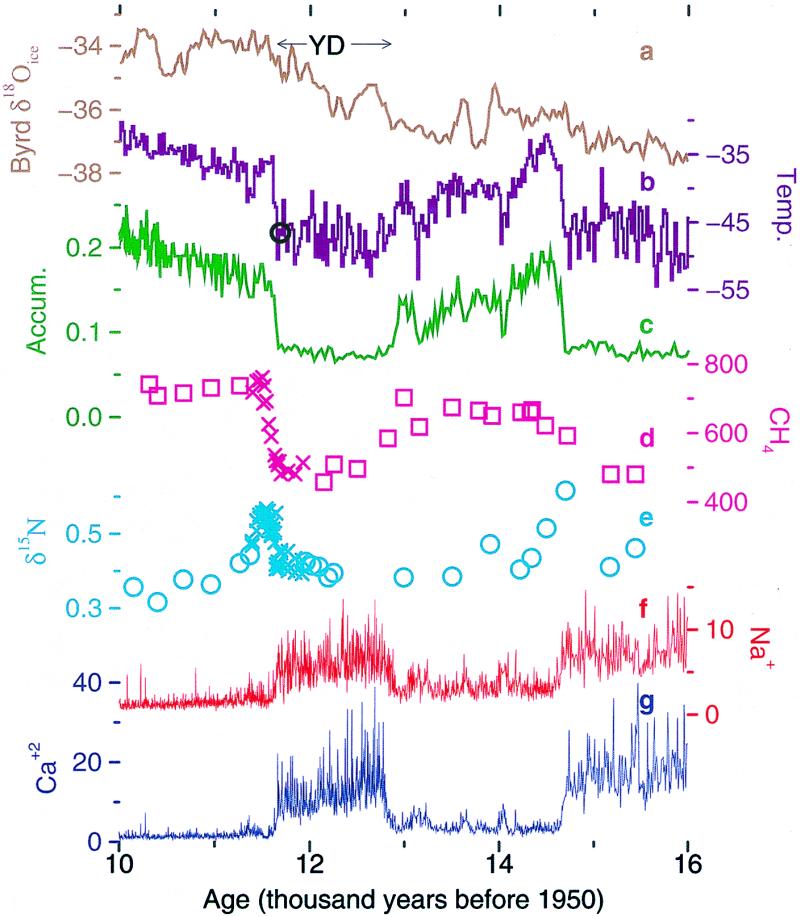
High-resolution data from the GISP2 ice core, Greenland, and the Byrd ice core, Antarctica, covering the Younger Dryas interval (YD) and adjacent times, modified slightly from ref. 37. (a) Byrd ice-isotopic data (6, 38, 39). (b–e) GISP2 data mostly from ref. 8, with the accumulation and temperature originally from ref. 40. (b) Temperature converted from ice-isotopic ratios (41) using the glacial-interglacial calibration of ref. 12, shown in °C. (c) Accumulation in m ice/year. The estimate of temperature in the Younger Dryas from (8) is plotted as a circle; uncertainties of about ± 3°C are not much larger than the symbol. (d) Methane data (parts per billion by volume) from ref. 23 (□) and ref. 8 (x). (e) δ15N data in per mil from ref. 8, with ○ from their figure 2 and x from their figure 4. (f and g) GISP2 sodium (f) and calcium (g) data from ref. 17, normalized to their mean concentration in the millennium before the Little Ice Age following ref. 36 by using the accumulation-rate estimates of ref. 9. Most of the ice-core data, and many related data sets, are available on The Greenland Summit Ice Cores CD-ROM, 1997, National Snow and Ice Data Center, University of Colorado at Boulder, and the World Data Center-A for Paleoclimatology, National Geophysical Data Center, Boulder, CO, www.ngdc.noaa.gov/paleo/icecore/greenland/summit/index.html.
The Greenland records show that climate changes have been very large, rapid, and widespread. Coolings were achieved in a series of steep ramps or steps and warmings in single steps. The more dramatic of the warmings have involved ≈8°C warming (8, 25) and ≈2× increases in snow accumulation (9), several-fold or larger drops in wind-blown materials (17), and ≈50% increase in methane, indicating large changes in global wetland area (5, 24).
For the best-characterized warming, the end of the Younger Dryas cold interval ≈11,500 years ago, the transition in many ice-core variables was achieved in three steps, each spanning ≈5 years and in total covering ≈40 years (26). However, most of the change occurred in the middle of these steps. The warming as recorded in gas isotopes occurred in decades or less (8). The most direct interpretation of the accumulation-rate record is that snowfall doubled over 3 years and nearly doubled in 1 year (9). Several records show enhanced variability near this and other transitions, including “flickering” behavior in which climate variables bounced between their “cold” level and their “warm” level before settling in one of them (27).
The methane increase at the end of the Younger Dryas began 0–30 years (one sample) after the warming in Greenland, suggesting atmospheric transmission of the signal from the north Atlantic region to methane source regions (8). The relative changes in methane concentrations in Greenland and Antarctica indicate that the increase at the end of the Younger Dryas involved both tropical and high-latitude sources (24, 25), and that the previous large increase about 14,700 years ago was dominated by the tropics (25).
Other Greenland data also show that the climate changes were geographically extensive. The isotopic composition of dust in Greenland ice indicates an Asian source (19), and the sea salt is oceanic. The large changes observed in dust and sea salt indicate reorganizations of weather patterns well beyond Greenland. The changes in snow accumulation were larger than can be explained by the effect of temperature changes on the saturation vapor pressure (28), indicating changes in storm tracks. Available data indicate that not all transitions were identical, and further analyses certainly are desirable, but most abrupt changes seem to have exhibited broadly similar patterns.
Geographic Coverage.
The ice-core record of abrupt climate changes is clearest in Greenland. No other record is available that spans the same time interval with equally high time resolution, complicating interpretations. It appears, however, that ice cores from the Canadian arctic islands, high mountains in South America, and Antarctica contain indications of the abrupt changes. Dating is secure for some of the Antarctic cores.
The Canadian arctic cores show a sharp cold reversal during the deglaciation that is probably the Younger Dryas event (29). Ice cores from the high peaks of Huascaran and Sajama in the Andes also show a deglacial reversal in the ice isotopes that may be correlative with the Younger Dryas (2, 30). However, for various reasons, the exact timing and abruptness of the changes are difficult to ascertain in these records, and records of older abrupt changes are even less secure.
In Antarctica the Byrd core from West Antarctica, and probably the Vostok and some other cores from East Antarctica, show events that are correlative to the larger millennial events of Greenland, including the Younger Dryas (6, 31). Byrd and Vostok also contain indications of events that may be correlative to nearly all of the Greenland events (31). However, the ice isotopes indicate an antiphase behavior, with Byrd warm during the major events when Greenland was cold; dating control is not good enough to determine the phase of the smaller events. The general impression of the Antarctic events is that they are smaller and less abrupt than those in Greenland, although fewer paleothermometers and other indicators have been brought to bear in Antarctica, reducing confidence somewhat.
To further complicate the issue, the Taylor Dome core from a near-coastal site in East Antarctica appears to be in-phase with Greenland and out-of-phase with Byrd during the deglacial interval centered on the Younger Dryas (32). As reviewed in ref. 33, non-ice records from broadly distributed sites in the Northern Hemisphere indicate large, abrupt changes (near-)synchronous with those in Greenland, with generally cold, dry, and windy conditions occurring together although with some sites wet perhaps because of storm-track shifts (cf. ref. 28). Some Southern Hemisphere sites also exhibit the Greenland pattern during the deglaciation, although high-resolution (annually resolved) southern records are still lacking. However, southern sites near and downwind of the south Atlantic show an anti-Greenland pattern with millennial warming when Greenland cooled, superimposed on the slower orbital variations, which are broadly synchronous in both hemispheres.
Insights
The implications of these events are covered in other papers in this issue of PNAS and are reviewed by ref. 33, among others. Briefly, the circulation of warm ocean waters supplies wintertime warmth around the north Atlantic, and some of that warmth is transported by the Atlantic across the equator from the Southern Hemisphere. This circulation can be slowed or stopped by fresh water supplied to the north Atlantic. A north Atlantic cooling triggers other processes that propagate a cool, dry windy signal through the atmosphere into the trade-wind belt. Very strong feedback processes and hysteresis behavior (34) have caused the changes to be abrupt. The larger of the northern changes especially involved loss of the cross-equatorial flow, leaving heat in the south Atlantic (35), and the southern response involves the complex interplay of the atmospheric cooling signal and the oceanic warming there.
One abrupt century-long cold event ≈8,200 years ago is prominent in Greenland and other records and affected methane significantly (36). Temperatures before and after this event in Greenland and many other regions were slightly higher than recently, showing that warmth is not a guarantee of climate stability. Abrupt changes have been especially large when atmospheric carbon-dioxide concentration, insolation, and other important climatic variables were changing rapidly, with possible implications for general behavior of the climate system.
Acknowledgments
I thank J. Severinghaus, T. Stocker, numerous colleagues at GISP2 and the Greenland Ice Core Project, the U.S. 109th Air National Guard, the Polar Ice Coring Office, the GISP2 Science Management Office, the U.S. National Ice Core Lab, the U.S. National Science Foundation for funding, E. Brook, K. Cuffey, P. Grootes, P. Mayewski, J. Severinghaus, T. Sowers, their colleagues, and the National Snow and Ice Data Center, University of Colorado at Boulder, and the World Data Center-A for Paleoclimatology, National Geophysical Data Center, Boulder, CO, for data.
Abbreviation
- GISP2
Greenland Ice Sheet Project 2
References
- 1.Alley R B, Shuman C A, Meese D A, Gow A J, Taylor K C, Cuffey K M, Fitzpatrick J J, Grootes P M, Zielinski G A, Ram M, et al. J Geophys Res C Oceans Atmos. 1997;102:26367–26381. [Google Scholar]
- 2.Thompson L G, Mosley-Thompson E, Sowers T A, Henderson K A, Zagorodnov V S, Lin P N, Mikhalenko V N, Campen R K, Bolzan J F, Cole-Dai J, Francou B. Science. 1998;282:1858–1864. doi: 10.1126/science.282.5395.1858. [DOI] [PubMed] [Google Scholar]
- 3.Meese D A, Gow A J, Alley R B, Zielinski G A, Grootes P M, Ram M, Taylor K C, Mayewski P A, Bolzan J F. J Geophys Res C Oceans Atmos. 1997;102:26411–26423. [Google Scholar]
- 4.Alley R B, Gow A J, Johnsen S J, Kipfstuhl J, Meese D A, Thorsteinsson Th. Nature (London) 1995;373:393–394. [Google Scholar]
- 5.Chappellaz J, Brook E, Blunier T, Malaize B. J Geophys Res C Oceans Atmos. 1997;102:26547–26557. [Google Scholar]
- 6.Sowers T, Bender M. Science. 1995;269:210–214. doi: 10.1126/science.269.5221.210. [DOI] [PubMed] [Google Scholar]
- 7.Barnola J M, Pimienta P, Raynaud D, Korotkevich Y S. Tellus. 1991;43:83–90. [Google Scholar]
- 8.Severinghaus J P, Sowers T, Brook E J, Alley R B, Bender M L. Nature (London) 1998;391:141–146. [Google Scholar]
- 9.Alley R B, Meese D A, Shuman C A, Gow A J, Taylor K C, Grootes P M, White J W C, Ram M, Waddington E D, Mayewski P A, Zielinski G A. Nature (London) 1993;362:527–529. [Google Scholar]
- 10.Jouzel J, Alley R B, Cuffey K M, Dansgaard W, Grootes P, Hoffmann G, Johnsen S J, Koster R D, Peel D, Shuman C A, et al. J Geophys Res C Oceans Atmos. 1997;102:26471–26487. [Google Scholar]
- 11.Dansgaard W. Tellus. 1964;16:436–468. [Google Scholar]
- 12.Cuffey K M, Clow G D, Alley R B, Stuiver M, Waddington E D, Saltus R W. Science. 1995;270:455–458. [Google Scholar]
- 13.Johnsen S J, Dahl-Jensen D, Dansgaard W, Gundestrup N. Tellus. 1995;47:624–629. [Google Scholar]
- 14.Pierrehumbert R T. Geophys Res Lett. 1999;26:1345–1348. [Google Scholar]
- 15.McConnell J R, Bales R C, Winterle J R, Kuhns H, Stearns C R. J Geophys Res C Oceans Atmos. 1997;102:26809–26818. [Google Scholar]
- 16.Dibb J E, Jaffrezo J-L. J Geophys Res C Oceans Atmos. 1997;102:26795–26807. [Google Scholar]
- 17.Mayewski P A, Meeker L D, Twickler M S, Whitlow S, Yang Q, Lyons W B, Prentice M. J Geophys Res C Oceans Atmos. 1997;102:26345–26366. [Google Scholar]
- 18.Biscaye P E, Grousset F E, Revel M, Van der Gaast S, Zielinski G A, Vaars A, Kukla G. J Geophys Res C Oceans Atmos. 1997;102:26765–26781. [Google Scholar]
- 19.Raynaud D, Jouzel J, Barnola J M, Chappellaz J, Delmas R J, Lorius C. Science. 1993;259:926–933. doi: 10.1126/science.262.5134.764. [DOI] [PubMed] [Google Scholar]
- 20.Battle M, Bender M, Sowers T, Tans P P, Butler J H, Elkins J W, Ellis J T, Conway T, Zhang N, Lang P, Clarke A D. Nature (London) 1996;383:231–235. [Google Scholar]
- 21.Anklin M, Schwander J, Stauffer B, Tschumi J, Fuchs A, Barnola J M, Raynaud D. J Geophys Res C Oceans Atmos. 1997;102:26539–26545. [Google Scholar]
- 22.Chappellaz J, Blunier T, Raynaud D, Barnola J M, Schwander J, Stauffer B. Nature (London) 1993;366:443–445. [Google Scholar]
- 23.Brook E J, Sowers T, Orchardo J. Science. 1996;273:1087–1093. doi: 10.1126/science.273.5278.1087. [DOI] [PubMed] [Google Scholar]
- 24.Brook E J, Harder S, Bender M, Severinghaus J. In: Mechanisms of Global Climate Change at Millennial Time Scales. Clarke P U, Webb R S, Keigwin L D, editors. Washington, DC: American Geophysical Union; 1999. pp. 165–175. [Google Scholar]
- 25.Severinghaus J P, Brook E J. Eos. 1998;79,Suppl.:F454–F455. (abstr.). [Google Scholar]
- 26.Taylor K C, Mayewski P A, Alley R B, Brook E J, Gow A J, Grootes P M, Meese D A, Saltzman E S, Severinghaus J P, Twickler M S, et al. Science. 1997;278:825–827. [Google Scholar]
- 27.Taylor K C, Lamorey G W, Doyle G A, Alley R B, Grootes P M, Mayewski P A, White J W C, Barlow L K. Nature (London) 1993;361:432–436. [Google Scholar]
- 28.Kapsner W R, Alley R B, Shuman C A, Anandakrishnan S, Grootes P M. Nature (London) 1995;373:52–54. [Google Scholar]
- 29.Fisher D A, Koerner R M, Reeh N. Holocene. 1995;5:19–24. [Google Scholar]
- 30.Thompson L G, Mosley-Thompson E, Davis M E, Lin P-N, Henderson K A, Cole-Dai J, Bolzan J F, Liu K-B. Science. 1995;269:46–50. doi: 10.1126/science.269.5220.46. [DOI] [PubMed] [Google Scholar]
- 31.Blunier T, Chappellaz J, Schwander J, Daellenbach A, Stauffer B, Stocker T F, Raynaud D, Jouzel J, Clausen H B, Hammer C U, Johnson S J. Nature (London) 1998;394:739–743. [Google Scholar]
- 32.Steig E J, Brook E J, White J W C, Sucher C M, Bender M L, Lehman S J, Morse D L, Waddington E D, Clow G D. Science. 1998;282:92–95. doi: 10.1126/science.282.5386.92. [DOI] [PubMed] [Google Scholar]
- 33.Alley R B, Clark P U. Annu Rev Earth Planet Sci. 1999;27:149–182. [Google Scholar]
- 34.Stocker T, Wright D G. Nature (London) 1991;351:729–733. [Google Scholar]
- 35.Crowley T J. Paleoceanography. 1992;7:489–497. [Google Scholar]
- 36.Alley R B, Mayewski P A, Sowers T, Stuiver M, Taylor K C, Clark P U. Geology. 1997;25:483–486. [Google Scholar]
- 37.Alley, R. B. (2000) Q. Sci. Rev., in press.
- 38.Johnsen S J, Dansgaard W, Clausen H B, Langway C C. Nature (London) 1972;235:429–434. doi: 10.1038/227482a0. [DOI] [PubMed] [Google Scholar]
- 39.Bender M, Malaize B, Orchardo J, Sowers T, Jouzel J. In: Mechanisms of Global Climate Change at Millennial Time Scales. Webb R S, Clark P U, Keigwin L D, editors. Washington, DC: American Geophysical Union; 1999. pp. 149–164. [Google Scholar]
- 40.Cuffey K M, Clow G D. J Geophys Res C Oceans Atmos. 1997;102:26383–26396. [Google Scholar]
- 41.Grootes P M, Stuiver M. J Geophys Res C Oceans Atmos. 1997;102:26455–26470. [Google Scholar]