

Abstract
Silk fibroin films are a promising class of biomaterials that have a number of advantages for use in ophthalmic applications due to their transparent nature, mechanical properties and minimal inflammatory response upon implantation. Freestanding silk films with parallel line and concentric ring topographies were generated for in vitro characterization of human corneal limbal-epithelial (HCLE) cell response upon differing geometric patterned surfaces. Results indicated that silk film topography significantly affected initial HCLE culture substrate attachment, cellular alignment, cell-to-cell contact formation, actin cytoskeleton alignment, and focal adhesion (FA) localization. Most notably, parallel line patterned surfaces displayed a 36%–54% increase on average in initial cell attachment, which corresponded to an over 2-fold increase in FA localization when compared to other silk film surfaces and controls. In addition, distinct localization of FA formation was observed along the edges for all patterned silk film topographies. In conclusion, silk film feature topography appears to help direct corneal epithelial cell response and cytoskeleton development, especially in regards to FA distribution, in vitro.
Keywords: cornea, epithelium, focal adhesion, topography, silk
1. Introduction
Silk proteins have evolved as the arthropod’s material for producing external structures over the last 380-million years [1], and produce the world’s strongest natural fibers once extruded from the insect’s body [2]. Silk fibers are commonly associated with textile manufacturing and use as a medical suture, however recently a silk biopolymer solution derived from these fibers has been used to form a wide range of materials forms, such as films, sponges, hydrogels, and solid blocks [3]. In this regard, silk may be considered an engineering grade biopolymer in which the formed material properties may be modulated primarily through the induction of protein secondary structure formation (i.e. alpha-helices and beta-sheets) and by controlling water content through a variety of processes [4–6]. One of the primary uses of regenerated silk materials is in the production of scaffolding material in the fields of tissue engineering and regenerative medicine due to their inherent biocompatibility [7,8]. Specifically, silk films offer a wide platform for biomaterial innovation due to their highly controlled material properties, ease of fabrication, biocompatible nature, and potential for chemical modification [5,9–11]. One interesting material property of silk films is their ability to produce topographic features on the micro and nanometer scale, which allows for the formation of surface patterned culture surfaces for cell growth [12–14]. Topographic contact guidance of cells by surface topography can have dramatic effects upon cellular development, extracellular matrix (ECM) alignment and formation, cell proliferation, cellular adhesion, and proliferation and apoptosis [13–16]. In this way silk film substrates offer an elegant system to produce customized patterned surfaces that can be designed to promote a desired cellular response with potential to elicit a clinically desirable effect [9].
Silk films are currently being developed for use in ophthalmology for use in the cornea due to their transparent nature and biomaterial properties [13,17,18]. Recent work has focused on developing silk films for use in ocular surface repair and corneal tissue engineering applications [17,18]. The role of surface topography influencing corneal epithelial response is a subject of interest due to the potential ramifications in expediting the wound healing process post injury. Engineered surfaces can be designed to enhance corneal epithelial adhesion, migration, proliferation, extracellular matrix (ECM) production, and cellular alignment which are all important aspects in the wound healing response [19–22]. However, these studies have been performed upon material surfaces not suitable for in vivo implantation (i.e. silicon and plastic) and future in situ tissue integration and regeneration. Therefore, silk films offer the potential to optimize the material in vitro with the added potential benefit for in vivo translation.
It would be advantageous to produce a silk film topography that has been engineered to enhance the corneal epithelial healing response. However, limited studies have been performed to date that characterize corneal epithelial response upon such patterned silk substrates. The goal of the present study is to characterize the relationship between silk film topography and corneal epithelial cell response. In the present work silk films with varying surface topography feature geometries (i.e. parallel lines and concentric ring circles) were produced using standard photolithography, ion-etching, and soft-lithographic techniques to produce cell culture substrates [23,24]. The surface topographies were designed to allow for a controlled in vitro comparison of various cellular responses such as cell morphology, cell attachment, culture growth, and cytoskeletal localization and distribution over time in culture. Furthermore, the use of lined and ringed topographies allows for a direct comparison of how the presence of feature curvature plays a role in cell-to-surface response over time in culture.
2. Materials and Methods
2.1. Silk Fibroin Production
Bombyx mori silkworm cocoons (Tajima Shoji Co., Yokohama, Japan) were cut into thirds and then boiled for 40-minutes in 0.02M Na2CO3 (Sigma-Aldrich) to extract the glue-like sericin proteins from the structural fibroin proteins as previously described [13]. The fibroin extract was then rinsed three times in dH2O for 20 minutes per wash. The rinsed fibroin extract was then dissolved in 9.3M LiBr solution at room temperature, and placed covered within a 60°C oven for 4-hours. The solution was dialyzed in water for 48-hours (MWCO 3,500, Pierce, Inc.). The dialyzed silk solution was centrifuged twice at 13,000-g, and the supernatant collected and stored at 4°C. The final concentration of aqueous silk solution was 8 wt./vol.%, as determined by gravimetric analysis.
2.2. Patterned silicon wafer production
Silicon wafers possessing either parallel line or concentric ring topographies were prepared using standard photolithographic and ion etching techniques. The specific topographies were selected to compare how geometric shape, such as line and circular patterns, affect cell response both initially and at later culture time points. The features composing the various geometric surface topographies possessed dimensions measuring a 2-μm width, 4-μm pitch, and 1.5-μm depth. Width and pitch measurements were chosen based on previous literature that demonstrated this dimension produced a contact guidance effect upon corneal epithelium, which modulated various cellular characteristics such as alignment and adhesion [19,21,22,25]. The 1.5-μm depth was chosen based on previously cited experiments that indicated this depth appears to have a negligible effect on cellular function [26]. As a result the selected dimensions allow for the controlled comparison of cellular response upon various geometric surface topographies without adding potential variables from feature width, pitch, or depth. A 21-die array in a [3:5:5:5:3] design was fabricated upon a 100-mm silicon wafer. Individual dies have a 10-mm diameter separated by 5-mm spacing. Feature dimensions were verified using scanning electron microscopy (SEM).
Photolithography mask patterns were designed using L-edit software (Tanner EDA, Inc.) and then imported into a DWL66 laser pattern generator and direct write machine (Heidelberg Instruments, Heidelberg, Germany) for production onto a photoresist coated glass substrate. The finished mask was then placed within an Autostep 200 DSW i-line wafer stepper (GCA, Inc.) for photolithographic patterning of photoresist coated 100-mm diameter silicon wafers. Wafers coated with 1-μm thick layer of photoresist (Megaposit™ SPR™ 220-3.0, Dow Chemical, Inc.) were produced that possessed the 21-die wafer array. The wafers were then placed into a Unaxis 770 ion etching device (Plasma-Therm, LLC, St. Petersburg, FL) to produce 1.5-μm depth etch. The above process was designed to provide repeated topographic features measuring 2-μm in width, 4-μm in pitch, and 1.5-μm in depth over a circular surface area with a 1-cm diameter. Feature sizes were then imaged using an Ultra SEM (Zeiss, Inc.).
2.3. Casting surface preparation
Flat polydimethyl siloxane (PDMS) substrates of 0.5–1.0-mm thickness were prepared by pouring 5-mL of a 1:10 casting catalyst/PDMS (Momentive, Inc., Albany, NY) solution onto the patterned silicon wafer surfaces. The cast PDMS solution was then degassed for 2-hours under vacuum, and then cured in an oven at 60°C overnight. The following day the cured PDMS was removed from the silicon substrate and then punched to form round 14-mm circles centered on the patterned surface. The PDMS substrates were placed cast side up and dust/debris stripped using clear tape. The surfaces were further cleaned with a 70% ethanol wash (EtOH), three distilled water (dH2O) rinses, and then allowed to air dry in a clean environment. PDMS surfaces were used for multiple silk film castings. Before additional casting, the PDMS surfaces were prepared using a 9.3-M LiBr soaking step with subsequent EtOH and dH2O rinses to remove residual silk fibroin protein from the surface.
2.4. Silk film casting and sterilization
Silk films 40-μm in thickness were cast using 75-μL of 8% silk fibroin solution cast upon the round PDMS surfaces as previously described [13]. After casting, films were covered with a venting lid and allowed to dry for 24-hours to form the patterned silk film surface. Appropriate numbers of silk films were prepared depending on the experimental setup. Silk film samples were then water-annealed (WA) by placing the samples in water filled containers (i.e. emptied plastic desiccator) in which a vacuum (10-psi) was used to produce a water-vapor saturated environment and left to sit for greater than 4-hours. This process induces β-sheet protein secondary structure formation and produces a water-insoluble silk film for cell culture [25]. The silk film sample surface topographies were imaged using SEM to verify surface feature dimensions.
After the WA process, silk film samples were removed from their PDMS surfaces and submerged within 70% EtOH for 15-minutes in a clean bench environment. In addition, 15-mm diameter glass cover slip control surfaces and stainless steel O-rings (Superior Washer, Inc., Hauppauge, NY) measuring 15.4-mm in outer diameter and 11.6-mm inner diameter were submerged within 70% EtOH for the same time period. Silk film samples and glass control surfaces were then placed pattern side up into 24-well plates, and a stainless steel O-ring was placed on top to hold the film down to the culture well bottom surface. Films were then subsequently washed three times with 1-mL of sterile PBS. The silk film samples were left in the final PBS wash until ready for cell seeding.
2.5. HCLE cell preparation and culture
A previously established immortalized human corneal-limbal epithelium (HCLE) cell line was kindly provided by Dr. Ilene Gipson (Schepens Eye Research Institute, Harvard Medical School, Boston, MA). The HCLE cultures were chosen based on the cell line’s highly characterized history, and reliability when working with new substrates such as patterned silk films [27]. The cells were given keratinocyte serum free medium (K-SFM), 1% 100X penicillin-streptomycin and 0.3-M CaCl2. In addition, the medium was supplemented with 0.45 vol.% bovine pituitary extract (BPE), and 0.2-ng/mL of epithelial growth factor (EGF, Human recombinant). Media supplies were purchased from Invitrogen (Eugene, OR). The HCLEs were cultured until 90% confluent upon TCP, and then seeded upon the various silk films and glass topographies. A seeding density of 10,000 cells per cm2 was chosen based on the fact cultures would reach near confluency after 3-days post seeding. Culture media was changed every 48-hours post seeding.
2.6. Nucleic acid content assay
The CyQuant NF (Invitrogen, Inc., Eugene, OR) assay was utilized to assess cellular nucleic acid content as a measure of initial cellular adhesion and culture proliferation upon the silk film and TCP surfaces. The stainless steel rings were removed from the sample wells, the sample surfaces were transferred to a new 24-well plate, and the cultures were placed into a −80°C freezer overnight following the manufacturers recommendations. HCLE cultures (n = 4) for each surface were prepared and harvested at 4-hour, 1-day, 3-day, and 7-day time points post cell seeding. Standard curves were developed by seeding 10,000, 20,000, 40,000, 60,000, and 75,000 cells in a 24-well plate (n = 3), centrifuged to attach cells to well bottom surfaces, media was removed, and the plate was placed in the freezer with samples. The following day, 500-μL of prepared CyQuant solution from the supplied protocol (5% 20x lysis buffer, 94.75% sterile dH2O, and 0.25% 400x CyQuant dye reagent) was added to each sample and standards. Samples were placed in a 37°C incubator for 5-minutes, shaken, and then 200-μL sample volumes were pipetted into 96-well plates. Control samples without cells were used as blank samples for silk and glass surfaces. Dye binding was measured by fluorescence with an excitation wavelength of 485-nm and an emission wavelength of 530-nm using a SpectraMax M2 fluorimeter microplate reader (Molecular Devices, Inc., Sunnyvale, CA). Fluorescent activity was then converted to cell number using the produced standard curves (R2 value = 0.99).
2.7. Scanning electron microscopy (SEM)
Cross-sectional silk film material samples were placed in liquid N2 and cracked down the center of the film using a razor blade. Biological samples were washed with PBS and then fixed with Karnofsky’s fixative (Electron Microscopy Sciences, Hatfield, PA) for 15-minutes at room temperature. Samples were processed through serial EtOH dehydration baths (50, 70, 90, and 100% EtOH) for 2-minutes per bath concentration. Samples were then further dried using hexamethyldisiloxane (HMDS, Sigma-Aldrich, Inc.) solvent to remove residual water saturation for 2-minutes [28], and then allowed to dry for 2-hours in a desiccator. After HDMS processing, samples were sputter coated with gold for 90-seconds leaving an approximate 2-nm coating on the samples. Films were then imaged using an Quanta 600 environmental chamber SEM (FEI, Inc., Hillsboro, OR).
2.8. Imaging and fluorescent staining
All phase contrast, differential interference contrast (DIC), and fluorescent images were taken using an Observer Z1 fluorescent microscope (Carl Zeiss, AG) with either a 2.5x (NA 0.12 air), 10x (NA 0.45 air), or 63x (NA 1.4 oil) objective lens as indicated utilizing a 1.0 or 1.6 Optivar optic as indicated. An AxioCam single channel camera and AxioVision software (Carl Zeiss, AG) were used to capture all images as indicated.
Phase contrast images of cultures at1-day post seeding were captured using a 10x objective and 1.6 Optivar. Samples from each substrate were fixed with 4% paraformaldehyde in PBS for 15-minutes, permeabilized with 0.4% Tween-20 in PBS for 5-minutes, and blocked with 2% BSA in PBS for 30-minutes at room temperature. Anti-vinculin primary antibody (V9131, Sigma, St. Louis, MO) was incubated with cells at 1:600 dilution for 1-hour at room temperature, followed by incubation with Oregon Green 488 goat anti-mouse secondary antibody (O11033, Invitrogen, Eugene, OR) at a 1:800 dilution for 1-hour. F-actin and nuclei were then stained by incubating cells in 1:100 dilution of Alexa Fluor 568 Phalloidin (A12380, Invitrogen, Inc., Eugene, OR ), and 1:10,000 dilution of DAPI (83210, AnaSpec, San Jose, CA) for 20-minutes and 5-minutes, respectively while protected from light. After rinsing using PBS, samples were mounted, and protected with a glass cover slip.
2.9. Image analysis and processing
For cell spreading measurements the10x objective and MosaiX software was used to take 4×4 arrays of phalloidin stained cells for F-actin. Images were then analyzed in ImageJ software using the “Trace” tool (N = 3, n = 10) utilizing a double blind measurement protocol of cell spreading as determined by measuring the demarcated outline of the actin cytoskeleton. The ‘center’ region of each image was considered to be the 100-μm radius from the center of the 1-cm culture surface area, while the ‘periphery’ region was considered to be a 100-μm ring width circumference at the outermost region of the 1-cm culture surface area.
Vinculin and actin fluorescent images were taken using either the 10x or 63x objective utilizing a 1.6 Optivar. Z-stack images (10–25 layer range) were captured at 0.25-μm slices using DAPI, GFP, and Texas Red filter channels. Additionally, DIC microscopy was used to image the patterned silk film surface for each z-stack layer. For images captured using the 63x objective deconvolution was performed on each z-stack using 3D Huygens Deconvolution Software (Scientific Volume Imaging BV, The Netherlands) to assist with reducing the strong background fluorescence emitted from the silk protein substrates. A total of 40-iterations were performed employing the software’s Classic Maximum Likelihood Estimation (CMLE) algorithm for each z-stack, as it was found that increasing the number of iterations had a minimal effect on improving the image. All other settings were left at manufacturer default settings. Images were produced using both maximum intensity projection (MIP) and surface rendering settings. MIP threshold levels were set at default manufacturer settings, while surface-rendering threshold was set to match MIP image signal localization and intensity. The number of vinculin-positive FAs was quantified, and the plot profile of actin fibers was obtained by using ImageJ (NIH) Plot Profile function. Analysis of vinculin percent image area, number, and average area size were calculated using the ImageJ ‘Particle Analysis’ functionality. This was accomplished by separating the collected vinculin channel from the deconvoluted z-stack images, then transforming the image into an 8-bit rendering, and the threshold setting was set outside the 95% pixel intensity distribution profile to aid in eliminating background signal.
2.10. Western blot
HCLE cells were cultured upon the various silk film surfaces and glass substrates for 4-hours (n = 12) and 3-days (n = 6) each. The sample number was doubled for the 4-hour time point to ensure enough protein would be collected for Western Blot analysis. At each time point the cell media was removed, and each sample was washed 2x with PBS at 4°C. Following PBS removal, a 200-μL sample of RIPA buffer solution (Thermo Scientific, Rockford, IL) was added to each sample to release intracellular protein. The RIPA solution was prepared with 3-mL of RIPA buffer each that contained 20-mM Tris, pH 7.2, 150-mM NaCl, 1% Triton X-100, 1% sodium deoxycholate, 0.1% sodium dodecyl sulfate (SDS)), and 30-μL of protease and phosphatase inhibitors (100x Halt™ single-use cocktail, Thermo Scientific). The cell protein was collected using a 1-cm cell scraper device (BD Biosciences, Bedford, MA), and the cell lysate solution was then collected and added to the next sample well to increase the concentration of protein. This process was repeated for each substrate sample group, and the resulting protein lysate was mixed on ice for 15-minutes and then centrifuged at 14,000-RCF for 15-minutes (5415 D, Eppendorf, Inc.). The supernatant was then collected and the cell debris discarded. This experiment was repeated 3x.
The protein concentration of each sample was determined using the bicinchroninic acid (BCA) assay (Thermo Scientific, Rockford, IL) as previously described [29], and all samples were diluted to 30-ug/mL concentration. Next, 10-μL of NuPAGE® LDS Sample Buffer (4x, Invitrogen, Inc.) was added to each sample, and the protein ladder sample was prepared with 10-μL of LDS, 25-μL of RIPA buffer solution, and 5-μL of protein mix (10747-012, Invitrogen, Inc.). All samples were then heated at 70°C for 10-minutes. Next, two NuPAGE® gels (1.0 mm × 15-well, 4–12% Bis-Tris, Invitrogen, Inc.) were loaded with 15-μL of sample, and ran in 1x NuPAGE® MES SDS Running Buffer (20x, Invitrogen, Inc.) using a constant 200-V setting for 40-minutes.
After completing electrophoresis the gels were removed from their plastic cases and the proteins were transferred to a polyvinylidene fluoride (PVDF) membrane using the iBlot® Gel Transfer Device (Invitrogen, Inc.). The membrane was then placed into infrared (IR) compatible blocking buffer (Odyssey®, LI-COR Biosciences) for 1-hour. Next, 1:400 primary antibody dilutions of vinculin (V9131, Sigma, Inc.), actin (AB1801, Abcam, Inc.), and GAPDH (AB9483, Abcam, Inc.) were prepared in blocking buffer. Membranes were then incubated in primary antibody solution at 4 °C for 24-hours and then washed 3x with 0.1% TWEEN® 20 (Sigma-Aldrich, Inc.) for 10-minutes each. The appropriate infrared dye labeled secondary antibody solutions were prepared at a dilution of 1:5,000 (IRDye®, LI-COR Biosciences, Inc.) for vinculin, GAPDH, and actin in blocking buffer, and membranes were incubated for 1-hour covered from light. The membranes were then rinsed 3x with 0.1% TWEEN® 20 for 10-minutes each. The membranes were then analyzed on an infrared Odyssey machine (LI-COR Biosciences, Inc.) using Odyssey V3.0 software utlizing both 700-nm and 800-nm wavelengths. Protein densitometry measurements were attained by first adjusting the image display curve to remove background, and then the densitometry was measured with a standard rectangular area for each membrane sample. Ratios from the various sample readings were then calculated.
2.11. Statistical analysis
Statistical analysis was performed using the Student’s t-test. Differences were considered significant when p < 0.01.
3. Results
3.1. Characterization of silk substrates and HCLE response
Patterned silicon wafers possessing both parallel lines and concentric ring feature geometries were successfully produced, and then used to mold negative pattern imprints onto PDMS surfaces using soft lithography methods [30]. Patterned silk films of the original silicon pattern were then successfully created as previously shown [12]. Final silk film feature dimension were analyzed using SEM, which demonstrated the expected feature dimensions formed on the silk surface (Figure 1). Flat and patterned silk film surfaces could be produced with high fidelity (Figure A–C). In addition the correct feature pitch was produced on both lined and ringed silk surfaces (Figure B–C) which corresponded with previous results [13]. Cross-sectional analysis of the silk films demonstrated a smooth surface for flat films (Figure 1D), and correct feature depth was achieved for both patterned surface geometries (Figure 1E).
Figure 1.
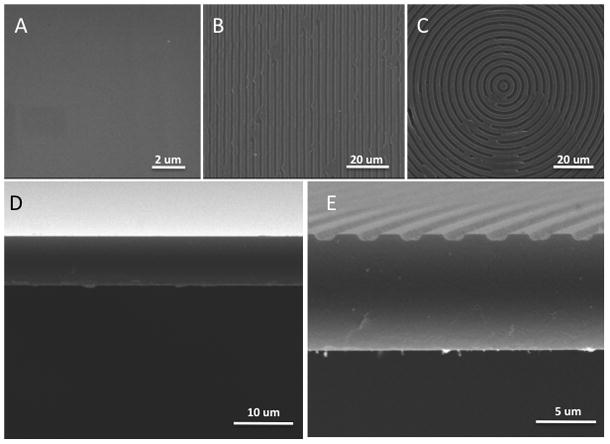
En face SEM images of silk film surfaces for (A) flat, (B) parallel lined, and (C) concentric ringed topographies. Cross-sectional images for both (D) flat and (E) patterned silk surfaces demonstrate feature depth and bulk film structure. Measured silk feature dimensions and geometries were comparable to the expected design parameters of a 2-μm width, 4-μm pitch, and 1.5-μm feature depth.
HCLE cells were seeded upon the various silk surfaces and glass controls. Phase contrast imaging after 3-days in culture revealed cultures growing readily on all surfaces (Figure 2A–D). Overall cellular growth upon the surface was similar between controls and flat silk surfaces (Figure 2A–B). In addition patterned feature geometries did not appear to affect cellular growth as well (Figure 2C–D). Nucleic acid content was assessed for the various surfaces after 4-hours in culture, and revealed that parallel line features significantly increase (n = 4, p < 0.02) initial cell attachment by 36–54% on average when compared to other substrates (Figure 2E). All other surfaces demonstrated similar cell counting results.
Figure 2.
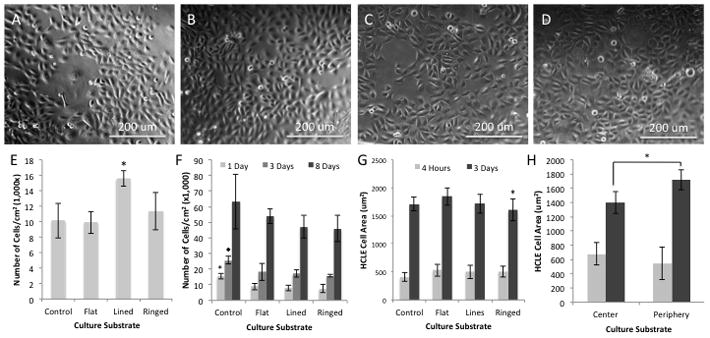
Phase contrast images of HCLE cells grown on (A) glass surfaces and (B) flat, (C) lined, and (D) ringed silk substrates after 3-days in culture. (E) Nucleic acid assay results for the various substrates at 4-hours in culture where lined silk substrates showed the greatest initial adhesion of HCLEs (* indicates p<0.02 compared to all substrates, n = 4, error bars indicate SD). (F) Nucleic acid assay results showing growth characteristics for the various substrates over an 8-day period where glass substrates show greater cell numbers, which then begin to equalize over time in culture (* indicates p < 0.01 compared to all substrates and lined and ringed respectively, n = 4, error bars indicate SD). (G) Cell spreading results for the various cultures, illustrating at 4-hours in culture spreading is the same while at 3-days a difference is detected between flat and ringed silk surfaces (* indicates p < 0.01 compared to flat, n = 30, error bars indicate 95% CI). (H) Further spreading analysis revealed that spreading on ringed surfaces is less towards the center where increased feature curvature is present (* indicates p < 0.01 for 3-day time points, n = 30, error bars indicate 95% CI), however no significant difference was observed between the peripheral region of the ringed features and the flat silk surfaces (data not shown).
Nucleic acid content assay results revealed the growth profiles for the cultures over an 8-day period (Figure 2F). It was shown that control surfaces had a significant increase in cell number after 1-day in culture (n = 4, p < 0.01), and had on average a 67%–100% increase in cell number. By 3-days in culture the cell number was still significantly higher on control surfaces as compared to silk, but this increase had decreased to 44%-63% on average and signified silk surfaces were gaining confluence. By 8-days in culture cell numbers were on average lower for cultures grown on silk film substrates as compared to glass controls, however, no statistically significant difference was observed between the various surfaces.
Cell spreading was also assessed on the various surfaces (Figure 2G). No significant differences in cell area size was observed for all surfaces at 4-hours in culture. However, by 3-days in culture there was a significant decrease (N = 3, n = 10, p < 0.01) of 15% of cell area on average for cultures on ringed silk surfaces when compared to flat silk films. This was further analyzed by measuring the center and periphery culture regions for each substrate. Ringed surfaces were the only samples that had a decrease in cell spreading in the center region of the culture substrate when compared to their respective periphery regions (N = 3, n = 10, p < 0.01) (Figure 2H). This was a 23% decrease in cell area on average when comparing between the center and periphery regions of the ringed surfaces. In addition, there was a 32% decrease in average cell area when comparing the center region of the ringed silk surface to the flat silk films. However, there was no significant difference in cell spreading between the periphery regions of the ringed surface and the flat silk films.”
SEM imaging was utilized to visualize cell-surface attachment and intercellular contact formations after 1-day in culture. HCLE cell alignment was observed along the length axis of the parallel line features, and cell processes extended into the pitch depth (Figure 3A). Cell alignment was most prevalent among single cells when compared to cell clusters. The geometry of the surface pattern appeared to dictate cell alignment as cultures grown on concentric ring features appeared to bend with the topography curvature (Figure 3C). This effect was observed near the center region of the ringed features where the degree of curvature was greatest. Comparison of cell morphologies at the border of flat and lined silk film surfaces revealed that culture growth did not appear hampered by the either flat or patterned substrates (Figure 3B). Intercellular contact formation was greatly affected by the presence of the surface pattern. On flat silk substrates intercellular contact were evenly formed along the cell borders (Figure 3D). However, cells cultured on patterned surfaces formed intercellular contacts localized along the apical surface of the feature, and not within the pitch gap (Figure 3E).
Figure 3.
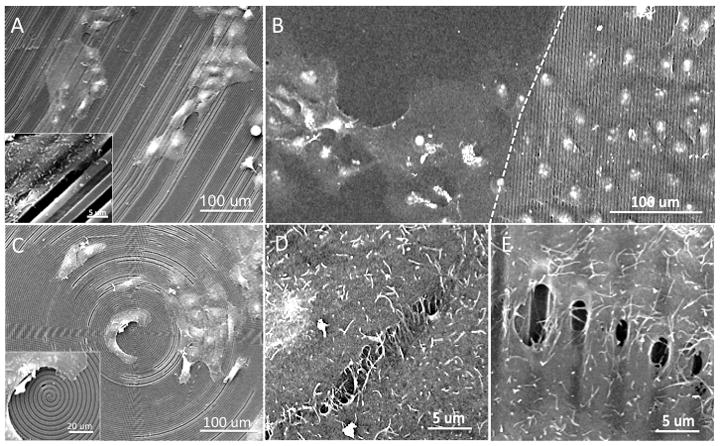
Representative SEM images of HCLE cultures upon silk film surfaces after 1-day in culture upon surface features arranged in (A) parallel line and (C) concentric ring geometries. (B) Direct comparison between cells cultured upon border region of flat and patterned silk film surfaces as demarcated by the dotted line revealed similar growth characteristics. Cell contact area for cells cultured upon (D) flat and (E) patterned silk film surfaces indicated the difference in cell-cell contact morphology especially in regard to gaps formed over the feature depths.
3.2. Characterization of cytoskeletal localization upon patterned versus flat silk film topographies
HCLE actin fibril architecture and vinculin formation were assessed at 4-hours and 3-days post seeding to assess initial cell adhesion and near-confluent culture time points. The cytoskeleton architecture was significantly affected by the presence of the silk film surface topography. Within 4-hours after cell seeding patterned silk film surfaces induced formation of the actin fibrils along the length of the surface feature axis. Differences in actin formation were observed between patterned and flat silk surfaces. On flat surfaces actin formed primarily in a ring along the cell body periphery (Figure 4A), while on patterned surfaces actin fibers extended across the cell body (Figure 4B–D). By day 3 in culture this difference in actin formation became more pronounced on both the flat (Figure 4E) and patterned surfaces (Figure 4F–G). Differences in actin formation were observed between the parallel line and concentric ring surfaces. On the lined surfaces the actin fibers formed across the cell body tended to align along the length axis of the patterned features (Figure 4F). However, on the concentric ring surfaces actin fibers also formed across the cell body, but did not align with the ringed feature patterns as apparently (Figure 4G).
Figure 4.
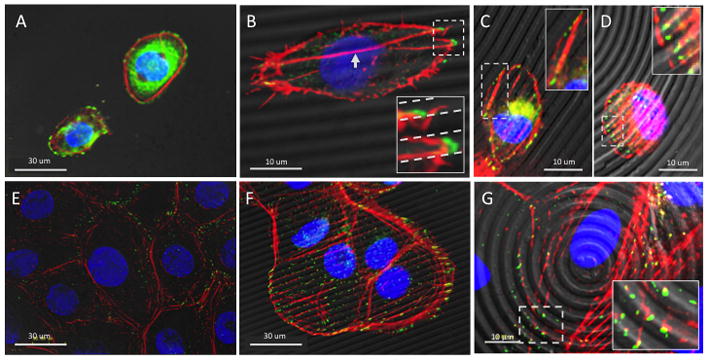
Representative fluorescent microscopy images of HCLE cytoskeletal architecture (red – actin, green – vinculin, blue – nucleus) overlayed upon DIC images of respective silk film culture surfaces for (A) flat, (B) lined, and (C,D) ringed topographies after 4-hours in culture. Imaging demonstrated actin fibril and vinculin localization near the cell periphery on flat surfaces, while on patterned surfaces fibril elongation occurred along the feature axis and vinculin localization occurred along the feature edge. Boxed regions show enlarged regions of interest for actin and vinculin localization on patterned silk surfaces. Images taken at 3-days in culture on (E) flat, (F) lined, and (G) ringed silk film topographies demonstrated similar results, but to a greater extent.
FA formation also appeared to be significantly affected by the presence of the surface pattern when observing vinculin localization. On flat silk surfaces vinculin localized towards the cell periphery (Figure 4A), which was also the case for glass controls (data not shown). However, on patterned silk surfaces vinculin distributed at additional sites along the basal surface of the cells (Figure 4B–D). Specifically, it was observed that vinculin was primarily localizing at the feature edge as formed by the vertical side-wall and horizontal apical surface of the silk substrates. The localization of vinculin to the feature edge was further investigated through the use of 3-dimensional (3D) surface rendering software, which creates a digital rendering of the original fluorescent signature [31]. After 3 days in culture, HCLE cells grown on patterned silk film surfaces appeared to have vinculin localized to the feature edge (Figure 5A). Upon closer examination it was found to localize consistently at the feature edge surfaces (Figure 5B), and the vinculin protein globule extended downward into the feature depth (Figure 5C), which coincided with the location of the feature sidewalls (Figure 5D)
Figure 5.
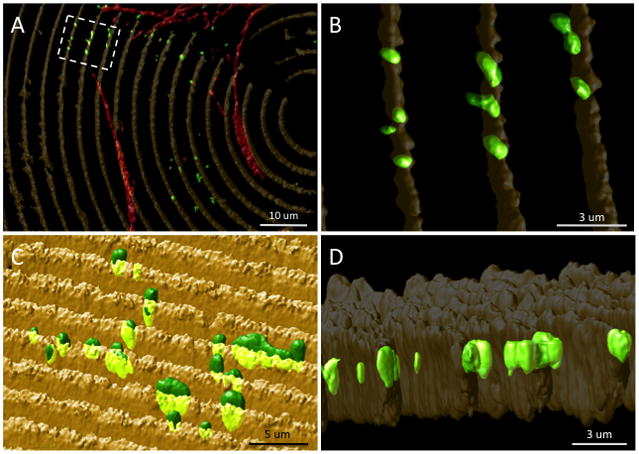
Representative 3D surface renderings of a fluorescent microscopy image of an HCLE cell cultured for 3-days upon a concentric ring silk film surface topography. (A) En face image of cytoskeletal architecture (red – actin, green – vinculin) and silk film wall topography (yellow) for a cell cultured in center region of the silk film surface. (B) Magnified image of boxed area of interest from panel-A demonstrating localized vinculin formation on the patterned feature edge region. Alternative angled profile views demonstrating (C) vinculin localization to upper half of feature wall height and (D) penetrating structures into the feature depth.
The influence of surface topography on actin formation was further investigated by analyzing the fluorescent signature intensity of fibril localization upon patterned and flat silk film substrates. Actin alignment was largely absent after 3-days in culture upon flat silk surfaces (Figure 6A), and the plot profile of a single cell illustrated the absence of intracellular actin formation with an increased signal intensity located at the cell periphery (Figure 6C). Patterned silk topographies exhibited an enhanced effect on intracellular actin fibril alignment (Figure 6B), which was demonstrated by a periodic signal pattern in the plot profile that was characteristic of the surface feature dimensional design (Figure 6D). The frequency of signal peaks appeared in 4-μm frequency intervals, and corresponds with the 4-μm pitch of the patterned features.
Figure 6.
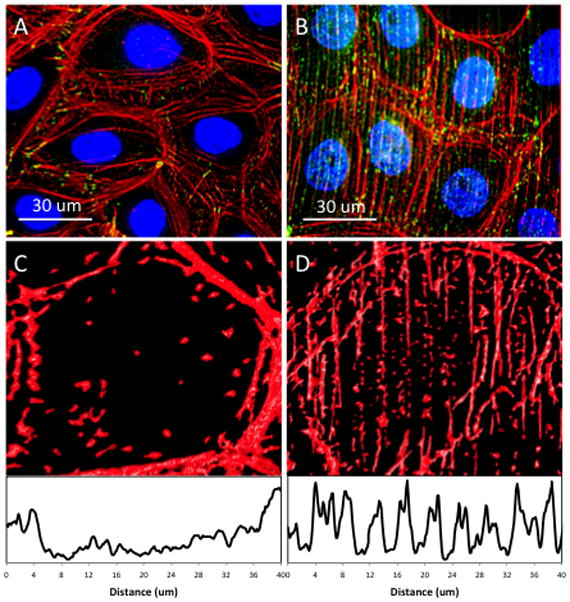
Fluorescent microscopy images of the cytoskeletal localization (red – actin, green – vinculin) upon both (A) flat and (B) patterned silk film surfaces. Representative images of cell actin localization upon (C) flat and (D) lined silk film surfaces with respective surface plot profiles shown below demonstrating actin fibril localization towards the periphery on flat silk film surface, and fibril alignment along the patterned lined silk topography as indicated by the periodical intensity peaks corresponding to feature presence.
The influence of surface topography on vinculin formation was further investigated by analyzing the localization of fluorescent signature intensity on patterned and flat silk film substrates at 3-days in culture. Vinculin localization upon flat silk film surfaces was found both intracellularly and at the cell periphery (Figure 7A), which was represented in stochastic patterning of signal (Figure 7C). However, the patterned silk surfaces demonstrated a more pronounced alignment of vinculin than actin fibrils (Figure 7B). Plot profile analysis demonstrated that vinculin localization strongly correlated to the presence of topographic feature edges (Figure 7D). A strong frequency of signal intensities was apparent at 2-μm distances upon patterned silk film substrates, which was characteristic of the surface feature dimensional design.
Figure 7.
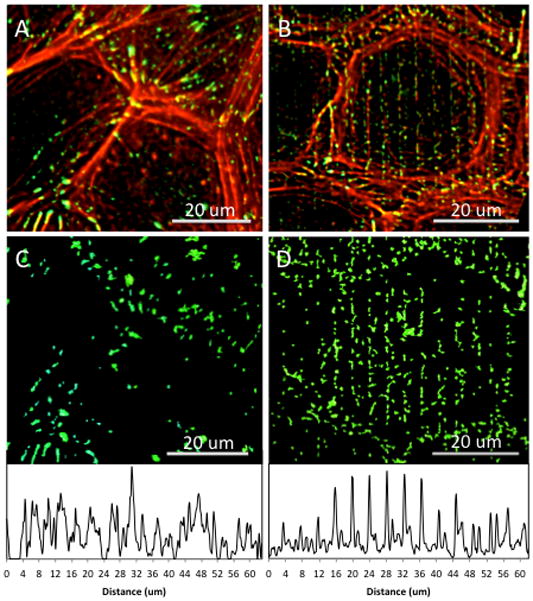
Fluorescent microscopy images of cytoskeletal localization (red – actin, green – vinculin) upon (A) flat and (B) patterned silk film surfaces, with (C–D) respective vinculin localization surface plots shown below to illustrate degree of FA patterning corresponding to signal intensity peaks upon patterned silk topographies as compared to the stochastic peak intensity profiles for flat silk surfaces.
3.3. Analysis of vinculin localization and cytoskeletal protein quantification
As a marker of focal adhesions (FA), vinculin fluorescent signal localization was compared between parallel line and concentric ring patterned silk substrates, flat silk surfaces, and glass controls. Percent total vinculin area localization significantly increased (n = 7, p < 0.01) on parallel lined topographic features by over 2-fold on average when compared to other substrates after 4-hours in culture (Figure 8A). After 3-days in culture, lined feature surfaces demonstrated the greatest percent reduction in vinculin localization for all substrates when compared to respective 4-hour time points. Specific sites of vinculin concentration for HCLE cells on both patterned silk topographies and glass control substrates were measured as an estimate of FA size (Figure 8B). Analysis of the discrete areas of vinculin localization at 4-hours in culture revealed that there was no difference between estimated FA size over the various substrates. At the 3-day time point an over 4-fold increase in estimated FA size occurred on all silk film substrates, while glass substrates showed a minimal increase in size between the two time points. In summary, lined topographies experienced the greatest decrease in total vinculin localization, while demonstrating the least increase in discrete vinculin area over time as compared to other silk substrates.
Figure 8.
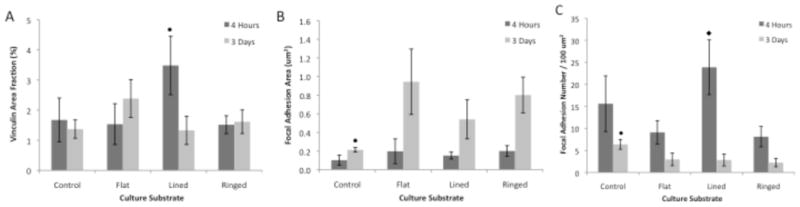
(A) Quantified analysis of vinculin signal area as a percentage of total image area indicating lined silk film surfaces had the greatest vinculin localization at 4-hours in culture and similar levels across all substrates after 3-days in culture. (B) Individual FA area as defined by discrete areas of vinculin measurements indicating silk surfaces had significantly larger FAs than control surfaces by 3-days in culture. (C) Total FA number per 100 um2 area as defined by vinculin staining upon various culture substrates indicating the highest number on lined silk surfaces as compared to other silk surfaces after 4-hours in culture, and a significant decrease in FA number by 3-days in culture for all surfaces (n = 7; error bars = 95% CI ● ◆ - indicates p<0.01 when compared between groups and between other silk substrates respectively).
Further analysis investigated the number of FA formed per area of culture substrate as indicated by the presence of vinculin signal (Figure 8C). The analysis revealed that all substrates had a 2 to 5-fold decrease in FA number when comparing 4-hour and respective 3-day time points in culture. The largest decrease in FA number was observed for parallel line feature topographies, which showed a 5-fold decrease over time in culture. In addition, the parallel line substrates were equivalent in number for FA formations as compared to glass control substrates after 4-hours in culture. However, all silk substrates showed a statistically significant (n = 7, p < 0.01) decrease in FA formation by day 3 in culture when compared to glass controls. Similar results were shown on glass substrates, however the FA number was reduced to a much lesser extent.
Western blots detecting actin, vinculin, and GAPDH controls were performed to investigate whether the observed effects of the various silk film surfaces on actin and vinculin localization were related to a difference in quantity of the proteins, or to an alteration in their distribution. It was shown that all proteins were produced at detectable levels for all surfaces and at both 4-hour and 3-day time points (Figure 9A–B). Analysis of densitometry measurements revealed actin/GAPDH ratios were consistent for all substrates at the 4-hour time point, and then at 3-days in culture there was a significant increase in actin/GAPDH ratios for all silk substrates, but not glass controls (Figure 9C). In addition, actin/GAPDH values were significantly reduced on glass surfaces when compared to flat and lined silk film surfaces, and on average this corresponded to a 34%–42% decrease on average. Vinculin/GAPDH ratios were found to significantly increase between the two sampling time points for all surfaces, with glass controls having the lowest change in expression on average (Figure 9D). Vinculin/actin ratios remained relatively consistent amongst all surfaces for both time points, with a significant increase for all substrates between time points (Figure 9E).
Figure 9.
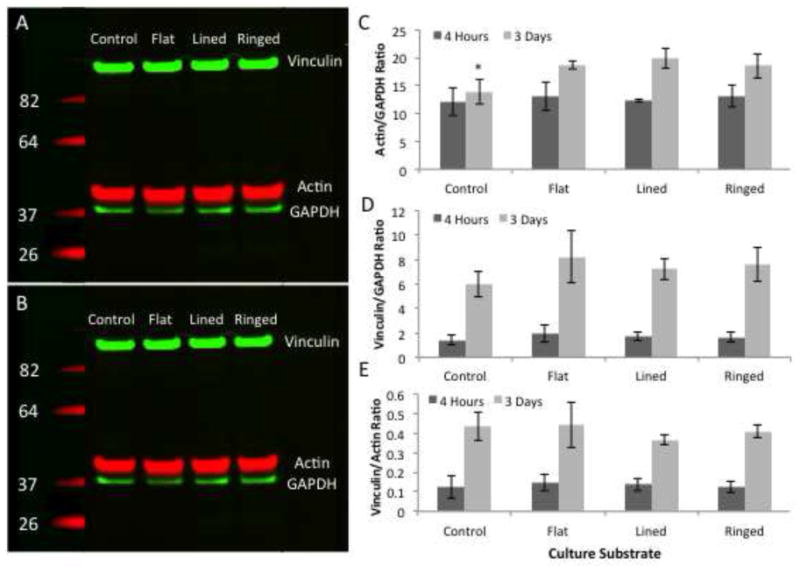
IR western blot results for actin, GAPDH, and vinculin proteins present in HCLE cells cultured upon the various silk and glass surfaces after (A) 4-hours and (B) 3-days in culture. Analysis of protein OD measurements ratios after 4-hours and 3-days in culture for (A) actin/GAPDH, (B) vinculin/GAPDH, and (C) vinculin/actin ratios (n = 3; error bars = standard deviation; * - indicates p < 0.05 when compared to control).
4. Discussion
Silk film surfaces can be patterned to produce micro to nano-topographic features that affect various aspects of cell function [13,32]. The influence of surface topography to affect corneal epithelial cell response has been previously shown to effect proliferation, migration, tissue development, and cell adhesion on silicon surfaces [19,21,33,34]. However, the use of silicon is not favorable for in vivo translation, fabrication of such materials requires a high level of expertise, and per sample production is relatively costly. Using patterned silk surfaces offers a number of advantages based on their biomaterial properties, and as a result of their straightforward and inexpensive production methods [9,25]. Therefore, silk films with both parallel line and concentric ring topographies were fabricated to assess cellular response to varying feature geometries and material surfaces. Such patterned silk surfaces have not been used as a culture substrate for a corneal epithelial cell type before.
HCLEs were able to attach and grow to confluency on both patterned and flat silk surfaces. Cell growth characteristics were similar overall between the various silk substrates, however overall cell number was less when compared to glass surfaces. After a week in culture silk surfaces possessed similar cell numbers as glass surfaces, and indicate that silk surfaces offer a viable substrate for cell expansion. These results may also indicate that silk film surface chemistry and not the presence of patterned surface topography may inhibit cell proliferation to some degree as previously demonstrated, however it is still unclear what is causing this effect [9]. Silk films with lined surface features appeared to demonstrate an enhanced characteristic of increasing initial cell adhesion when compared to other silk and glass surfaces. Such findings are not completely unexpected as previous results have been reported for corneal epithelium grown on patterned silicon surfaces [21,34]. This has largely been characterized as a result of increased attachment area presented to cells on patterned surfaces, and may enable enhanced cell binding to the surface [34]. However, similar initial attachment was not observed for concentric ring surfaces as would be expected if this was only a topographic effect, and may be related to the degree of patterned feature curvature. In addition, a significant decrease in cell spreading within the center region of concentric ring surfaces where the degree of feature curvature is the highest was also observed. Taken together, the presence of the surface pattern does not appear to have a significant effect on cell proliferation, however the feature geometry does appear to impact cells in respect to initial cell attachment and spreading. With increasing feature curvature there appears to be a negligible effect on initial cell attachment, while there is a significant reduction in cell spreading. Conversely, the presence of lined feature topography appears to increase initial cell attachment, while having a negligible effect on cell spreading. Feature curvature has been shown to affect cell responses such as proliferation, apoptosis, and differentiation [16,35], and further work is needed to assess feature curvature and initial cell adhesion characteristics.
The presence of the surface pattern produced significant differences in cell morphology, which is most likely due to topographic contact guidance [36–38]. In the above study, the most prominent changes occurred with cell body orientation and intercellular contact formation. HCLE cells tended to align with the patterned feature length axis. Additionally, the morphology of cell-to-cell contact formation was greatly affected by the presence of the pattern. Cell-to-cell contacts appeared to be more prominent upon the patterned culture substrates when compared to flat surfaces. In addition, gaps appeared between contact regions on the patterned silk surfaces, while found to not be present on the flat substrates. This result is not unexpected, as these cell contact gaps occur in the absence of a basal culture surface between patterned surface features. This effect illustrates the impact that patterned surfaces have on cell-to-cell interaction, and may have farther reaching implications for intercellular communication [40].
In addition to cell morphology and alignment, components of the cytoskeleton were also significantly influenced by the presence of the surface pattern. Actin fibrils, which are one of the primary components of the cytoskeleton, were found to highly align with the silk film’s surface topography. Contact guidance of actin fibril formation appeared to be directed along the length axis of the patterned features as shown in previous studies [41,42]. The control of actin fibrils directionality to induce cell alignment has been shown to have powerful implications in the development of tissue engineered constructs for the cornea [37]. In addition to fibril localization, analysis of the actin/GAPDH ratios from western blot results indicate that as the HCLE cells grow to confluency there is an increase in actin on silk film substrates when compared to glass controls surfaces. Equivalent ratio values were found on both flat and patterned silk surfaces, and these results may suggest that silk film material chemistry may be playing a role in cytoskeletal development as well and not based strongly on topography. Future work is needed to better elucidate how directionality of these fibrils is both determined and controlled mechanistically through the use of surface topography.
Previously, it was been shown that the presence of a feature edge surface provides an ‘optimal’ anchor location for FA complex formation [43]. The FA complex is a critical component in cellular signal transduction between the extracellular and intracellular environment by connecting integrin substrate anchoring proteins to the actin fibrils of the cytoskeleton [44]. Vinculin is an important protein component of the FA complex, which is thought to help stabilize this structure during and after formation [45]. The results above demonstrate that vinculin localization primarily occurs along the feature edge, and corresponded with actin fibril anchoring. Furthermore, this localizing effect was not impacted by feature edge geometry as both lined and ringed topographies demonstrated this characteristic. The prevalence of vinculin localization to the silk film feature edge may indicate that topographic edges expose cells to a greater amount of ‘attachable’ culture substrate regions. This hypothesis is supported by the fact that the addition of the patterned features introduces an increased density of edge lengths accessible to the adhering cells, while effectively reducing the culture surface by half. Increased presence of edge structures, and not increased surface area, may significantly drive the formation of vinculin along the feature edge. Once these surface anchor points are established the actin fibrils can polymerize from the feature edge surface, and as a result this may help to induce the observed contact guidance effect of cytoskeletal alignment. Further work should be undertaken to visualize the formation of the cytoskeleton in real time, which could provide answers to how contact guidance is induced upon a patterned substrate.
HCLE cells cultured upon silk film substrates tended to reduce vinculin localization while simultaneously increasing vinculin size over time. A similar effect was also witnessed upon glass surfaces, but to a lesser extent. Silk films as a culture substrate promoted increased vinculin area size when compared to glass substrates. Increased vinculin localization, as demonstrated on the silk film substrates above, have been shown to act as a scaffolding protein to support FA development and promote cell-to-surface attachment [45]. These results suggest that the silk substrates offer a favorable substrate for cell attachment, which may be enabled through enhanced FA development. However, the analysis of vinculin/GAPDH ratios from western blot results indicated that no increase in protein formation was induced by the presence of the silk film pattern, or the change in material substrate. These results may indicate that patterned feature edges appear to redistribute intracellular proteins, such as vinculin, by providing a localized assembly point during FA formation as opposed to inducing increased protein production. Analysis of additional FA proteins along with determination of cell-to-surface attachment forces may provide further understanding of how silk surface topography effects cell attachment.
5. Conclusions
Silk films are a novel class of biomaterials, which have the potential to be tailored for ophthalmic applications pertinent to ocular surface repair [17,18]. In the current study corneal epithelial in vitro interactions were assessed on patterned silk film surfaces. The response of an HCLE cell line to culture substrates with either parallel lines or concentric ring surface topographies were compared to flat silk and glass control surfaces. The effects that these patterned biomaterials have on initial cell-to-surface attachment and cytoskeletal development over time was explored. The results above taken together illustrate the various effects that silk surface topography may have on cultured HCLEs. The combined observations of direct effects on cell attachment, spreading, and cytoskeletal protein distribution illustrate a sample of parameters that may be controlled for by topography design.
Of particular interest is the finding that lined surface topographies increase initial cell attachment, while simultaneously increasing localization of vinculin and FA formation at the same time. This illustrates the fact that lined surface topographies may promote enhanced cell attachment through redistributing intracellular FA proteins to the feature edges. This redistributing effect may be driving subsequent actin alignment either through fibril formation from FA contacts or through another nondescript mechanism. It can be shown that feature geometry, such as with the added presence of curvature, is an important factor in surface design as demonstrated through the cell response upon concentric ring features. Concentric ring geometries did not enhance initial cell adhesion, promoted reduced cell spreading, and do not induce enhanced initial FA formation. Actin fibrils were found extending from the ringed feature edge and anchored at FA complexes. However, as somewhat expected the formed actin fibrils did not align with the curved features but instead crossed over various features especially in regions of high curvature. Interestingly, vinculin redistribution was still prevalent upon ringed feature edges, thus suggesting the importance of edge presence for guiding FA localization. The enhanced initial attachment of cells and increased FA number upon parallel lined features may correlate to the fact that such topography may promote actin alignment in their native direction, while ringed features do not and therefore may not enhance initial cell attachment or FA formation through not promoting fibril directional alignment. Additional studies will need to investigate the intracellular mechanistic relationships that the presence of the various surface topographies may have on actin fibril formation and alignment. Further work may build off these results in the development of silk film designer surfaces that promote an enhanced corneal epithelial cell response, such as epithelial cell adhesion, that could find use in the development of clinically relevant cell carrier surfaces or in the production of a tissue engineered cornea.
Acknowledgments
Funding for this work was from NIH K08EY015829, NIH R21EY019561, and NIH R24EY015656, Research to Prevent Blindness Career Development Award, Tri-Institutional Stem Cell Initiative, and the NIH P41 Tissue Engineering Resource Center. HCLE cell line provided courtesy of Dr. Ilene Gipson. Technical assistance and guidance from Dr. Cynthia Reinhart-King and Dr. Rob Ilic.
Footnotes
Publisher's Disclaimer: This is a PDF file of an unedited manuscript that has been accepted for publication. As a service to our customers we are providing this early version of the manuscript. The manuscript will undergo copyediting, typesetting, and review of the resulting proof before it is published in its final citable form. Please note that during the production process errors may be discovered which could affect the content, and all legal disclaimers that apply to the journal pertain.
References
- 1.Shear W, Palmer J, Coddington J, Bonamo P. A Devonian spinneret: early evidence of spiders and silk use. Science. 1989;246(4929):479. doi: 10.1126/science.246.4929.479. [DOI] [PubMed] [Google Scholar]
- 2.Shao Z, Vollrath F. Materials: Surprising strength of silkworm silk. Nature. 2002;418(6899):741. doi: 10.1038/418741a. [DOI] [PubMed] [Google Scholar]
- 3.Rockwood D, Preda RC, Yucel T, Wang X, Lovett ML, Kaplan DL. Materials Fabrication from Bombyx mori Silk Fibroin. Nature protocols. 2011 doi: 10.1038/nprot.2011.379. In press. [DOI] [PMC free article] [PubMed] [Google Scholar]
- 4.Jin H, Kaplan D. Mechanism of silk processing in insects and spiders. Nature. 2003;424(6952):1057–1061. doi: 10.1038/nature01809. [DOI] [PubMed] [Google Scholar]
- 5.Lawrence B, Omenetto F, Chui K, Kaplan D. Processing methods to control silk fibroin film biomaterial features. Journal of materials science. 2008;43(21):6967–6985. [Google Scholar]
- 6.Chen X, Li W, Yu T. Conformation transition of silk fibroin induced by blending chitosan. Journal of Polymer Science Part B: Polymer Physics. 1997;35(14):2293–2296. [Google Scholar]
- 7.Altman G, Diaz F, Jakuba C, Calabro T, Horan R, Chen J, et al. Silk-based biomaterials. Biomaterials. 2003;24(3):401–416. doi: 10.1016/s0142-9612(02)00353-8. [DOI] [PubMed] [Google Scholar]
- 8.Kluge J, Rabotyagova O, Leisk G, Kaplan D. Spider silks and their applications. Trends in biotechnology. 2008;26(5):244–251. doi: 10.1016/j.tibtech.2008.02.006. [DOI] [PubMed] [Google Scholar]
- 9.Lawrence B, Pan Z, Weber M, Kaplan D, Rosenblatt M. Silk Fibroin Film Culture System for In Vitro Analysis and Biomaterial Design. J Vis Exp. 2011:e3646. doi: 10.3791/3646. In press. [DOI] [PMC free article] [PubMed] [Google Scholar]
- 10.Meinel L, Hofmann S, Karageorgiou V, Kirker-Head C, McCool J, Gronowicz G, et al. The inflammatory responses to silk films in vitro and in vivo. Biomaterials. 2005;26(2):147–155. doi: 10.1016/j.biomaterials.2004.02.047. [DOI] [PubMed] [Google Scholar]
- 11.Omenetto F, Kaplan D. A new route for silk. Nature Photonics. 2008;2(11):641–643. [Google Scholar]
- 12.Lawrence B, Cronin-Golomb M, Georgakoudi I, Kaplan D, Omenetto F. Bioactive silk protein biomaterial systems for optical devices. Biomacromolecules. 2008;9(4):1214–1220. doi: 10.1021/bm701235f. [DOI] [PubMed] [Google Scholar]
- 13.Lawrence B, Marchant J, Pindrus M, Omenetto F, Kaplan D. Silk film biomaterials for cornea tissue engineering. Biomaterials. 2009;30(7):1299–1308. doi: 10.1016/j.biomaterials.2008.11.018. [DOI] [PMC free article] [PubMed] [Google Scholar]
- 14.Dunn G, Brown A. Alignment of fibroblasts on grooved surfaces described by a simple geometric transformation. J Cell Sci. 1986;83(313):40. doi: 10.1242/jcs.83.1.313. [DOI] [PubMed] [Google Scholar]
- 15.Karuri N, Nealey P, Murphy C, Albrecht R. Structural organization of the cytoskeleton in SV40 human corneal epithelial cells cultured on nano-and microscale grooves. Scanning. 2008;30(5):405–413. doi: 10.1002/sca.20123. [DOI] [PMC free article] [PubMed] [Google Scholar]
- 16.Chen C, Mrksich M, Huang S, Whitesides G, Ingber D. Geometric control of cell life and death. Science. 1997;276(5317):1425. doi: 10.1126/science.276.5317.1425. [DOI] [PubMed] [Google Scholar]
- 17.Harkin D, George K, Madden P, Schwab I. Silk fibroin in ocular tissue reconstruction. Biomaterials. 2011 doi: 10.1016/j.biomaterials.2010.12.041. [DOI] [PubMed] [Google Scholar]
- 18.Chirila T, Barnard Z, Harkin D, Schwab I, Hirst L. Bombyx mori silk fibroin membranes as potential substrata for epithelial constructs used in the management of ocular surface disorders. Tissue Engineering Part A. 2008;14(7):1203–1211. doi: 10.1089/ten.tea.2007.0224. [DOI] [PubMed] [Google Scholar]
- 19.Diehl K, Foley J, Nealey P, Murphy C. Nanoscale topography modulates corneal epithelial cell migration. Journal of Biomedical Materials Research Part A. 2005;75(3):603–611. doi: 10.1002/jbm.a.30467. [DOI] [PubMed] [Google Scholar]
- 20.Evans M, McFarland G, Taylor S, Walboomers X. The response of healing corneal epithelium to grooved polymer surfaces. Biomaterials. 2005;26(14):1703–1711. doi: 10.1016/j.biomaterials.2004.05.023. [DOI] [PubMed] [Google Scholar]
- 21.Karuri N, Porri T, Albrecht R, Murphy C, Nealey P. Nano-and microscale holes modulate cell-substrate adhesion, cytoskeletal organization, and-beta1 integrin localization in SV40 human corneal epithelial cells. IEEE transactions on nanobioscience. 2006;5(4):273. doi: 10.1109/tnb.2006.886570. [DOI] [PubMed] [Google Scholar]
- 22.Liliensiek S, Campbell S, Nealey P, Murphy C. The scale of substratum topographic features modulates proliferation of corneal epithelial cells and corneal fibroblasts. Journal of Biomedical Materials Research Part A. 2006;79(1):185–192. doi: 10.1002/jbm.a.30744. [DOI] [PMC free article] [PubMed] [Google Scholar]
- 23.XIA Y, Whitesides G. ChemInform Abstract: Soft Lithography. ChemInform. 1998;29(25) [Google Scholar]
- 24.Pease R. Imprints offer Moore. Nature. 2002;417(6891):802–803. doi: 10.1038/417802a. [DOI] [PubMed] [Google Scholar]
- 25.Jin H, Park J, Karageorgiou V, Kim U, Valluzzi R, Cebe P, et al. Water-Stable Silk Films with Reduced β-Sheet Content. Advanced Functional Materials. 2005;15(8):1241–1247. [Google Scholar]
- 26.Teixeira A, McKie G, Foley J, Bertics P, Nealey P, Murphy C. The effect of environmental factors on the response of human corneal epithelial cells to nanoscale substrate topography. Biomaterials. 2006;27(21):3945–3954. doi: 10.1016/j.biomaterials.2006.01.044. [DOI] [PMC free article] [PubMed] [Google Scholar]
- 27.Gipson I, Spurr-Michaud S, Argueso P, Tisdale A, Ng T, Russo C. Mucin gene expression in immortalized human corneal-limbal and conjunctival epithelial cell lines. INVESTIGATIVE OPHTHALMOLOGY & VISUAL SCIENCE. 2003;44(6):2496. doi: 10.1167/iovs.02-0851. [DOI] [PubMed] [Google Scholar]
- 28.Araujo J, Téran F, Oliveira R, Nour E, Montenegro M, Campos J, et al. Comparison of hexamethyldisilazane and critical point drying treatments for SEM analysis of anaerobic biofilms and granular sludge. Journal of electron microscopy. 2003;52(4):429. doi: 10.1093/jmicro/52.4.429. [DOI] [PubMed] [Google Scholar]
- 29.SMITH P, KROHN R, HERMANSON G, MALLIA A, GARTNER F, PROVENZANO M, et al. Measurement of protein using bicinchoninic acid. Analytical Biochemistry. 1985 Oct;150(1):76–85. doi: 10.1016/0003-2697(85)90442-7. [DOI] [PubMed] [Google Scholar]
- 30.Whitesides G. Massachusetts Institute of Technology Microsystems Technology Laboratories. Soft lithography Annu Rev Mater Sci. 1998 [Google Scholar]
- 31.Noordmans HJ, Smeulders AWM, van der Voort HTM. Fast volume render techniques for interactive analysis. The Visual Computer. 1997 Nov 18;13(8):345–358. [Google Scholar]
- 32.Gil E, Park S, Marchant J, Omenetto F, Kaplan D. Response of human corneal fibroblasts on silk film surface patterns. Macromolecular Bioscience. 2010;10(6):664–673. doi: 10.1002/mabi.200900452. [DOI] [PMC free article] [PubMed] [Google Scholar]
- 33.Karuri N, Liliensiek S, Teixeira A, Abrams G, Campbell S, Nealey P, et al. Biological length scale topography enhances cell-substratum adhesion of human corneal epithelial cells. Journal of cell science. 2004;117(Pt 15):3153. doi: 10.1242/jcs.01146. [DOI] [PMC free article] [PubMed] [Google Scholar]
- 34.Abrams G, Schaus S, Goodman S, Nealey P, Murphy C. Nanoscale topography of the corneal epithelial basement membrane and Descemet’s membrane of the human. Cornea. 2000;19(1):57. doi: 10.1097/00003226-200001000-00012. [DOI] [PubMed] [Google Scholar]
- 35.Kilian K, Bugarija B, Lahn B. Geometric cues for directing the differentiation of mesenchymal stem cells. Proceedings of the …. 2010 doi: 10.1073/pnas.0903269107. [DOI] [PMC free article] [PubMed] [Google Scholar]
- 36.Dunn G, Heath J. A new hypothesis of contact guidance in tissue cells* 1. Experimental Cell Research. 1976;101(1):1–14. doi: 10.1016/0014-4827(76)90405-5. [DOI] [PubMed] [Google Scholar]
- 37.Vrana E, Builles N, Hindie M, Damour O, Aydinli A, Hasirci V. Contact guidance enhances the quality of a tissue engineered corneal stroma. Journal of Biomedical Materials Research Part A. 2008;84(2):454–463. doi: 10.1002/jbm.a.31442. [DOI] [PubMed] [Google Scholar]
- 38.Rajnicek A, Foubister L, McCaig C. Alignment of corneal and lens epithelial cells by cooperative effects of substratum topography and DC electric fields. Biomaterials. 2008;29(13):2082–2095. doi: 10.1016/j.biomaterials.2008.01.015. [DOI] [PubMed] [Google Scholar]
- 39.Trepat X, Wasserman M, Angelini T, Millet E, Weitz D, Butler J, et al. Physical forces during collective cell migration. Nature Physics. 2009;5(6):426–430. [Google Scholar]
- 40.Wilson SE, Netto M, Ambrósio R., Jr Corneal cells: chatty in development, homeostasis, wound healing, and disease. American journal of ophthalmology. 2003 Sep;136(3):530–536. doi: 10.1016/s0002-9394(03)00085-0. [DOI] [PubMed] [Google Scholar]
- 41.Tocce EJ, Smirnov VK, Kibalov DS, Liliensiek SJ, Murphy CJ, Nealey PF. The ability of corneal epithelial cells to recognize high aspect ratio nanostructures. Biomaterials. 2010 May;31(14):4064–4072. doi: 10.1016/j.biomaterials.2010.01.101. [DOI] [PMC free article] [PubMed] [Google Scholar]
- 42.Meyle J, Gültig K, Brich M, Hämmerle H. Contact guidance of fibroblasts on biomaterial surfaces. Journal of Materials …. 1994 [Google Scholar]
- 43.Biggs M, Richards R, Dalby M. Nanotopographical modification: a regulator of cellular function through focal adhesions. Nanotechnology. 2010 doi: 10.1016/j.nano.2010.01.009. [DOI] [PMC free article] [PubMed] [Google Scholar]
- 44.Ingber D. Tensegrity II. How structural networks influence cellular information processing networks. Journal of cell science. 2003;116(8):1397–1408. doi: 10.1242/jcs.00360. [DOI] [PubMed] [Google Scholar]
- 45.Ziegler W, Liddington R. The structure and regulation of vinculin. Trends in cell biology. 2006 doi: 10.1016/j.tcb.2006.07.004. [DOI] [PubMed] [Google Scholar]
- 46.Gallant N, Capadona J, Frazier A, Collard D. Micropatterned surfaces to engineer focal adhesions for analysis of cell adhesion strengthening. Langmuir. 2002 [Google Scholar]
- 47.Connelly JT, Gautrot JE, Trappmann B, Tan DW-M, Donati G, Huck WTS, et al. Actin and serum response factor transduce physical cues from the microenvironment to regulate epidermal stem cell fate decisions. Nature Publishing Group. 2010 Jun 27;12(7):711–718. doi: 10.1038/ncb2074. [DOI] [PubMed] [Google Scholar]
- 48.Théry M, Pépin A, Dressaire E, Chen Y. Cell distribution of stress fibres in response to the geometry of the adhesive environment. Cell motility and the …. 2006 doi: 10.1002/cm.20126. [DOI] [PubMed] [Google Scholar]