Long-term (≈800-year) and short-term (≈20-year) estimates of the rate of deep water formation in the Southern Ocean are in serious disagreement. This disagreement suggests to me that the rate of deep water formation may have been larger during the Little Ice Age (LIA) than it is now.
Based on studies of ice-rafted debris in northern Atlantic sediments, a strong case (1) has been made that a cycle averaging about 1,500 years in duration punctuated the climate in this region both during the Holocene and during the last interglacial period. This finding reinforces the earlier suggestion of a 2,000-year cycle (2) based on CaCO3 measurements in a high accumulation rate core raised off Bermuda. Because the frequency of these cycles is about the same as that for the much larger (and hence more famous) Dansgaard–Oeschger cycles of glacial time, the possibility has been raised (1) that both the glacial and the interglacial cycles share a common causal factor. Because a considerable amount of circumstantial evidence suggests that the Dansgaard–Oeschger cycles are linked to a seesawing of deep water formation between the Northern Atlantic and the Southern Ocean (3, 4), it has been suggested further (1) that perhaps the weaker interglacial cycles may also be driven by alternations in the mode of deep water formation. In addition, the LIA, well recorded in the region around the Northern Atlantic, was the most recent of this series of cold pulses (1). An extension of this logic would then suggest that a change in thermohaline circulation accompanied the LIA.
Before providing evidence that indeed such a change may well have occurred, it is appropriate to review what is known about the magnitude and global distribution of the impact of the LIA. The most reliable source of information comes from reconstructions of the elevations of mountain snowlines (5). Herein, I focus on the last gasp of the LIA, that is, the mid to late 1800s. The reason is that the records are reasonably complete for its final phase—unlike the record for earlier LIA phases, which are quite spotty. Trees that grew on abandoned LIA moraines record the time of the onset of the retreat, which marked the end of this 500-year cold snap.
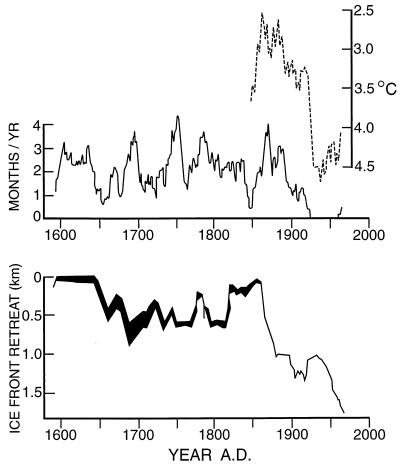
Also, by the late 1800s, geologists and geographers had reached even the most remote parts of the world and mapped the extent of mountain glaciers (see Fig. 1 for an example). The bottom line is that, in both the north and the south temperate zones of our planet, snowlines (that is, the boundaries separating zones of net accumulation from those of net ablation) were about 100 m lower than they were in 1975. This difference is comparable to a snowline lowering of 900 to 950 m during full glacial time and to a roughly 350-m lowering during the Younger Dryas (Y.D.). Because the major factor influencing these elevations is air temperature, the suggestion is that, during all three of these cold intervals, the cooling was symmetrical about the equator. Based on present-day lapse rates, the mountain cooling during glacial time was about 5.5°C and that during the LIA was about 0.6°C.
Figure 1.
Historic climate records extending back to A.D. 1600. (Upper) A record of the number of months per year sea ice was present around Iceland and its relationship to mean annual temperature available since A.D. 1850 (6). (Lower) The extent of the front of the Grindelwald Glacier as reconstructed from oil paintings, drawings, prints, photos, maps, and literature (7).
In addition to the snowline record, there is historical evidence, which extends back to about A.D. 1600, that the Northern Atlantic had greater ice cover during the LIA. This record (Fig. 1) shows that from 1650 to 1890 Iceland was surrounded by sea ice for an average of 2 months per year. During the present century, a dramatic decrease in sea ice occurred. By 1920, the waters around Iceland were free of sea ice for the entire year. Of course, the finding (1) that the deposition of ice-rafted debris in the region west of Iceland was greater during the LIA is consistent with these historic records.
Clearly then, the LIA, although much smaller in amplitude, shared the geographic pattern of Y.D. and the main glacial maximum. However, the big question is whether this agreement extends to an antiphased warming in the Antarctic region. This idea is key to the bipolar seesaw (see Appendix). There is only one piece of evidence I know of that bears on this question. A deconvolution of the down hole temperature record at the Taylor Dome Antarctica ice-core site has been conducted (G. Clow, personal communication). Preliminary results suggest that during the LIA the air temperature warmed by 3°C. Although, admittedly, the Taylor Dome 18O record for the deglacial interval is anomalous compared with that for the other Antarctic ice cores (8), this result is tantalizing and certainly points to the importance of obtaining high quality thermal records at other Antarctic ice-core sites. If these temperature reconstructions were to be confirmed, the LIA warming in Antarctica would certainly be the smoking gun with regard to the involvement of thermohaline circulation.
Even so, this evidence is, by its very nature, circumstantial. Is there any more direct evidence that suggests that thermohaline circulation during the last century differs substantially from that during the LIA? The answer to this question is yes; there is evidence regarding the nature of this circulation for two quite different time scales (3, 12). As the renewal time of the deep Pacific and Indian Oceans is on the order of 800 years, the properties of these waters integrate from times before the LIA all the way to the present. By contrast, the distribution of anthropogenic tracers such as chlorofluorocarbon-11 (CFC-11) constrain the magnitude of the production of deep water over the last 2 decades. As is outlined below, when taken together, these two sets of data strongly suggest that the rate of formation of ventilated deep water in the Southern Ocean has been several times lower during the “Freon era” (i.e., the last few decades) than on the average over the last ocean-mixing cycle.
First, I will consider the long-term situation. In almost all studies of thermohaline circulation, the properties of the deep sea are taken to represent a steady-state circulation. To test whether this assumption is fair, the distributions of three properties in the deep sea have been analyzed, specifically, the concentrations of dissolved oxygen, the concentration of dissolved phosphate, and the 14C/C in dissolved inorganic carbon (3). By combining the PO4 and O2 results, a quasiconservative property, PO4*, is obtained. PO4* allows the assessment of the fraction of the water in the deep Pacific and Indian Oceans that originated in the Northern Atlantic and the fraction that originated in the Southern Ocean (9). PO4* is calculated as follows: PO4* = PO4 + O2/175 − 1.95 μmol/kg, where 175 is the global ocean ratio of O2 consumed to PO4 released during respiration and 1.95 is an arbitrary constant. Although the deep waters generated in both of these source regions have O2 contents on the order of 310 μmol/kg, they differ greatly in PO4 content. Those in the Northern Atlantic average ≈0.9 μmol/kg, and those adjacent to the margin of the Antarctic continent average ≈2.1 μmol/kg. The resulting PO4* values are 0.73 ± 0.04 for new deep waters formed in the North and 1.95 ± 0.05 for deep waters formed in the Southern Ocean. The PO4* values for the waters north of 40°S and deeper than 1,500 m in the Pacific and Indian Ocean are quite uniform and cluster in a narrow range around an average of 1.38 μmol/kg (10). This uniformity suggests that they are a mixture consisting of 53% southern source water and 47% northern source water. As both of these source waters flow into the rapidly circulating circum-Antarctic ring current, they become well mixed before moving northward into the deep Pacific and Indian Oceans. Thus, the above inventory ratio should reflect the production ratio of these two water types.
The ratio of 14C to C in the dissolved inorganic carbon allows the actual production rate of these two end members to be constrained. I have (10) analyzed the radiocarbon budget in a number of ways. All are consistent with a total production rate of 30 ± 6 Sverdrups (that is, 106 m3/s) or roughly 15 Sverdrups in each of the two source regions.
An inversion scheme has been developed (11) that is designed to match simultaneously four properties of the deep sea water (potential temperature, salinity, PO4*, and 14C/C). The conclusions of this study are consistent with the above; namely, nearly equal amounts of ventilated deep water must be produced in the two major source regions, and the total production must be on the order of 30 Sverdrups.
However, a problem emerged. Studies conducted in the Weddell Sea—to which physical oceanographers looked as the main site for deep water production in the Southern Ocean—all reached similar conclusions, that is, that the total production of ventilated deep water was on the order of 2–5 Sverdrups (see ref. 3 for a summary of this evidence). In ref. 3, I leaned toward the explanation that major amounts of deep water must be forming at other sites around the margin of the Antarctic continent. Analysis of the then-available CFC-11 results (3), to see whether the deep Southern Ocean inventory supported the multiple source hypothesis, yielded results that were ambiguous (aerial coverage of CFC-11 measurements was not adequate at that time).
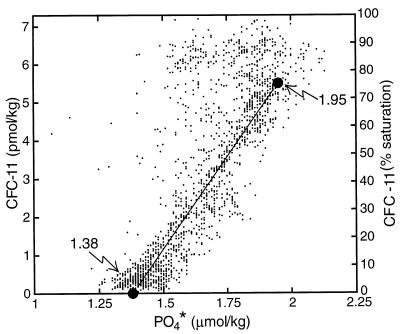
Based on the results from the World Ocean Circulation Experiment survey in the Southern Ocean, a complete inventory of the amount of CFC-11 in the dense bottom waters in the Southern Ocean has been compiled (12). If it is assumed, as both O2 and CFC measurements suggest, that the newly ventilated waters achieve ≈75% saturation with atmospheric gases (Fig. 2), then the inventory in ref. 12 translates to an average of only 4 Sverdrups of Southern Ocean deep water formation during the last 2 decades. If this result stands the test of time, then clearly the formation rate of ventilated deep water in the Southern Ocean is currently several times smaller than its average for the last deep ocean-mixing cycle (that is, ≈800 years).
Figure 2.
Plot of CFC-11 concentration as a function of PO4* for waters south of 40°S from depths less than 500 m and with temperatures less than 3°C. As can be seen, many of the points scatter around a mixing line joining the compositions of CFC-11 free water with a PO4* value of 1.38 μmol/kg (characteristic of upwelling circumpolar deep water) and water with a PO4* value of 1.95 μmol/kg (characteristic of newly forming deep water). As can be seen, this water is about 75% saturated with CFC-11.
At this point, one might ask whether the CFC-11 inventory of Northern Atlantic waters is consistent with a ventilation rate of 15 Sverdrups during the last 2 decades. Such an inventory has been generated (W. Smethie, personal communication) and reveals that the new deep water is forming somewhat more slowly than expected. However, because CFC-11 has spread over a very large portion of the North Atlantic, the existing surveys do not provide enough coverage to allow a firm answer to be given.
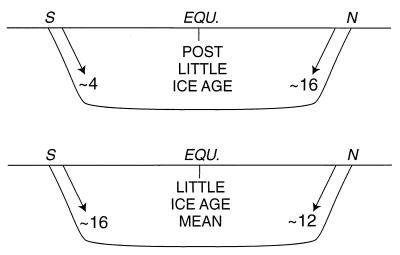
Although the evidence in hand is surely consistent with a reduction in deep water formation during the LIA (Fig. 3), clearly other explanations must be considered. For example, perhaps deep water production in the Southern Ocean is episodic on a multidecadal time scale, and no such episode has occurred during the period when observations are available. Or perhaps global warming has already taken its toll on deep water formation in the Southern Ocean. Although I favor the LIA explanation, this early in the game, there is no way to rule out others.
Figure 3.
Ventilation rate scenario designed to account for both the global distribution of PO4* and 14C and for the current inventories of CFCs in the deep Northern Atlantic Ocean and the deep Southern Ocean. The units are Sverdrups (i.e., 106 m3/s).
Perhaps the greatest weakness in the LIA explanation is the failure of the patterns of distribution of properties in the deep sea to provide a hint that a change has occurred. It is generally accepted that the distributions of temperature, salinity, nutrient constituents, and radiocarbon are interpreted as reflecting a steady state. There seems to be no evidence for a reduction of the PO4* value in Southern Ocean deep water, which should be developing if the inflow of new high-PO4* water has been reduced during the last 100 years (13). Further, only recently have studies of sediments with high enough sedimentation rates to preserve evidence for LIA changes been undertaken. Studies of the abyssal tongue of Antarctic Bottom Water, which extends into the western basin of the North Atlantic (L. Keigwin, personal communication), hint at a LIA strengthening but as yet have yielded no definitive evidence.
Although we have a long way to go before we will be able to get to the bottom of this apparent dilemma, the following must be done to clarify the situation. (i) To define the CFC-11 constraint more precisely, measurements of the extent of saturation must be made on newly formed deep water in both polar regions. (ii) Surveys of temperature and salinity in the deep Atlantic Ocean made in the 1930s must be carefully compared with recent ones in search for evidence of a shift in the position of the boundary separating the Antarctic bottom water tongue from the overlying North Atlantic deep water. (iii) Studies must be made of rapidly accumulating sediments along the path of the lower limb of the Atlantic's conveyor in a search for sedimentary anomalies associated with the LIA (see ref. 14, this issue of PNAS). (iv) More temperature profiles must be obtained from deep holes drilled in Antarctic ice to confirm the existence of the LIA warm anomaly (G. Clow, personal communication).
One aspect of the debate with regard to the extent of global warming generated by the ongoing buildup of greenhouse gases has to do with the contribution of natural climate change. Those opposed to emission restrictions are quick to conclude that the warming during the past century may be dominated by the relaxation of cold LIA conditions. Although we are still a long way from being able to assess whether or not this interpretion is correct, were thermohaline circulation to be implicated, a step toward this goal would be taken.
The Bipolar Seesaw.
The evidence for the antiphasing of the millennial-duration climate changes occurring on the Antarctic continent compared with those elsewhere on the planet comes from the correlation of the oxygen isotope records for the Antarctic Byrd and the Greenland GISP2 ice cores (15–17). This antiphasing is clearly seen in the deglaciation interval (≈20,000 to ≈10,000 calendar years ago). During the first half of this period, Antarctica steadily warmed, but little change occurred in Greenland. Then, at the time when Greenland's climate underwent an abrupt warming, the warming in Antarctica stalled. Finally, at the onset of the Y.D. cold event in Greenland, the Antarctica warming resumed.
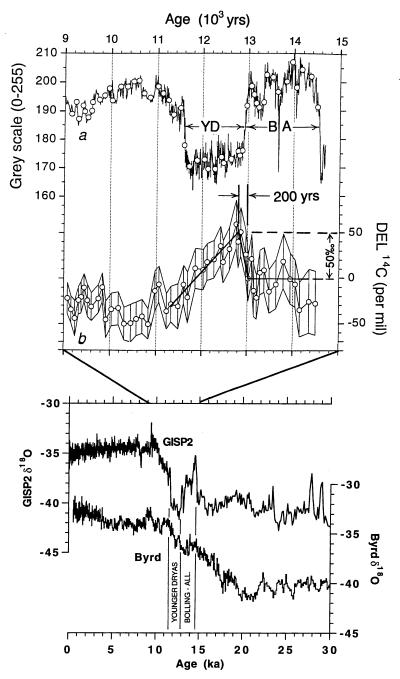
The strongest support for the idea that the antiphasing of climate oscillations during the period of deglaciation was tied to changes in thermohaline circulation comes from the temporal record of 14C/C in atmospheric CO2 and upper ocean CO2. A number of records for the Y.D. reveal a curious anomaly. It involves rapid decrease in radiocarbon age from 11,100 to 10,500 radiocarbon years (relative to calendar ages) during the first 20% of the 1,200-year-long Y.D. interval followed by what seems to be a much too slow rate of decrease from 10,500 to 10,000 years during the remaining 80% of the Y.D. This result suggests that, early in the Y.D., the 14C/C ratio of the atmosphere/upper ocean reservoir increased, and then, during the remainder of the Y.D., it dropped back down. However, because in these records there was no assurance that this pattern was not instead a product of slower deposition rates early in the Y.D. followed by faster deposition rates, a convincing case awaited the study of an annually layered sedimentary sequence in which the boundaries of the Y.D. were clearly defined. Such a sequence was found in the deep Cariaco Basin, which lies between Venezuela and the Dutch ABC Islands (18). Not only are these sediments varved, but their color is significantly lighter during the Y.D. interval. By counting the layers and carrying out several dozen radiocarbon ages on planktonic foraminifera contained in this sediment, it was possible (18) not only to confirm that the radiocarbon pattern was due to changing 14C/C ratio in the atmosphere/upper ocean reservoir but also to quantify the magnitude and timing of these changes. These results show that, during the first 200 years of the Y.D., the 14C/C ratio in surface waters of the Cariaco trench rose by 5% and that they then coasted back down again during the remainder of the Y.D. (Fig. 4). These 14C to C ratio changes could have been brought about either by changes in the production rate of 14C or by changes in the rate of mixing between the upper ocean and deep ocean CO2 reservoirs. However, because the 14C increase starts right at the onset of the Y.D. and because the rate of rise is too steep to be explained by an increase in the production rate of 14C, the changes in 14C to C ratio that occurred during the Y.D. are almost certainly due to redistribution of 14C. As in today's world ocean, about three-quarters of the radiocarbon reaching the vast deep ocean carbon reservoir does so along with the new deep waters formed in the Northern Atlantic; were this loop in the deep ocean's ventilation system to be shut down, the 14C atoms produced by cosmic ray bombardment would be backlogged in the atmosphere/upper ocean reservoir. Hence, such a shutdown would not only explain the dramatic Y.D. cooling experienced in northern Europe but also the steep rise in the 14C content of atmospheric CO2 and upper ocean CO2.
Figure 4.
(Upper) Cariaco Trench record for the Bolling-Allerod (BA) and Younger Dryas interval (18). DEL 14C is the deviation of the recontructed initial 14C/C from the long-term mean. (Lower) 18O records for the Greenland Ice Science Project (GISP2) and the Byrd Station Antarctica ice cores (15–17). The time scale is in thousands of years before present (ka).
But why did this shutdown last only 200 years? The answer is that, as deep ocean waters are being continually dedensified by the downward mixing of the warmer overlying water, a point must be reached at which, somewhere on the planet, waters at the surface became more dense than those resident in the abyss. At this point, deep ventilation would be initiated. Had this start-up occurred in the Northern Atlantic, then one might expect that the profound Y.D. cooling therein would have been ameliorated. As there is no evidence that such an amelioration happened, we must look elsewhere on the globe. The logical candidate is the Southern Ocean, because the change in circulation there could be called on to supply the heat required to propel the warming of the Antarctic continent. Hence, the idea of the bipolar seesaw (3, 4).
References
- 1.Bond G, Showers W, Cheseby M, Lotti R, Hajdas I, Bonani G. Science. 1997;278:1257–1266. [Google Scholar]
- 2.Keigwin L D, Jones G A. Deep-Sea Res. 1989;36:845–867. [Google Scholar]
- 3.Broecker W S. Paleoceanography. 1998;13:119–121. [Google Scholar]
- 4.Stocker T F. Science. 1998;282:61–62. [Google Scholar]
- 5.Grove J M. The Little Ice Age. New York: Methuen; 1988. [Google Scholar]
- 6.Bergthórsson P. Jàkull. 1969;19:94–101. [Google Scholar]
- 7.Messerli B, Messerli P, Pfister C, Zumbühl H J. Arct Alp Res. 1978;10:247–260. [Google Scholar]
- 8.Steig E J, Brook E J, White J W C, Sucher C M, Bender M L, Lehman S J, Morse D L, Waddington E D, Clow G D. Science. 1998;282:92–95. doi: 10.1126/science.282.5386.92. [DOI] [PubMed] [Google Scholar]
- 9.Broecker W S, Peacock S, Walker S, Weiss R, Fahrbach E, Schroeder M, Mikolajewicz U, Heinze C, Key R, Peng T-H, et al. J Geophys Res. 1998;103:15833–15843. [Google Scholar]
- 10.Broecker W S. Oceanography. 1991;4:79–89. [Google Scholar]
- 11.Peacock S, Visbeck M, Broecker W. Inverse Methods in Global Biogeochemical Cycles. 2000. , Geophysical Monograph Series, eds. Kasibhatla, P., Heimann, M., Rayner, P., Mahowald, N., Prinn, R. G. & Hartley, D. E. (Am. Geophys. Union, Washington, DC), Vol. 114, in press. [Google Scholar]
- 12.Orsi A H, Johnson G C, Bullister J L. Progr Oceanogr. 1999;43:55–109. [Google Scholar]
- 13.Broecker W S. Science. 1999;286:1132–1135. doi: 10.1126/science.286.5442.1132. [DOI] [PubMed] [Google Scholar]
- 14.Keigwin L D, Boyle E A. Proc Natl Acad Sci USA. 2000;97:1339–1342. doi: 10.1073/pnas.97.4.1343. [DOI] [PMC free article] [PubMed] [Google Scholar]
- 15.Bender M, Sowers T, Dickson M, Orchardo J, Grootes P, Mayewski P A, Meese D A. Nature (London) 1994;372:663–666. [Google Scholar]
- 16.Jouzel J, Vaikmae R, Petit J R, Martin M, Duclos Y, Stievenard M, Lorius C, Toots M, Melieres M A, Burckle L H, et al. Clim Dyn. 1995;11:151–161. [Google Scholar]
- 17.Blunier T, Schwander J, Stauffer B, Stocker T, Dällenbach A, Indermühle A, Chappellaz J, Raynaud D, Barnola J-M. Geophys Res Lett. 1997;24:2683–2686. [Google Scholar]
- 18.Hughen K A, Overpeck J T, Lehman S J, Kashgarian M, Southon J, Peterson L C, Alley R, Sigman D M. Nature (London) 1998;391:65–68. [Google Scholar]


