

Abstract
During prolonged intervals of wakefulness, brain adenosine levels rise within the basal forebrain and cortex. The view that adenosine promotes sleep is supported by the corollary that N-methylated xanthines such as caffeine increase brain and behavioral arousal by blocking adenosine receptors. The four subtypes of adenosine receptors are distributed heterogeneously throughout the brain, yet the neurotransmitter systems and brain regions through which adenosine receptor blockade causes arousal are incompletely understood. This study tested the hypothesis that adenosine A1 and A2A receptors in the prefrontal cortex contribute to the regulation of behavioral and cortical arousal. Dependent measures included acetylcholine (ACh) release in the prefrontal cortex, cortical electroencephalographic (EEG) power, and time to waking after anesthesia. Sleep and wakefulness were also quantified after microinjecting an adenosine A1 receptor antagonist into the prefrontal cortex. The results showed that adenosine A1 and A2A receptors in the prefrontal cortex modulate cortical ACh release, behavioral arousal, EEG delta power, and sleep. Additional dual microdialysis studies revealed that ACh release in the pontine reticular formation is significantly altered by dialysis delivery of adenosine receptor agonists and antagonists to the prefrontal cortex. These data, and early brain transection studies demonstrating that the forebrain is not needed for sleep cycle generation, suggest that the prefrontal cortex modulates EEG and behavioral arousal via descending input to the pontine brainstem. The results provide novel evidence that adenosine A1 receptors within the prefrontal cortex comprise part of a descending system that inhibits wakefulness.
Keywords: microdialysis, EEG, anesthesia, C57BL/6J mouse, sleep, microinjection
Introduction
States of electroencephalographic (EEG) and behavioral arousal are modulated by adenosinergic and cholinergic neurotransmission (Steriade and McCarley, 2005). During prolonged intervals of wakefulness, adenosine levels increase within the basal forebrain and cortex (Benington et al., 1995; Huston et al., 1996; Porkka-Heiskanen et al., 1997, 2000; Radulovacki, 2005). This rise in adenosine levels inhibits subcortical cholinergic neurons known to promote arousal (Porkka-Heiskanen et al., 2002; Basheer et al., 2004). Caffeine, the most widely used psychoactive drug (Fredholm et al., 1999), is an adenosine A1 and A2A receptor antagonist, but the mechanisms through which caffeine promotes behavioral arousal are incompletely understood.
There is good agreement that adenosine A1 and A2A receptors in the brainstem of mouse (Coleman et al., 2006), rat (Marks et al., 2003), and cat (Tanase et al., 2003) contribute to the regulation of arousal. The finding that systemically administered caffeine increased wakefulness in adenosine A1 but not A2A receptor knock-out mice was interpreted to demonstrate that caffeine promotes wakefulness by antagonizing adenosine A2A but not A1 receptors (Huang et al., 2005). No studies have determined whether cortical adenosine A1 and/or A2A receptors modulate arousal in wild-type mice.
The prefrontal cortex contributes to arousal state control in humans (Muzur et al., 2002) and modulates EEG activation in C57BL/6J (B6) mouse (Douglas et al., 2002). In humans, sleep deprivation increases adenosine A1 receptor binding in the frontal cortex (Elmenhorst et al., 2007). The present study tested the hypothesis that adenosine A1 and A2A receptors in the prefrontal cortex of B6 mouse modulate multiple measures of arousal, including cortical acetylcholine (ACh) release, behavioral arousal, EEG delta power, sleep, and pontine reticular formation ACh release. Adenosine A1 and A2A receptor agonists and antagonists were delivered by microdialysis to the prefrontal cortex while measuring prefrontal cortex ACh release, EEG delta power, and time required to resume wakefulness after anesthesia. Additional studies determined whether microinjecting an adenosine A1 receptor antagonist into the prefrontal cortex increases wakefulness and decreases sleep.
Pioneering studies (Jouvet, 1962) revealed that rhythmic oscillations between the physiological signs of non-rapid eye movement (NREM) sleep and rapid eye movement (REM) sleep persist after surgical transection that separated the forebrain and pons. Although the forebrain is not necessary for generating the ultradian rhythm of REM and NREM sleep, the initial findings of the present study imply that the prefrontal cortex modulates states of sleep and wakefulness via descending input to the pontine brainstem. Therefore, a final series of experiments used dual microdialysis to determine whether ACh release in the pontine reticular formation is significantly altered by dialysis delivery of adenosine agonists and antagonists to the prefrontal cortex.
Materials and Methods
Overview of experiment design.
All experiments adhered to the Public Health Service Policy on Humane Use and Care of Laboratory Animals (NIH Publication 80-23, National Academy of Sciences Press, Washington, DC, 1996) and were reviewed and approved by the University of Michigan Committee on Use and Care of Animals. Experiments used adult male B6 mice (n = 113; The Jackson Laboratory). Mice had ad libitum access to food and water. Each mouse was used for only one dialysis experiment, and only one drug concentration was tested per mouse.
The time course of the dialysis experiments and collection and quantification of ACh from the frontal association area (FrA) is schematized by Figure 1A. The FrA is the mouse homolog of the prefrontal cortex (Fuster, 2001). These studies measured prefrontal cortex ACh release during isoflurane anesthesia. Control ACh release was determined during dialysis with Ringer's before dialysis delivery of adenosine A1 and A2A receptor agonists and antagonists. An additional dependent measure included the time (in minutes) required for resumption of righting after offset of isoflurane anesthesia. A second set of experiments conducted during isoflurane anesthesia recorded the cortical EEG while measuring prefrontal cortex ACh release and time to waking after anesthesia. The dependent measures of time to waking after anesthesia (Tung et al., 2002, 2005), ACh release in the prefrontal cortex (Kozak et al., 2006), and decreased EEG delta power (Douglas et al., 2002) are accepted indicators of behavioral arousal. A third set of experiments was conducted using intact, unanesthetized mice implanted with a guide tube aimed for the prefrontal cortex and with EEG and electromyographic (EMG) electrodes, making it possible to microinject drugs into the prefrontal cortex and record states of wakefulness, NREM sleep, and REM sleep. The final series of experiments used dual microdialysis in isoflurane anesthetized mice and followed a design similar to that outlined in Figure 1A. One dialysis probe was placed in the prefrontal cortex for drug delivery and one probe placed in the pontine reticular formation for collecting ACh. The pontine reticular formation is comprised of the pontine reticular nucleus, oral part (PnO) and caudal part (PnC) (Paxinos and Franklin, 2001).
Figure 1.

Study design. A, Schematic timeline of microdialysis experiments. The top row outlines the experimental manipulations, and the bottom row indicates when the dependent measures were obtained. B, The coronal diagram modified from a mouse brain atlas (Paxinos and Franklin, 2001) illustrates placement of a microdialysis probe in the frontal association area (FrA) (2.96 mm anterior to bregma), mouse homolog of the prefrontal cortex (Fuster, 2001). The dialysis probe membrane (1 mm length, 0.24 mm diameter) is drawn to scale. EEG recording electrodes are schematized above the contralateral prefrontal cortex and were placed at stereotaxic coordinates 2.8 mm anterior to bregma and 2.4 mm posterior to bregma. C, The representative chromatogram shows an acetylcholine (ACh) peak obtained by microdialysis of the prefrontal cortex. D, Time course of prefrontal cortex ACh release from a representative experiment in which six sequential samples were collected during control dialysis with Ringer's (hatched bars) followed by six samples collected during dialysis with CGS (10 μm) (solid bars). Each bar represents 1 ACh sample from the same mouse.
Surgical preparation, microdialysis, drug concentrations, and HPLC with electrochemical detection.
Mice were anesthetized with 2.0% isoflurane in O2 and placed in a Kopf Model 962 small animal stereotaxic instrument with a Kopf Model 923-B mouse anesthesia mask (David Kopf Instruments). Delivered isoflurane concentration was measured using a Cardiocap/5 monitor (Datex-Ohmeda) and decreased to 1.6% for surgery. Core body temperature was monitored and held constant between 36.5 and 37.5°C throughout the experiment. A skull craniotomy of 1 mm diameter was made at stereotaxic coordinates 3.0 mm anterior to bregma and 1.6 mm lateral to the midline (Paxinos and Franklin, 2001) for placement of a CMA/7 dialysis probe (6 kDa cutoff; 1.0 mm length, 0.24 mm diameter cuprophane membrane; CMA/Microdialysis) in the prefrontal cortex (Fig. 1B). For experiments using two microdialysis probes per mouse, a second craniotomy was made at 4.72 mm posterior to bregma and 0.7 mm lateral to the midline (Paxinos and Franklin, 2001). After completing the craniotomies, delivered isoflurane concentration was reduced and maintained at 1.3%, corresponding to the EC50 or minimum alveolar concentration for B6 mouse (Sonner et al., 1999).
The microdialysis probes were perfused continuously (2 μl/min) with Ringer's solution (vehicle control) comprised of 147 mm NaCl, 2.4 mm CaCl2, 4 mm KCl, and 10 μm neostigmine. Salts used in the Ringer's solution were purchased from Fisher Scientific. Drugs delivered to the prefrontal cortex by microdialysis while measuring ACh in the prefrontal cortex included the adenosine A2A receptor agonist 2-p-(2-carboxyethyl)phenethylamino-5′-N-ethylcarboxamidoadenosine hydrochloride [CGS 21680 (CGS)], the adenosine A2A receptor antagonist 4-(2-[7-amino-2-(2-furyl)[1,2,4]triazolo[2,3-a][1,3,5]triazin-5-ylamino]ethyl)phenol [ZM 241385 (ZM)], the adenosine A1 receptor agonist N6-p-sulfophenyladenosine sodium salt (SPA), and the adenosine A1 receptor antagonist 8-cyclopentyl-1,3-dipropylxanthine (DPCPX). Prefrontal cortex ACh was also measured before and during dialysis delivery of the adenosine receptor antagonist caffeine. Dual dialysis experiments consisted of delivering CGS, SPA, caffeine, and DPCPX to the prefrontal cortex while measuring ACh release in the pontine reticular formation.
DPCPX and ZM were dissolved in dimethylsulfoxide (DMSO) and diluted in Ringer's to a final DMSO concentration of 1.0% and 0.07%, respectively. SPA, CGS, DPCPX, caffeine, and neostigmine bromide were obtained from Sigma-Aldrich. ZM was purchased from Tocris.
CMA/7 dialysis membranes, at a flow rate of 2 μl/min, were estimated to deliver ∼5% of the drug concentration used to perfuse the dialysis probe. This estimate was based on direct measurement of ACh recovery by the dialysis membrane. Each dialysis probe was placed into a known concentration of ACh and the amount of ACh recovered by the probe was quantified. The mean ± SEM in vitro recovery of the probes used for the present experiments was 5.09 ± 0.09%. This number agrees with probe recoveries of 5.85 ± 0.35% from previous microdialysis studies in B6 mice (Coleman et al., 2006). Thus, estimated drug concentrations that significantly changed the dependent measures ranged from 500 nm to 50 μm. A detailed review of the factors that affect microdialysis drug delivery has been published previously (Watson et al., 2006).
The concentrations of the adenosine A2A receptor agonist CGS and antagonist ZM were based on a microdialysis study in mouse pontine reticular formation where dialysis with 3 μm CGS caused a significant increase in ACh release and dialysis with 0.03 μm ZM blocked the CGS-induced increase in ACh release (Coleman et al., 2006). The concentrations of the adenosine A1 receptor agonist SPA and antagonist DPCPX were based on a microdialysis study in cat pontine reticular formation where dialysis with 8.8 mm SPA caused a significant decrease in ACh release and dialysis with 100 μm DPCPX blocked the SPA-induced decrease in ACh release (Tanase et al., 2003).
The concentrations of caffeine used in the present study were based on studies that delivered caffeine to the brain by microdialysis (Okada et al., 1996, 1997; Carter, 1997; Alaraj et al., 1998; Materi et al., 2000; Materi and Semba, 2001). For the present experiments, the caffeine concentrations delivered to the microdialysis probe included 1, 10, 100, and 1000 μm. Based on estimates of 5% drug delivery through the dialysis membrane, caffeine concentrations delivered to the brain ranged from 0.05 to 50 μm. The affinity of caffeine is ∼55 μm for adenosine A1 receptors and ∼50 μm for adenosine A2 receptors (Daly et al., 1986). These affinities indicate that the concentrations of caffeine used in the present study elicited receptor specific effects.
Each mouse was used for only one dialysis experiment. Only one concentration of a single drug or only one agonist plus antagonist combination was tested per mouse. A CMA/110 liquid switch was used to dialyze with Ringer's followed by Ringer's containing drug. Dialysis samples were collected every 12.5 min. Six samples were collected during dialysis with Ringer's (control), and then six samples were collected during dialysis with drug (Fig. 1D). Each 25 μl dialysis sample was injected into an HPLC system (Bioanalytical Systems). The sample was carried through the system in 50 mm Na2HPO4 mobile phase, pH 8.5, at a flow rate of 1 ml/min. ACh and choline were separated by an analytical column and then broken down into hydrogen peroxide by an immobilized enzyme reactor column. The hydrogen peroxide was detected by a platinum electrode (0.5 V applied potential) in reference to an Ag+/AgCl electrode. ChromGraph software (Bioanalytical Systems) was used to digitize and quantify the resulting chromatograms (Fig. 1C) compared with a series of ACh standards. The percentage of a known ACh solution recovered by the probe was determined before and after every experiment. If the preexperiment and postexperiment probe recoveries were significantly different by t test, the data from that experiment were discarded.
Time to resumption of wakefulness after anesthesia.
When microdialysis sample collection was completed, the dialysis probe was withdrawn from the brain, the scalp incision was closed, and anesthesia was discontinued. Mice were removed from the stereotaxic frame and placed in dorsal recumbency under a heat lamp. The time to righting and resumption of normal weight-bearing posture was recorded. The resumption of righting response provides an established measure of the time for the onset of wakefulness after anesthesia (Bignall, 1974; Kubota et al., 1999; Tung et al., 2002, 2005; DeMarco et al., 2004; Kelz et al., 2008).
EEG recording and power spectral analysis.
Electrodes for recording the EEG were constructed from 0.13 mm diameter stainless steel wire (California Fine Wire) and were implanted above the cortex, contralateral to the microdialysis probe. The stereotaxic coordinates for the two EEG electrodes were 2.8 mm anterior to bregma and 2.4 mm posterior to bregma with both at 1.5 mm lateral to the midline. The EEG was recorded during dialysis with Ringer's (control; 75 min) and during dialysis with drug (75 min). The EEG signal was amplified and filtered at 0.3 and 30 Hz using a Grass Model P511K amplifier. The amplified and filtered EEG was digitized and recorded using Spike2 (Cambridge Electronic Design) software at a sampling rate of 128 Hz. Fast Fourier transform (FFT) analysis was used to compute EEG power (V2) in 0.5 Hz increments for EEG frequencies ranging from 0.5 to 25.0 Hz. Sample bins were 10 s in duration. During each experiment the 10 s bins were sampled every 250 s and EEG power was computed for 18 bins during Ringer's dialysis and 18 bins during dialysis drug delivery. Differences in the baseline activity of the EEG can vary as a function of electrode construction, electrode placement, and animal. Therefore, the effects of each drug on EEG delta power were compared with baseline measurements only within the same group of animals, and a different group of animals was used for each drug.
Recording sleep in the freely behaving mouse.
Mice were stereotaxically implanted under isoflurane anesthesia with EEG and EMG recording electrodes and a guide tube aimed for the prefrontal cortex as described above. The guide tube was placed at a 45° angle at coordinates 3 mm anterior to bregma and 0.5 mm lateral to the midline (Paxinos and Franklin, 2001). The EEG recording electrodes were constructed as described above and the EMG recording electrodes were constructed from AS632 biomed wire (Cooner Wire Company). The guide tube, two stainless steel anchor screws (Small Parts), EEG and EMG electrodes, and a plastic pedestal (Plastics One) containing the electrodes were adhered to the skull using dental acrylic. The mice were allowed to recover for 1 week and were conditioned to handling and being placed in a Plexiglas recording chamber (BAS Raturn system; Bioanalytical Systems).
The day before the experiment, mice were placed in the recording chamber between 4:00 and 5:00 P.M. and left overnight. On the day of the experiment a 50 nl microinjection of 100 μm (1.5 ng) DPCPX or saline containing 1% DMSO (vehicle) was injected over 1 min. This 1 min microinjection occurred between the hours of 9:00 and 10:00 A.M., followed by a 2 h recording to quantify sleep and wakefulness. The EEG and EMG signals were amplified with a Grass Instruments model 15RXi amplifier. Signals were filtered (EEG: 0.1–30 Hz; EMG: 10–100 Hz), digitized at 128 Hz, and recorded using Icelus Acquisition software (Opp, 1997). Each mouse received 2 microinjections that were separated by 1 week. States of wakefulness, NREM sleep, and REM sleep were scored in 10 s bins. The EEG power spectra were quantified using FFT analysis.
Statistics.
ACh release was expressed as percentage of ACh measured during dialysis with Ringer's (control condition). Drug main effects on prefrontal cortex ACh release and time to waking after anesthesia were analyzed using one-way ANOVA. Post hoc analyses included Dunnett's statistic, Tukey–Kramer multiple-comparisons test, and Student's t test (GBStat v6.5.6, Dynamic Microsystems). Drug effects on EEG delta power (0.5–4 Hz) were evaluated using two-way repeated-measures ANOVA to assess a treatment main effect, frequency main effect, and drug-by-frequency interaction. Post hoc analysis determined the effect of treatment on a given frequency band of the EEG (SAS v9.1.3, SAS Institute). Nonlinear regression analysis of the concentration–response data provided coefficients of determination (r2) for each drug (GraphPad Prism software v4.0a for Macintosh, GraphPad Software). The percentage of recording time spent in wakefulness, NREM sleep, and REM sleep, as well as drug effects on ACh release in the pontine reticular formation were analyzed using Student's t test (GBStat v6.5.6, Dynamic Microsystems). Data are reported as mean ± SEM. A probability value of p ≤ 0.05 was considered to be statistically significant.
Histology.
Seven days after microdialysis experiments and 3 d after microinjection experiments, mice were deeply anesthetized and decapitated. The brains were removed, frozen, and sectioned coronally (40 μm thick). The sections were fixed with hot (80°C) paraformaldehyde vapor and stained with cresyl violet. The location of a glial scar caused by the microdialysis probe or microinjector was determined by comparing stained sections with a mouse brain atlas (Paxinos and Franklin, 2001). Results were included in the group data only for experiments in which histology confirmed that the microdialysis probe or microinjector was placed in the prefrontal cortex. Similar histological analyses were performed for the dual microdialysis experiments to confirm probe placement in the prefrontal cortex and pontine reticular formation for each mouse.
Results
Figure 1A illustrates the within-subjects design used for the microdialysis experiments. ACh release was quantified during 75 min of dialysis with Ringer's (control) followed by an additional 75 min of dialysis with Ringer's (negative control) or Ringer's containing drug. Results of the negative control experiments confirmed that ACh release was stable during 150 min of isoflurane anesthesia. One-way ANOVA revealed no significant difference in total anesthesia time (284 ± 2 min) across all microdialysis experiments. Histological analysis confirmed that all microdialysis and microinjection sites were within the FrA of the prefrontal cortex.
An adenosine A2A receptor agonist increased waking phenotypes
The first set of studies was designed to determine whether microdialysis delivery of the adenosine A2A receptor agonist CGS to the prefrontal cortex increased waking phenotypes, which included increased cortical ACh release, decreased time to waking after anesthesia, and cortical EEG activation (Fig. 2) (n = 21 mice). CGS caused a significant drug main effect on ACh release within the prefrontal cortex (F(5,12) = 12.8, p = 1.9 × 10⁻⁴) (Fig. 2A) and time required for resumption of wakefulness after isoflurane anesthesia (F(5,12) = 6.4, p = 0.0042) (Fig. 2B). The rightmost point in Figure 2, A and B, shows that the adenosine A2A receptor antagonist ZM (0.1 μm) coadministered with CGS (10 + ZM) blocked the effects of CGS (10 μm) on ACh release and anesthesia recovery time. Figure 2C illustrates that CGS also decreased delta power in the cortical EEG. FFT analyses confirmed a decrease in EEG delta power caused by CGS. Two-way repeated-measures ANOVA revealed no frequency-by-drug interaction but post hoc analyses comparing the means at each frequency between treatments revealed that delta power from 0.5 to 1.0 Hz was significantly reduced by CGS. The ANOVA included eight frequency conditions (0.5–4.0 Hz every 0.5 Hz) and two treatment conditions (Ringer's or CGS).
Figure 2.
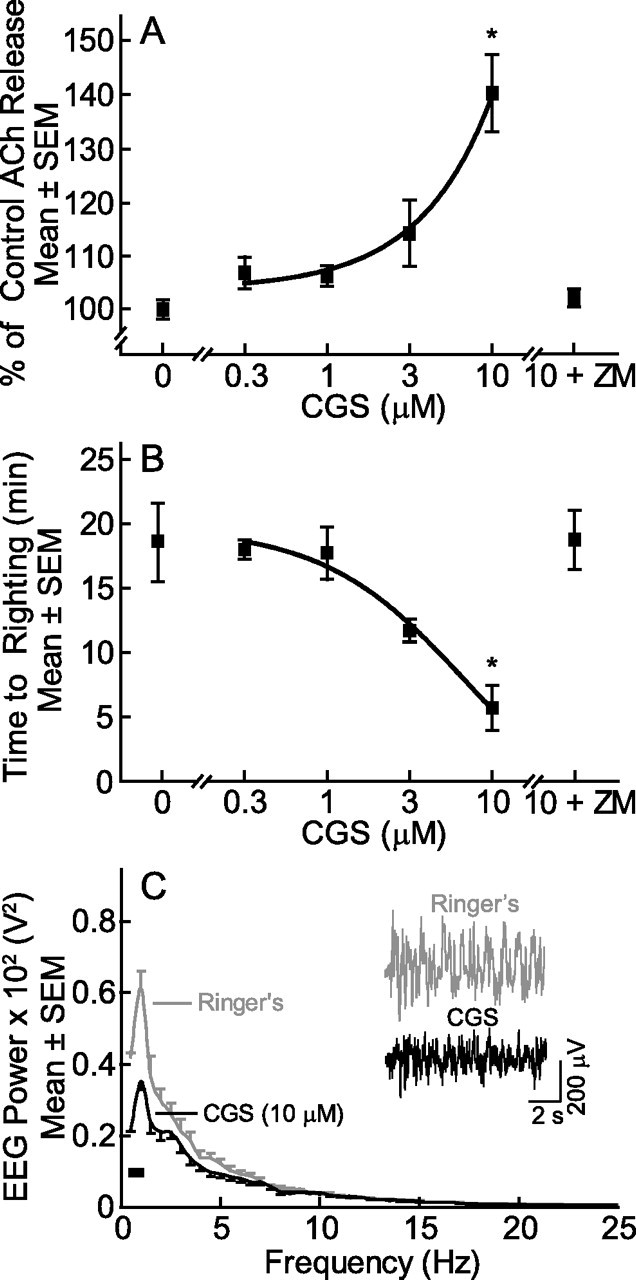
Microdialysis delivery of CGS to the prefrontal cortex increased all measures of arousal. CGS caused a concentration-dependent increase in ACh release (A), decrease in time to waking after anesthesia (B), and decrease in EEG delta power (C). Each point in A and B plots data from three mice. Post hoc Dunnett's statistic showed that CGS (10 μm) significantly (*p < 0.01) increased ACh release and decreased time to righting after anesthesia, and that coadministration of the antagonist ZM with CGS (10 + ZM) blocked these effects. Comparison of the two functions shown in A and B by regression analysis indicates that ACh release in the prefrontal cortex accounted for 99.9% of the variance in time to waking after anesthesia. The EEG power spectra in C represent an average from three additional mice. The inset in C shows representative 10 s EEG recordings during dialysis with Ringer's or Ringer's containing CGS. The black bar (lower left of C) indicates significantly different EEG delta frequencies between Ringer's and CGS dialysis.
Waking phenotypes were decreased by an adenosine A1 receptor agonist
Additional experiments in another group of mice (Fig. 3) (n = 21) determined whether microdialysis delivery of the adenosine A1 receptor agonist SPA to the prefrontal cortex reduced ACh release and arousal. ANOVA revealed a significant main effect of SPA on prefrontal cortex ACh release (F(6,14) = 25.0, p = 1.03 × 10⁻⁶) (Fig. 3A) and the amount of time required for resumption of waking after anesthesia (F(6,14) = 46.5, p = 1.8 × 10⁻⁸) (Fig. 3B). Coadministration of the adenosine A1 receptor antagonist DPCPX (100 μm) with SPA (10 mm) blocked the effects of SPA (10 + DPCPX in Fig. 3A,B). Figure 3C illustrates that SPA increased EEG delta power. Two-way repeated-measures ANOVA identified a significant drug effect (F(7,14) = 62.5, p = 0.01), and a significant frequency-by-drug interaction (F(7,14) = 9.3, p = 0.0002). Post hoc analyses revealed that SPA significantly increased EEG delta power in the 0.5–2.5 Hz band.
Figure 3.

Dialysis administration of SPA to the prefrontal cortex decreased dependent measures of arousal. SPA caused a concentration-dependent decrease in ACh release in the prefrontal cortex (A) and an increase in time required for resumption of wakefulness after anesthesia (B). Asterisks (*p < 0.05, **p < 0.01) indicate concentrations of SPA that caused a significant difference compared with Ringer's control (0 mm SPA) by post hoc Dunnett's statistic. Coadministration of the antagonist DPCPX with SPA (10 + DPCPX) blocked the effects of SPA on both ACh release and time to resumption of righting. Comparison by regression analysis of data shown in A and B indicate that ACh release accounted for 90.2% of the variance in wake-up time. Each point in A and B summarizes results from three mice. C, EEG power spectra averaged for three mice during dialysis with Ringer's (control) or Ringer's containing SPA. The inset (C) shows two 10 s EEG recordings, and the black bar indicates the frequencies at which SPA caused a significant increase in EEG power.
Caffeine and an adenosine A1 receptor antagonist but not an adenosine A2A receptor antagonist enhanced waking phenotypes
Having demonstrated that exogenous adenosine A1 and A2A receptor agonists delivered to the prefrontal cortex alter waking phenotypes, additional mice (Fig. 4) (n = 42) were used to determine whether endogenous adenosine acting at adenosine A1 and/or A2A receptors modulates the same arousal phenotypes. Dialysis delivery of caffeine caused a significant, concentration-dependent increase in ACh release within the prefrontal cortex during anesthesia (F(4,10) = 3.5, p = 0.049) (Fig. 4A) and decrease in the time required for resumption of waking after anesthesia (F(4,10) = 6.9, p = 0.0061) (Fig. 4B). Dialysis delivery of the adenosine A1 receptor antagonist DPCPX also caused a significant, concentration-dependent increase in prefrontal cortex ACh release (F(5,12) = 201.7, p = 3.8 × 10⁻¹¹) (Fig. 4A) and a significant, concentration-dependent decrease in time required for resumption of waking after anesthesia (F(5,12) = 8.2, p = 0.0014) (Fig. 4B). In contrast, dialysis delivery of five concentrations of the adenosine A2A receptor antagonist ZM to the prefrontal cortex did not alter prefrontal cortex ACh release (Fig. 4A) or time to waking after anesthesia (Fig. 4B). To maintain selectivity for the A2A receptor (Linden et al., 1999; Lopes et al., 1999), greater concentrations of ZM were not tested.
Figure 4.

Caffeine and DPCPX promote arousal. Caffeine and DPCPX increased prefrontal cortex ACh release (A) and decreased time to waking after anesthesia (B). Each point in A and B averages results from three mice. Post hoc Dunnett's analysis identified concentrations of caffeine and DPCPX that caused a significant (*p < 0.05, **p < 0.01) change from Ringer's control. Application of regression analyses to compare ACh release (A) and time to righting (B) revealed that ACh release in the prefrontal cortex accounted for 93% of the variance in time to righting after anesthesia for caffeine, 92% for DPCPX, and 0.4% for ZM. Dialysis administration of ZM to the prefrontal cortex did not alter either dependent measure of arousal.
Adenosine A1 receptors in prefrontal cortex modulate ACh release and arousal: efficacy and potency comparisons
Derivation of the concentration–response data for a selective antagonist of the adenosine A1 receptor (DPCPX), the adenosine A2A receptor (ZM), and the mixed antagonist (caffeine) made it possible to gain insight into the relative efficacy and potency of these drugs for altering ACh release and anesthesia wake up time. Figure 4A shows that dialysis delivery of DPCPX produced the greatest increase in ACh release, ZM did not alter ACh release, and caffeine caused a significant increase in ACh release. The percentage of variance in ACh release accounted for by the three antagonists was 100% for caffeine, 99% for DPCPX, and 30% for ZM. Figure 4B suggests that DPCPX and caffeine were equally efficacious in shortening the time required for resumption of wakefulness, and DPCPX was more potent than caffeine. Across the range of concentrations examined, ZM did not shorten time to resumption of righting. The percentage of variance in anesthesia recovery time accounted for by the three antagonists was 97% for DPCPX, 89% for caffeine, and 15% for ZM.
Caffeine and an adenosine A1 receptor antagonist but not an adenosine A2A receptor antagonist decreased EEG delta power
Caffeine delivered to the prefrontal cortex significantly decreased EEG delta power in the contralateral cortex (Fig. 5A). Two-way repeated-measures ANOVA revealed no frequency-by-drug interaction but post hoc analyses comparing the means at each frequency between treatments indicated that caffeine depressed EEG power at 1.0 Hz. The DPCPX-induced decrease in EEG delta power is shown in Figure 5B. Two-way repeated-measures ANOVA revealed significant frequency-by-drug interaction (F(7,14) = 43.2, p < 0.0001), and post hoc analyses showed that DPCPX depressed EEG power in the 0.5–3.5 Hz range. Figure 5C illustrates that the adenosine A2A receptor antagonist ZM did not alter EEG delta power.
Figure 5.

Caffeine and DPCPX activated the cortical EEG. Power spectral analysis of the cortical EEG revealed that caffeine (A) and DPCPX (B) significantly decreased EEG delta power. Dialysis delivery of ZM (C) did not decrease EEG delta power. The insets show 10 s EEG recordings from the same mouse during dialysis with Ringer's or Ringer's containing drug. Black bars (lower left of A and B) indicate delta frequency bands that showed significantly decreased power during dialysis with caffeine and DPCPX. Each graph represents data obtained from three mice.
Microinjecting an adenosine A1 receptor antagonist into the prefrontal cortex of unanesthetized B6 mice increased wakefulness and decreased NREM sleep
The foregoing results encouraged another set of experiments using intact, unanesthetized mice (Fig. 6) (n = 8) to determine whether prefrontal cortex administration of the adenosine A1 receptor antagonist DPCPX altered sleep and wakefulness. Compared with microinjection of saline (Fig. 6A), DPCPX increased wakefulness by 25.0% (t(14) = 13.1, p = 1.5 × 10⁻⁹) and decreased NREM sleep by 40.3% (t(14) = 13.4, p = 1.1 × 10⁻⁹). Figure 6B–D summarizes the averaged EEG power spectra during wakefulness, NREM sleep, and REM sleep. Insets show representative EEG and EMG recordings from the same mouse after microinjection of DPCPX. Wakefulness was characterized by a mixed-frequency EEG and high-amplitude EMG. NREM sleep was characterized by high delta power (0.5–4 Hz) in the EEG and a lower-amplitude EMG. REM sleep was characterized by a high theta power (5–8 Hz) in the EEG and a low-amplitude EMG. Figure 6B–D demonstrates that EEG power spectra were not different following microinjection of saline or DPCPX. Sleep architecture was normal after microinjection of DPCPX, and REM sleep always followed NREM sleep.
Figure 6.
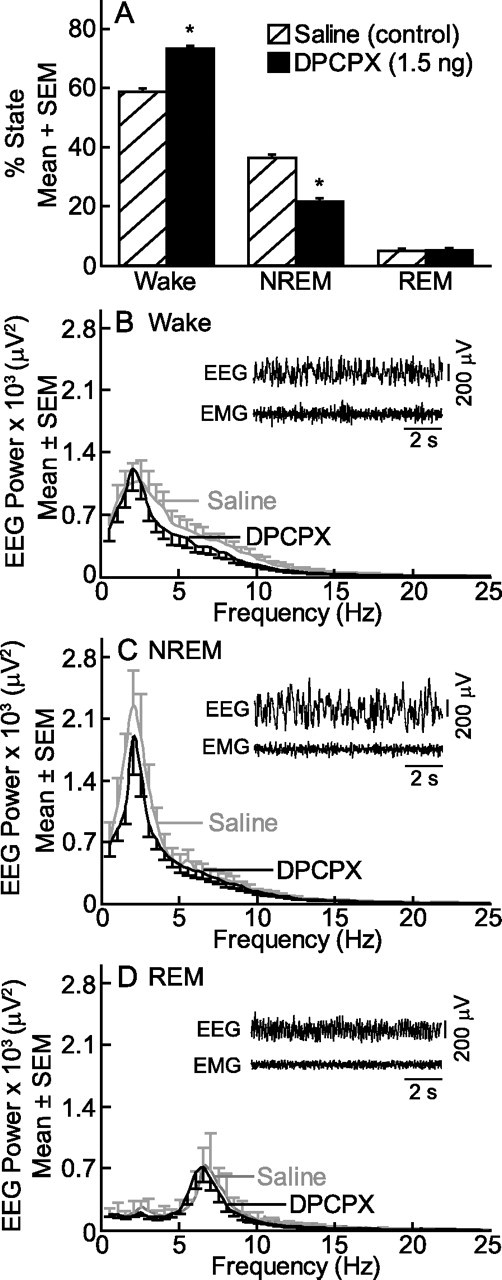
DPCPX increased wakefulness. Microinjection of the adenosine A1 receptor antagonist DPCPX into the prefrontal cortex caused a significant (*p < 0.0001 by Student's t test) increase in wakefulness and decrease in NREM sleep (A). The EEG power spectra did not differ following microinjection of saline and DPCPX during waking (B), NREM sleep (C), or REM sleep (D). EEG data were analyzed in 0.5 Hz increments and represent the average from eight mice. The insets show 10 s EEG and EMG recordings after microinjection of DPCPX.
Dialysis delivery of adenosine A1 and A2A receptor agonists and antagonists to the prefrontal cortex altered pontine reticular formation ACh release
This section reports the results from dual dialysis experiments in which drugs were delivered to the prefrontal cortex while ACh release was simultaneously measured in the pontine reticular formation (Fig. 7A). Histological analysis confirmed that all microdialysis sites were within the FrA of the prefrontal cortex and the pontine reticular formation (Paxinos and Franklin, 2001). The group data showed that CGS, an adenosine A2A receptor agonist, delivered to the prefrontal cortex significantly (t(4) = 9.8, p < 0.001) increased ACh release in the pontine reticular formation (Fig. 7B). Microdialysis delivery of the adenosine A1 receptor agonist SPA to the prefrontal cortex significantly (t(4) = 8.1, p < 0.001) decreased ACh release in the pontine reticular formation (Fig. 7B). Dialysis delivery of caffeine significantly (t(4) = 21.4, p < 0.0001) increased ACh release in the pontine reticular formation (Fig. 7C). Dialysis delivery to the prefrontal cortex of the adenosine A1 receptor antagonist DPCPX significantly (t(4) = 16.0, p < 0.0001) increased ACh release in the pontine reticular formation (Fig. 7C).
Figure 7.
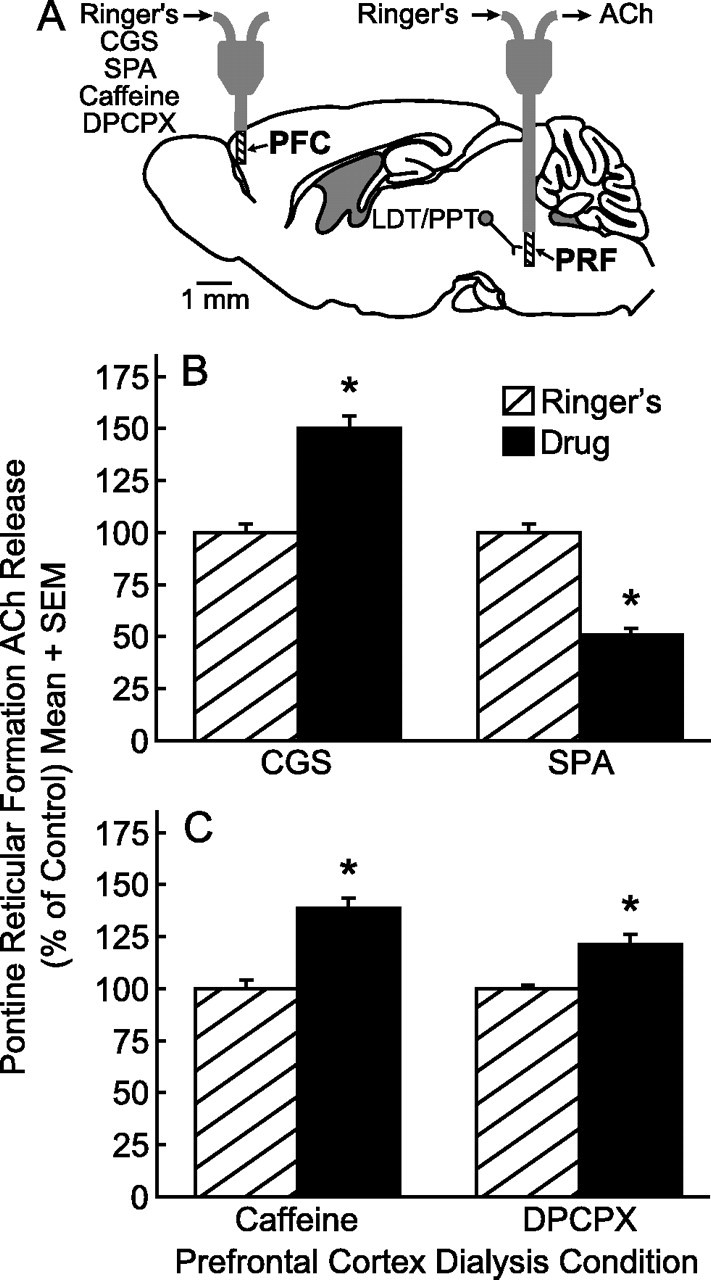
Adenosine A1 and A2A receptor agonists and antagonists delivered to the prefrontal cortex (PFC) significantly altered ACh release in the pontine reticular formation (PRF). A, The sagittal diagram modified from a mouse brain atlas (Paxinos and Franklin, 2001) shows placement of one microdialysis probe in the PFC and a second microdialysis probe in the PRF. The dialysis probe membranes are drawn to scale (1 mm length, 0.24 mm diameter). The distance between the two probe tips is 8.56 mm. The laterodorsal tegmental (LDT) and pedunculopontine tegmental (PPT) nuclei provide cholinergic input to the PRF. B, Dialysis administration of the adenosine A2A receptor agonist CGS to the PFC caused a significant increase in PRF ACh release, whereas PFC SPA, an adenosine A1 receptor agonist, caused a significant decrease in PRF ACh release. C, PRF ACh release was also increased by PFC administration of caffeine and the adenosine A1 receptor antagonist DPCPX. Each drug was tested in three mice.
Discussion
This is the first study to demonstrate that pharmacological manipulation of prefrontal cortex adenosine A1 and A2A receptors alters behavioral and EEG arousal and modulates cholinergic neurotransmission in the prefrontal cortex and the pontine reticular formation. The present data suggest that one mechanism by which adenosine in the prefrontal cortex diminishes behavioral arousal is by decreasing ACh release within the pontine reticular formation. Previous studies of adenosine A1 receptor knock-out mice suggested that caffeine modulates arousal solely via adenosine A2A receptors (Huang et al., 2005). As discussed below, the present data show that in the prefrontal cortex endogenous adenosine acting at adenosine A1 receptors decreases arousal and that caffeine blocks the effects of endogenous adenosine on arousal by antagonizing prefrontal cortex adenosine A1 receptors.
Adenosine A1 and A2A receptor agonists had opposite effects on waking phenotypes
Dialysis administration of the adenosine A2A receptor agonist CGS caused a concentration-dependent increase in ACh release (Fig. 2A) and decrease in the time to waking after anesthesia (Fig. 2B). The increase in prefrontal cortex ACh release parallels findings in the pontine reticular formation of B6 mouse where dialysis delivery of similar concentrations of CGS also caused an increase in ACh release (Coleman et al., 2006). This same study (Coleman et al., 2006) found that CGS caused a biphasic concentration–response curve for ACh release by activating adenosine A1 receptors at higher concentrations (Klotz, 2000; Halldner et al., 2004; Lopes et al., 2004). In the present study, microdialysis with 30 μm CGS caused no change in ACh release or anesthesia recovery time, suggesting that at dialysis concentrations >10 μm, CGS loses specificity for the A2A receptor and binds to the adenosine A1 receptor. The findings that the CGS effects were concentration dependent and blocked by the antagonist ZM (Fig. 2A,B) support the interpretation that adenosine A2A receptors in the prefrontal cortex respond to exogenous agonists by increasing ACh release and behavioral arousal and decreasing EEG slow-wave activity.
Dialysis administration of the adenosine A1 receptor agonist SPA caused a concentration-dependent decrease in ACh release (Fig. 3A) within the prefrontal cortex and an increase in time required for resumption of waking after anesthesia (Fig. 3B). The decrease in ACh release and the increase in time to waking after anesthesia were blocked by coadministering the adenosine A1 receptor antagonist DPCPX. These findings are consistent with previous data showing that dialysis delivery of SPA to cat pontine reticular formation caused a decrease in ACh release and an increase in the time required to awaken after anesthesia (Tanase et al., 2003). The SPA-induced decrease in prefrontal cortex ACh release is similar to the finding that muscimol, a GABAA receptor agonist, delivered to rat prefrontal cortex decreased sensory-evoked ACh release in somatosensory cortex (Rasmusson et al., 2007). The present data demonstrate that adenosine A1 receptors in the prefrontal cortex decrease ACh release, as well as behavioral and EEG arousal.
Available evidence indicates a role for both adenosine A1 and A2A receptors in the regulation of sleep–wake states. For example, systemic or intracerebroventricular administration of the adenosine A1 receptor agonist N6-cyclopentyladenosine to rat causes a concentration-dependent increase in slow-wave activity during NREM sleep, mimicking the EEG changes that occur with sleep deprivation (Benington et al., 1995). In cat, microdialysis delivery of the adenosine A1 receptor antagonist cyclopentyltheophylline to the basal forebrain increases wakefulness and decreases NREM sleep and REM sleep (Strecker et al., 2000). Dialysis delivery of the adenosine A1 receptor agonist cyclohexyladenosine to cat basal forebrain decreases wakefulness and increases sleep (Strecker et al., 2000). Sleep deprivation in rat causes a significant increase in basal forebrain adenosine A1 receptor mRNA (Basheer et al., 2001) and protein (Basheer et al., 2007), and a decrease in basal forebrain adenosine A2A receptor mRNA (Basheer et al., 2001). These results are consistent with the conclusion that basal forebrain adenosine A1 receptors contribute to the sleep inducing action of adenosine. Adenosine A1 receptor binding is also upregulated in the cortex and corpus striatum after REM sleep deprivation in rat (Yanik and Radulovacki, 1987). In humans, sleep deprivation increases adenosine A1 receptor binding with the highest binding in the orbitofrontal cortex (Elmenhorst et al., 2007). Thus, the present finding that adenosine A1 receptors in the prefrontal cortex mediate the sleep promoting effect of adenosine fit well with data from intact rat, cat, and human.
Endogenous adenosine in the prefrontal cortex decreases arousal by actions at adenosine A1 receptors
The adenosine A2A receptor antagonist ZM blocked the CGS-induced enhancement of waking phenotypes, but ZM alone did not alter prefrontal cortex ACh release (Fig. 4A), time to waking after anesthesia (Fig. 4B), or EEG delta power (Fig. 5C). These results suggest that in B6 mouse endogenous adenosine does not alter arousal through adenosine A2A receptors in the prefrontal cortex. The present finding that the adenosine A2A receptor antagonist ZM did not alter waking phenotypes in wild-type B6 mice differs from a previous study reporting that caffeine promoted wakefulness in adenosine A1 but not A2A receptor knock-out mice (Huang et al., 2005). The data from the knock-out mice were interpreted to suggest that caffeine promotes wakefulness via blockade of adenosine A2A receptors, not adenosine A1 receptors (Huang et al., 2005). There are three major differences between the previous (Huang et al., 2005) and present studies. First, the concentrations of caffeine used in the Huang et al. (2005) study (5, 10, and 15 mg/kg) have been shown to induce locomotor activity (Fredholm et al., 1999; Lindskog et al., 2002). Therefore, the increase in wakefulness reported by Huang et al. (2005) may have been secondary to an increase in locomotor activity. Second, the Huang et al. (2005) study administered caffeine systemically by intraperitoneal injection, whereas all the drugs in the present study were delivered only to the prefrontal cortex. Third, the Huang et al. (2005) study used knock-out mice in contrast to the present use of intact, normal mice. A potential limitation of knock-out mice is that the absence of a gene during development can lead to compensatory changes by other genes (Robert, 1998; Crawley, 2000). Adenosine A1 (Stenberg et al., 2003) and adenosine A2A (Urade et al., 2003) receptor knock-out mice each survive development with no major defects and show normal circadian sleep–wake cycles compared with wild-type mice (Stenberg et al., 2003; Urade et al., 2003). These findings suggest that compensatory changes do occur.
In contrast to the effects of ZM, the adenosine A1 receptor antagonist DPCPX caused a significant, concentration-dependent increase in ACh release within the prefrontal cortex (Fig. 4A), decrease in time for resumption of waking after anesthesia (Fig. 4B), and decreased EEG delta power (Fig. 5B). The DPCPX data show, for the first time, that behavioral and EEG arousal are reduced by endogenous adenosine acting at adenosine A1 receptors in the prefrontal cortex of B6 mouse. This interpretation is also supported by the caffeine data. Caffeine caused a significant, concentration-dependent increase in ACh release within the prefrontal cortex (Fig. 4A), decrease in time to waking after anesthesia (Fig. 4B), and decrease in EEG delta power (Fig. 5A).
Previous studies of urethane anesthetized rats examined the effects of adenosine receptor agonists and antagonists on ACh release in somatosensory cortex evoked by electrical stimulation of the pedunculopontine tegmental nucleus (Materi et al., 2000). Dialysis delivery of adenosine or the adenosine A1 receptor agonist N6-cyclopentyladenosine to the somatosensory cortex decreased evoked ACh release in the somatosensory cortex, and this decrease in evoked ACh release was blocked by the adenosine A1 receptor antagonist DPCPX (Materi et al., 2000). Both the Materi et al. (2000) study and the current data agree that adenosine A1 receptor agonists decrease cortical ACh release. In contrast to the present results, neither the adenosine A2A receptor agonist CGS, the adenosine A1 receptor antagonist DPCPX, nor the adenosine A1 and A2A receptor antagonist caffeine delivered to the somatosensory cortex altered evoked ACh release (Materi et al., 2000). The differences between the Materi et al. (2000) findings and the present research may reflect the fact that the two studies used different species, different brain regions, and different anesthetics.
The recordings of sleep and wakefulness also demonstrate that adenosine A1 receptors in the prefrontal cortex contribute to the regulation of EEG and behavioral arousal. Microinjection of the adenosine A1 receptor antagonist DPCPX into the prefrontal cortex increased wakefulness and decreased NREM sleep (Fig. 6A). Following microinjection of saline and DPCPX, the mice exhibited normal behavioral phenotypes of grooming and locomotor behavior. Quantitative EEG analyses of wakefulness, NREM sleep, and REM sleep following saline (control) or DPCPX microinjections revealed similar spectral characteristics during all states. Although the data summarized by Figure 6 are limited to a single concentration of DPCPX, the results are consistent with a previous study showing that DPCPX promotes wakefulness (Tanase et al., 2003). Considered together with the microdialysis results, the microinjection data support the interpretation that DPCPX enhanced wakefulness and decreased sleep, at least in part, by increasing prefrontal cortex ACh release. Thus, multiple lines of evidence support the interpretation that endogenous adenosine acting through adenosine A1 receptors in the prefrontal cortex inhibits wakefulness.
Prefrontal cortex adenosine A1 and A2A receptors modulate behavioral arousal by altering pontine reticular formation ACh release
Dialysis delivery of CGS, caffeine, and DPCPX to the prefrontal cortex increased pontine reticular formation ACh release, and SPA decreased pontine reticular formation ACh release (Fig. 7). The Figure 7 data are consistent with the interpretation that prefrontal cortex adenosine A1 and A2A receptors in B6 mouse modulate behavioral arousal, in part, via a descending pathway that alters ACh release in the pontine reticular formation. This inference is supported by evidence that the prefrontal cortex projects to pontine brain regions known to modulate behavioral arousal such as the locus ceruleus and the cholinergic laterodorsal tegmental nucleus (Arnsten and Goldman-Rakic, 1984). Another region that may contribute to the regulation of arousal by prefrontal cortex adenosine is the basal forebrain. The prefrontal cortex and basal forebrain have reciprocal projections that are involved in the regulation of sensory input from the somatosensory cortex (Golmayo et al., 2003; Rasmusson et al., 2007; Gyengési et al., 2008).
How do the present data showing that prefrontal cortex administration of DPCPX increases wakefulness (Fig. 6) and that caffeine, CGS, and DPCPX increase PRF ACh release (Fig. 7) fit with previous data (Leonard and Lydic, 1997) indicating that ACh release in the PRF increases during REM sleep? One answer is that descending input from prefrontal cortex is not limited to activating cholinergic laterodorsal tegmental (LDT) and pedunculopontine tegmental (PPT) neurons that discharge selectively during REM sleep (Steriade et al., 1990), releasing ACh in the pontine reticular formation (Lydic and Baghdoyan, 1993). Prefrontal cortex may activate LDT/PPT cholinergic neurons that discharge during both wakefulness and REM sleep (Steriade et al., 1990). Descending input from the prefrontal cortex may also activate monoaminergic neurons that are known to discharge maximally during wakefulness (Steriade and McCarley, 2005). Endogenous GABA of unknown origin also increases in the pontine reticular formation during wakefulness relative to isoflurane anesthesia (Vanini et al., 2008). Thus, ACh is one of many molecules in the pontine reticular formation that generates wakefulness. Additional brain regions must be considered and adenosine receptors in prefrontal cortex may also promote wakefulness, in part, by increasing ACh release in the thalamus. It should be clear that these speculations are testable and that the present results encourage future neurochemical studies designed to specify how the forebrain and brainstem interact to generate and maintain wakefulness.
Conclusions
The prefrontal cortex contributes to the regulation of sleep and wakefulness (Muzur et al., 2002) and the present results show for the first time that adenosine A1 and A2A receptors in the prefrontal cortex of B6 mouse modulate behavioral arousal, cortical ACh release, EEG delta power, and sleep. Caffeine is an adenosine A1 and A2A receptor antagonist and data from humans and rodents indicate that caffeine promotes arousal by enhancing cortical cholinergic transmission. Caffeine enhances psychomotor vigilance, in part, by activating the human prefrontal cortex (Higashi et al., 2004) and systemic administration of caffeine increases ACh release in the prefrontal cortex of rat (Acquas et al., 2002). Attention demanding tasks increase ACh release in the prefrontal cortex (Kozak et al., 2006) and morning consumption of caffeine is an effective countermeasure for cognitive deficits known to be associated with sleep inertia (Van Dongen et al., 2001). Microdialysis delivery of caffeine, DPCPX, and ZM in the present study demonstrates that blocking adenosine A1 receptors in the prefrontal cortex increases ACh release in the prefrontal cortex. The present results also provide functional evidence for a descending pathway from the prefrontal cortex to the pontine reticular formation. Given the known role of the prefrontal cortex in executive function (Fuster, 2001) the results suggest one pathway for top-down, volitional modulation of arousal. The ability of the executive cortex to recruit input from the ascending reticular activating system (Moruzzi and Magoun, 1949) may provide one mechanism allowing sleep-deprived individuals to cope with attention demanding tasks (Chee et al., 2008).
Footnotes
This work was supported by National Institutes of Health Grants HL65272, HL57120, HL40881, and MH45361 and the Department of Anesthesiology. We thank S. Jiang and M. A. Norat for expert assistance. For statistical input, we thank K. Welch and the University of Michigan Center for Statistical Consultation and Research.
References
- Acquas et al., 2002.Acquas E, Tanda G, Di Chiara G. Differential effects of caffeine on dopamine and acetylcholine transmission in brain areas of drug-naive and caffeine-pretreated rats. Neuropsychopharmacology. 2002;27:182–193. doi: 10.1016/S0893-133X(02)00290-7. [DOI] [PubMed] [Google Scholar]
- Alaraj et al., 1998.Alaraj M, Kosiñska I, Lazarewicz JW. Effects of caffeine on NMDA-evoked 45Ca2+ release in the rat dentate gyrus in vivo. Acta Neurobiol Exp (Wars) 1998;58:239–246. doi: 10.55782/ane-1998-1278. [DOI] [PubMed] [Google Scholar]
- Arnsten and Goldman-Rakic, 1984.Arnsten AF, Goldman-Rakic PS. Selective prefrontal cortical projections to the region of the locus coeruleus and raphe nuclei in the rhesus monkey. Brain Res. 1984;306:9–18. doi: 10.1016/0006-8993(84)90351-2. [DOI] [PubMed] [Google Scholar]
- Basheer et al., 2001.Basheer R, Halldner L, Alanko L, McCarley RW, Fredholm BB, Porkka-Heiskanen T. Opposite changes in adenosine A1 and A2A receptor mRNA in the rat following sleep deprivation. Neuroreport. 2001;12:1577–1580. doi: 10.1097/00001756-200106130-00013. [DOI] [PubMed] [Google Scholar]
- Basheer et al., 2004.Basheer R, Strecker RE, Thakkar MM, McCarley RW. Adenosine and sleep-wake regulation. Prog Neurobiol. 2004;73:379–396. doi: 10.1016/j.pneurobio.2004.06.004. [DOI] [PubMed] [Google Scholar]
- Basheer et al., 2007.Basheer R, Bauer A, Elmenhorst D, Ramesh V, McCarley RW. Sleep deprivation upregulates A1 adenosine receptors in the rat basal forebrain. Neuroreport. 2007;18:1895–1899. doi: 10.1097/WNR.0b013e3282f262f6. [DOI] [PubMed] [Google Scholar]
- Benington et al., 1995.Benington JH, Kodali SK, Heller HC. Stimulation of A1 adenosine receptors mimics the electroencephalographic effects of sleep deprivation. Brain Res. 1995;692:79–85. doi: 10.1016/0006-8993(95)00590-m. [DOI] [PubMed] [Google Scholar]
- Bignall, 1974.Bignall KE. Ontogeny of levels of neural organization: the righting reflex as a model. Exp Neurol. 1974;42:566–573. doi: 10.1016/0014-4886(74)90079-x. [DOI] [PubMed] [Google Scholar]
- Carter, 1997.Carter AJ. Hippocampal noradrenaline release in awake, freely moving rats is regulated by alpha-2 adrenoceptors but not by adenosine receptors. J Pharmacol Exp Ther. 1997;281:648–654. [PubMed] [Google Scholar]
- Chee et al., 2008.Chee MW, Tan JC, Zheng H, Parimal S, Weissman DH, Zagorodnov V, Dinges DF. Lapsing during sleep deprivation is associated with distributed changes in brain activation. J Neurosci. 2008;28:5519–5528. doi: 10.1523/JNEUROSCI.0733-08.2008. [DOI] [PMC free article] [PubMed] [Google Scholar]
- Coleman et al., 2006.Coleman CG, Baghdoyan HA, Lydic R. Dialysis delivery of an adenosine A2A agonist into the pontine reticular formation of C57BL/6J mouse increases pontine acetylcholine release and sleep. J Neurochem. 2006;96:1750–1759. doi: 10.1111/j.1471-4159.2006.03700.x. [DOI] [PubMed] [Google Scholar]
- Crawley, 2000.Crawley J. Behavioral phenotyping of transgenic and knockout mice. New York: Wiley-Liss; 2000. What's wrong with my mouse? [Google Scholar]
- Daly et al., 1986.Daly JW, Padgett WL, Shamim MT. Analogues of caffeine and theophylline: effect of structural alterations on affinity at adenosine receptors. J Med Chem. 1986;29:1305–1308. doi: 10.1021/jm00157a035. [DOI] [PubMed] [Google Scholar]
- DeMarco et al., 2004.DeMarco GJ, Baghdoyan HA, Lydic R. Carbachol in the pontine reticular formation of C57BL/6J mouse decreases acetylcholine release in prefrontal cortex. Neuroscience. 2004;123:17–29. doi: 10.1016/j.neuroscience.2003.08.045. [DOI] [PubMed] [Google Scholar]
- Douglas et al., 2002.Douglas CL, Baghdoyan HA, Lydic R. Prefrontal cortex acetylcholine release, EEG slow waves, and spindles are modulated by M2 autoreceptors in C57BL/6J mouse. J Neurophysiol. 2002;87:2817–2822. doi: 10.1152/jn.2002.87.6.2817. [DOI] [PubMed] [Google Scholar]
- Elmenhorst et al., 2007.Elmenhorst D, Meyer PT, Winz OH, Matusch A, Ermert J, Coenen HH, Basheer R, Haas HL, Zilles K, Bauer A. Sleep deprivation increases A1 adenosine receptor binding in the human brain: a positron emission tomography study. J Neurosci. 2007;27:2410–2415. doi: 10.1523/JNEUROSCI.5066-06.2007. [DOI] [PMC free article] [PubMed] [Google Scholar]
- Fredholm et al., 1999.Fredholm BB, Bättig K, Holmén J, Nehlig A, Zvartau EE. Actions of caffeine in the brain with special reference to factors that contribute to its widespread use. Pharmacol Rev. 1999;51:83–133. [PubMed] [Google Scholar]
- Fuster, 2001.Fuster JM. The prefrontal cortex—an update: time is of the essence. Neuron. 2001;30:319–333. doi: 10.1016/s0896-6273(01)00285-9. [DOI] [PubMed] [Google Scholar]
- Golmayo et al., 2003.Golmayo L, Nuñez A, Zaborszky L. Electrophysiological evidence for the existence of a posterior cortical-prefrontal-basal forebrain circuitry in modulating sensory responses in visual and somatosensory rat cortical areas. Neuroscience. 2003;119:597–609. doi: 10.1016/s0306-4522(03)00031-9. [DOI] [PubMed] [Google Scholar]
- Gyengési et al., 2008.Gyengési E, Zaborszky L, Détári L. The effect of prefrontal stimulation on the firing of basal forebrain neurons in urethane anesthetized rat. Brain Res Bull. 2008;75:570–580. doi: 10.1016/j.brainresbull.2007.09.008. [DOI] [PMC free article] [PubMed] [Google Scholar]
- Halldner et al., 2004.Halldner L, Lopes LV, Daré E, Lindström K, Johansson B, Ledent C, Cunha RA, Fredholm BB. Binding of adenosine receptor ligands to brain of adenosine receptor knock-out mice: evidence that CGS 21680 binds to A1 receptors in hippocampus. Naunyn Schmiedebergs Arch Pharmacol. 2004;370:270–278. doi: 10.1007/s00210-004-0970-1. [DOI] [PubMed] [Google Scholar]
- Higashi et al., 2004.Higashi T, Sone Y, Ogawa K, Kitamura YT, Saiki K, Sagawa S, Yanagida T, Seiyama A. Changes in regional cerebral blood volume in frontal cortex during mental work with and without caffeine intake: functional monitoring using near-infrared spectroscopy. J Biomed Opt. 2004;9:788–793. doi: 10.1117/1.1755233. [DOI] [PubMed] [Google Scholar]
- Huang et al., 2005.Huang ZL, Qu WM, Eguchi N, Chen JF, Schwarzschild MA, Fredholm BB, Urade Y, Hayaishi O. Adenosine A2A, but not A1, receptors mediate the arousal effect of caffeine. Nat Neurosci. 2005;8:858–859. doi: 10.1038/nn1491. [DOI] [PubMed] [Google Scholar]
- Huston et al., 1996.Huston JP, Haas HL, Boix F, Pfister M, Decking U, Schrader J, Schwarting RK. Extracellular adenosine levels in neostriatum and hippocampus during rest and activity periods of rats. Neuroscience. 1996;73:99–107. doi: 10.1016/0306-4522(96)00021-8. [DOI] [PubMed] [Google Scholar]
- Jouvet, 1962.Jouvet M. Research on the neural structures and responsible mechanisms in different phases of physiological sleep. Arch Ital Biol. 1962;100:125–206. [PubMed] [Google Scholar]
- Kelz et al., 2008.Kelz MB, Sun Y, Chen J, Cheng Meng Q, Moore JT, Veasey SC, Dixon S, Thornton M, Funato H, Yanagisawa M. An essential role for orexins in emergence from general anesthesia. Proc Natl Acad Sci U S A. 2008;105:1309–1314. doi: 10.1073/pnas.0707146105. [DOI] [PMC free article] [PubMed] [Google Scholar]
- Klotz, 2000.Klotz KN. Adenosine receptors and their ligands. Naunyn Schmiedebergs Arch Pharmacol. 2000;362:382–391. doi: 10.1007/s002100000315. [DOI] [PubMed] [Google Scholar]
- Kozak et al., 2006.Kozak R, Bruno JP, Sarter M. Augmented prefrontal acetylcholine release during challenged attentional performance. Cereb Cortex. 2006;16:9–17. doi: 10.1093/cercor/bhi079. [DOI] [PubMed] [Google Scholar]
- Kubota et al., 1999.Kubota T, Hirota K, Yoshida H, Takahashi S, Anzawa N, Ohkawa H, Kushikata T, Matsuki A. Effects of sedatives on noradrenaline release from the medial prefrontal cortex in rats. Psychopharmacology. 1999;146:335–338. doi: 10.1007/s002130051125. [DOI] [PubMed] [Google Scholar]
- Leonard and Lydic, 1997.Leonard TO, Lydic R. Pontine nitric oxide modulates acetylcholine release, rapid eye movement sleep generation, and respiratory rate. J Neurosci. 1997;17:774–785. doi: 10.1523/JNEUROSCI.17-02-00774.1997. [DOI] [PMC free article] [PubMed] [Google Scholar]
- Linden et al., 1999.Linden J, Thai T, Figler H, Jin X, Robeva AS. Characterization of human A2B adenosine receptors: radioligand binding, western blotting, and coupling to G(q) in human embryonic kidney 293 cells and HMC-1 mast cells. Mol Pharmacol. 1999;56:705–713. [PubMed] [Google Scholar]
- Lindskog et al., 2002.Lindskog M, Svenningsson P, Pozzi L, Kim Y, Fienberg AA, Bibb JA, Fredholm BB, Nairn AC, Greengard P, Fisone G. Involvement of DARPP-32 phosphorylation in the stimulant action of caffeine. Nature. 2002;418:774–778. doi: 10.1038/nature00817. [DOI] [PubMed] [Google Scholar]
- Lopes et al., 1999.Lopes LV, Cunha RA, Ribeiro JA. ZM 241385, an adenosine A2A receptor antagonist, inhibits hippocampal A1 receptor responses. Eur J Pharmacol. 1999;383:395–398. doi: 10.1016/s0014-2999(99)00659-7. [DOI] [PubMed] [Google Scholar]
- Lopes et al., 2004.Lopes LV, Halldner L, Rebola N, Johansson B, Ledent C, Chen JF, Fredholm BB, Cunha RA. Binding of the prototypical adenosine A2A receptor agonist CGS 21680 to the cerebral cortex of adenosine A1 and A2A receptor knockout mice. Br J Pharmacol. 2004;141:1006–1014. doi: 10.1038/sj.bjp.0705692. [DOI] [PMC free article] [PubMed] [Google Scholar]
- Lydic and Baghdoyan, 1993.Lydic R, Baghdoyan HA. Pedunculopontine stimulation alters respiration and increases ACh release in the pontine reticular formation. Am J Physiol. 1993;264:R544–R554. doi: 10.1152/ajpregu.1993.264.3.R544. [DOI] [PubMed] [Google Scholar]
- Marks et al., 2003.Marks GA, Shaffery JP, Speciale SG, Birabil CG. Enhancement of rapid eye movement sleep in the rat by actions at A1 and A2a adenosine receptor subtypes with a differential sensitivity to atropine. Neuroscience. 2003;116:913–920. doi: 10.1016/s0306-4522(02)00561-4. [DOI] [PubMed] [Google Scholar]
- Materi and Semba, 2001.Materi LM, Semba K. Inhibition of synaptically evoked cortical acetylcholine release by intracortical glutamate: involvement of GABAergic neurons. Eur J Neurosci. 2001;14:38–46. doi: 10.1046/j.0953-816x.2001.01619.x. [DOI] [PubMed] [Google Scholar]
- Materi et al., 2000.Materi LM, Rasmusson DD, Semba K. Inhibition of synaptically evoked cortical acetylcholine release by adenosine: an in vivo microdialysis study in the rat. Neuroscience. 2000;97:219–226. doi: 10.1016/s0306-4522(00)00075-0. [DOI] [PubMed] [Google Scholar]
- Moruzzi and Magoun, 1949.Moruzzi G, Magoun HW. Brain stem reticular formation and activation of the EEG. Electroencephalogr Clin Neurophysiol. 1949;1:455–473. [PubMed] [Google Scholar]
- Muzur et al., 2002.Muzur A, Pace-Schott EF, Hobson JA. The prefrontal cortex in sleep. Trends Cogn Sci. 2002;6:475–481. doi: 10.1016/s1364-6613(02)01992-7. [DOI] [PubMed] [Google Scholar]
- Okada et al., 1996.Okada M, Mizuno K, Kaneko S. Adenosine A1 and A2 receptors modulate extracellular dopamine levels in rat striatum. Neurosci Lett. 1996;212:53–56. doi: 10.1016/0304-3940(96)12780-4. [DOI] [PubMed] [Google Scholar]
- Okada et al., 1997.Okada M, Kiryu K, Kawata Y, Mizuno K, Wada K, Tasaki H, Kaneko S. Determination of the effects of caffeine and carbamazepine on striatal dopamine release by in vivo microdialysis. Eur J Pharmacol. 1997;321:181–188. doi: 10.1016/s0014-2999(96)00938-7. [DOI] [PubMed] [Google Scholar]
- Opp, 1997.Opp MR. Rat strain differences suggest a role for corticotropin-releasing hormone in modulating sleep. Physiol Behav. 1997;63:67–74. doi: 10.1016/s0031-9384(97)00390-9. [DOI] [PubMed] [Google Scholar]
- Paxinos and Franklin, 2001.Paxinos G, Franklin K. The mouse brain in stereotaxic coordinates. Ed 2. San Diego: Academic; 2001. [Google Scholar]
- Porkka-Heiskanen et al., 1997.Porkka-Heiskanen T, Strecker RE, Thakkar M, Bjorkum AA, Greene RW, McCarley RW. Adenosine: a mediator of the sleep-inducing effects of prolonged wakefulness. Science. 1997;276:1265–1268. doi: 10.1126/science.276.5316.1265. [DOI] [PMC free article] [PubMed] [Google Scholar]
- Porkka-Heiskanen et al., 2000.Porkka-Heiskanen T, Strecker RE, McCarley RW. Brain site-specificity of extracellular adenosine concentration changes during sleep deprivation and spontaneous sleep: an in vivo microdialysis study. Neuroscience. 2000;99:507–517. doi: 10.1016/s0306-4522(00)00220-7. [DOI] [PubMed] [Google Scholar]
- Porkka-Heiskanen et al., 2002.Porkka-Heiskanen T, Alanko L, Kalinchuk A, Stenberg D. Adenosine and sleep. Sleep Med Rev. 2002;6:321–332. doi: 10.1053/smrv.2001.0201. [DOI] [PubMed] [Google Scholar]
- Radulovacki, 2005.Radulovacki M. Adenosine sleep theory: how I postulated it. Neurol Res. 2005;27:137–138. doi: 10.1179/016164105X21814. [DOI] [PubMed] [Google Scholar]
- Rasmusson et al., 2007.Rasmusson DD, Smith SA, Semba K. Inactivation of prefrontal cortex abolishes cortical acetylcholine release evoked by sensory or sensory pathway stimulation in the rat. Neuroscience. 2007;149:232–241. doi: 10.1016/j.neuroscience.2007.06.057. [DOI] [PubMed] [Google Scholar]
- Robert, 1998.Robert C. Knockout mice: advantages and limitations for biological modeling. Definitions, principles and examples. Ann Dermatol Venereol. 1998;125:946–947. [PubMed] [Google Scholar]
- Sonner et al., 1999.Sonner JM, Gong D, Li J, Eger EI, 2nd, Laster MJ. Mouse strain modestly influences minimum alveolar anesthetic concentration and convulsivity of inhaled compounds. Anesth Analg. 1999;89:1030–1034. doi: 10.1097/00000539-199910000-00039. [DOI] [PubMed] [Google Scholar]
- Stenberg et al., 2003.Stenberg D, Litonius E, Halldner L, Johansson B, Fredholm BB, Porkka-Heiskanen T. Sleep and its homeostatic regulation in mice lacking the adenosine A1 receptor. J Sleep Res. 2003;12:283–290. doi: 10.1046/j.0962-1105.2003.00367.x. [DOI] [PubMed] [Google Scholar]
- Steriade and McCarley, 2005.Steriade M, McCarley RW. Brain control of wakefulness and sleep. Ed 2. New York: Plenum; 2005. [Google Scholar]
- Steriade et al., 1990.Steriade M, Datta S, Paré D, Oakson G, Curró Dossi RC. Neuronal activities in brain-stem cholinergic nuclei related to tonic activation processes in thalamocortical systems. J Neurosci. 1990;10:2541–2559. doi: 10.1523/JNEUROSCI.10-08-02541.1990. [DOI] [PMC free article] [PubMed] [Google Scholar]
- Strecker et al., 2000.Strecker RE, Morairty S, Thakkar MM, Porkka-Heiskanen T, Basheer R, Dauphin LJ, Rainnie DG, Portas CM, Greene RW, McCarley RW. Adenosinergic modulation of basal forebrain and preoptic/anterior hypothalamic neuronal activity in the control of behavioral state. Behav Brain Res. 2000;115:183–204. doi: 10.1016/s0166-4328(00)00258-8. [DOI] [PubMed] [Google Scholar]
- Tanase et al., 2003.Tanase D, Baghdoyan HA, Lydic R. Dialysis delivery of an adenosine A1 receptor agonist to the pontine reticular formation decreases acetylcholine release and increases anesthesia recovery time. Anesthesiology. 2003;98:912–920. doi: 10.1097/00000542-200304000-00018. [DOI] [PubMed] [Google Scholar]
- Tung et al., 2002.Tung A, Szafran MJ, Bluhm B, Mendelson WB. Sleep deprivation potentiates the onset and duration of loss of righting reflex induced by propofol and isoflurane. Anesthesiology. 2002;97:906–911. doi: 10.1097/00000542-200210000-00024. [DOI] [PubMed] [Google Scholar]
- Tung et al., 2005.Tung A, Herrera S, Szafran MJ, Kasza K, Mendelson WB. Effect of sleep deprivation on righting reflex in the rat is partially reversed by administration of adenosine A1 and A2 receptor antagonists. Anesthesiology. 2005;102:1158–1164. doi: 10.1097/00000542-200506000-00015. [DOI] [PubMed] [Google Scholar]
- Urade et al., 2003.Urade Y, Eguchi N, Qu WM, Sakata M, Huang ZL, Chen JF, Schwarzschild MA, Fink JS, Hayaishi O. Sleep regulation in adenosine A2A receptor-deficient mice. Neurology. 2003;61:S94–S96. doi: 10.1212/01.wnl.0000095222.41066.5e. [DOI] [PubMed] [Google Scholar]
- Van Dongen et al., 2001.Van Dongen HP, Price NJ, Mullington JM, Szuba MP, Kapoor SC, Dinges DF. Caffeine eliminates psychomotor vigilance deficits from sleep inertia. Sleep. 2001;24:813–819. doi: 10.1093/sleep/24.7.813. [DOI] [PubMed] [Google Scholar]
- Vanini et al., 2008.Vanini G, Watson CJ, Lydic R, Baghdoyan HA. Gamma aminobutyric acid-mediated neurotransmission in the pontine reticular formation modulates hypnosis, immobility, and breathing during isoflurane anesthesia. Anesthesiology. 2008;109:978–988. doi: 10.1097/ALN.0b013e31818e3b1b. [DOI] [PMC free article] [PubMed] [Google Scholar]
- Watson et al., 2006.Watson CJ, Venton BJ, Kennedy RT. In vivo measurements of neurotransmitters by microdialysis sampling. Anal Chem. 2006;78:1391–1399. doi: 10.1021/ac0693722. [DOI] [PubMed] [Google Scholar]
- Yanik and Radulovacki, 1987.Yanik G, Radulovacki M. REM sleep deprivation up-regulates adenosine A1 receptors. Brain Res. 1987;402:362–364. doi: 10.1016/0006-8993(87)90046-1. [DOI] [PubMed] [Google Scholar]