Abstract
The transcription factor Hairy Enhancer of Split 1 (HES1), a downstream effector of the Notch signaling pathway, is an important regulator of hematopoiesis. Here, we demonstrate that in primary erythroid cells, Hes1 gene expression is transiently repressed around proerythroblast stage of differentiation. Using mouse erythroleukemia cells, we found that the RNA interference (RNAi)-mediated depletion of HES1 enhances erythroid cell differentiation, suggesting that this protein opposes terminal erythroid differentiation. This is also supported by the decreased primary erythroid cell differentiation upon HES1 upregulation in Ikaros-deficient mice. A comprehensive analysis led us to determine that Ikaros favors Hes1 repression in erythroid cells by facilitating recruitment of the master regulator of erythropoiesis GATA-1 alongside FOG-1, which mediates Hes1 repression. GATA-1 is then necessary for the chromatin binding of the NuRD remodeling complex ATPase MI-2, the transcription factor GFI1B, and the histone H3K27 methyltransferase EZH2 along with Polycomb repressive complex 2. We show that EZH2 is required for the transient repression of Hes1 in erythroid cells. In aggregate, our results describe a mechanism whereby GATA-1 utilizes Ikaros and Polycomb repressive complex 2 to promote Hes1 repression as an important step in erythroid cell differentiation.
INTRODUCTION
Extracellular signaling, combined with the activities of multiple transcription factors and cofactors, is fundamental for conferring gene expression specificity and, hence, cell fate. Although the erythropoietin receptor constitutes the best-characterized pathway controlling erythroid cell (EryC) formation, other pathways, including stem cell factor/c-kit receptor, wingless-type, Notch, and Sonic Hedgehog, are also implicated (40, 57). In particular, the Notch pathway affects EryC survival, proliferation, and/or differentiation, i.e., EryC homeostasis (4, 13, 20, 21, 23, 29, 46).
Notch1-activating mutations occur in various types of leukemia, including a majority of T-cell acute lymphoblastic leukemias. Moreover, inactivation of Notch signaling can promote specific forms of myeloid-related leukemia (27). The binding of ligands to the Notch extracellular domain triggers a sequential proteolytic cleavage, resulting in nuclear relocalization of the Notch intracellular domain (NICD). A ternary complex composed of the NICD, the transcription factor RBPJ (CBF1; RBPJκ) and the coactivator Mastermind-like is then formed to promote high-level transcription of Notch target genes (8). In the absence of Notch activation, target genes are repressed by a complex composed of RBPJ and corepressors. Other pathways like Sonic Hedgehog (49) and transcription factors, including hypoxia-inducible factor 1α (HIF-1α; Drosophila sigma protein) (33) can also influence the regulation of specific Notch target genes in a Notch-independent manner (also referred to as noncanonical regulation).
The transcription factor GATA-1 is critical for EryC homeostasis (42, 51, 55, 56, 59, 62). The absence of GATA-1 in differentiating embryonic stem cells and in mice results in abnormal EryC maturation and massive apoptosis of proerythrobasts (17). Along with GATA-1, the transcription factor Ikaros acts as a developmental stage-specific repressor of γ-globin genes in EryC (5, 7). This repression is not limited to γ-globin genes, since in primitive and definitive EryC, Ikaros collaborates with GATA-1 to facilitate Gata2 gene repression (5, 7). The absence of Ikaros, such as in Ikaros-null (Iknull) mice, results in a severe defect in B- and T-lymphopoiesis and reduces hematopoietic stem cell activity (38, 58). However, many questions as to why adult Iknull mice also exhibit anemia remain unanswered (38, 45).
Ikaros influences the Notch pathway in lymphoid cells particularly with respect to noncanonical repression of the Notch target gene Hes1 (10, 12). Overexpression of Hes1 interferes with B-lymphoid and myeloid cell maturation (23, 25). HES1 protein is also frequently overexpressed in acute and chronic myeloid leukemia (2, 37) and is implicated in the transcriptional repression of multiple genes encoding factors involved in cellular proliferation and differentiation (14). Whether HES1 plays a positive or a negative role in EryC differentiation is unclear (21, 23).
To define whether GATA-1 participates in the noncanonical Notch signaling in EryC, we investigated the impact of GATA-1 on Hes1 gene regulation in EryC. We demonstrate that the binding of GATA-1 and its cofactor Friend of GATA-1 (FOG-1) to chromatin at the Hes1 promoter is facilitated by Ikaros. Then, alongside FOG-1, GATA-1 mediates Hes1 repression and favors the recruitment of the NuRD remodeling complex ATPase MI-2, the transcription factor GFI1B, and the Polycomb repressive complex 2 (PRC2) subunits EZH2 and SUZ12 to the Hes1 promoter. EZH2 is required for GATA-1-repression of Hes1 in EryC. Moreover, our data support a model in which HES1 directly controls EryC homeostasis, since Hes1 repression promotes terminal EryC differentiation.
MATERIALS AND METHODS
Mouse line.
We utilized a mouse model characterized by the deletion of the c-terminal part of Ikaros, which results in protein instability and the absence of Ikaros protein in all tissues (Iknull) (58). Heterozygous Iknull male and female were bred, and 14.5 days postcoitus (dpc), homozygote Ikwt or Iknull fetal liver cells were isolated. Animal experiments were conducted in accordance with the Canadian Council on Animal Care (CCAC) guidelines and approved by the Maisonneuve-Rosemont Hospital animal care committee.
Cell lines.
G1E-2 (parental GATA-1 null cell line) and G1E-ER4 (GATA-1 null cell line expressing an inducible GATA-1-ER protein) (60) cells were cultured in Iscove's modified Dulbecco's medium (IMDM; Gibco) containing 13% fetal bovine serum (FBS; Sigma), 1.7% penicillin-streptomycin (PS; Wisent), 2 U/ml erythropoietin (Eprex), 1.1 mM 1-thioglycerol (sigma M6145), and 0.5% conditioned medium from a kit ligand-producing CHO cell line. To induce nuclear accumulation of GATA-1-ER, tamoxifen (Sigma) was added to the medium (final concentration, 1 μM) for 24 h. Tamoxifen, an antagonist of the estrogen receptor, was preferred to estrogen since Hes1 expression is modulated by β-estradiol (34). Since tamoxifen is dissolved in ethanol (EtOH), an equal volume of EtOH was added to control dishes.
Mouse erythroleukemia (MEL) (C-88) cells were cultured in Dulbecco's modified Eagle medium containing 10% FBS and 1% PS. To knock down expression of Hes1, pLKO.1 vectors containing short hairpin RNA (shRNA) specific to Hes1 mRNA or a nonspecific scrambled shRNA (shScr) (Sigma) were transfected by electroporation into MEL cells. Puromycin (0.3 μg/ml) was then added to the medium to select for cells with stable integration of pLKO.1 and thus stably expressing the shRNA. Two different shRNA molecules were used to stably knock down Hes1 (sh327 and sh329). The shScr was also stably integrated in MEL cells (control). To induce erythroid differentiation, dimethyl sulfoxide (DMSO) was added to the medium at a 2% final concentration.
Wright-Giemsa.
MEL cells (100,000 to 150,000) or 14.5 dpc fetal liver cells were collected, and staining was performed as previously described (5). Cell morphology was analyzed with a Leica DMRE microscope, and images were acquired with a Qimaging digital camera.
Diaminofluorene and benzidine staining.
Cells (100,000 to 1,000,000) were collected and stained with either diaminofluorene solution (0.01% diaminofluorene [Sigma] dissolved to 1% in 90% glacial acetic acid [Fisher] and 0.3% H2O2 [Fisher] in 0.2 M Tris-HCl [pH 7]) or benzidine solution (0.42% benzidine, 4.2% H2O2, 12.8% glacial acetic acid in H2O). Positive (blue) cells were counted.
RT-PCR and quantitative RT-PCR.
Total RNA was isolated by TRIzol (Invitrogen) and used for cDNA synthesis with oligo(dT)12–18 and SuperScript III reverse transcriptase (Invitrogen). Semiquantitative PCR or quantitative real-time PCR (qPCR) was carried out with specific primers (Table 1). The primer set specific for Actb was used as an internal control, and the primer set specific for Hprt was used as additional control. The transcripts were either detected on an agarose gel with AlphaImager (Cell Biosciences) (semiquantitative analyses) or stained with SYBR green (Invitrogen) and analyzed with the iCycler iQ (Bio-Rad) system (quantitative analyses). The formula of Pfaffl (43) was used to calculate the ratio: (Etarget)ΔCPtarget(control–sample)/(Etarget)ΔCPref(control–sample), where Etarget is target qPCR efficiency, Eref is control qPCR efficiency, CP is crossing point, ΔCPtarget is CP deviation of reference sample versus test sample target gene transcript, and ΔCPref is the CP deviation of the reference sample versus the test sample control transcript.
Table 1.
Oligonucleotides used for RT-qPCR analysis
| Specificity (murine cDNA) | Symbol | Direction | Sequence (5′–3′) |
|---|---|---|---|
| Hairy and enhancer of split 1 | Hes1 | F | ACACCGGACAAACCAAAGAC |
| R | ATGCCGGGAGCTATCTTTCT | ||
| Hypoxanthine guanine phosphoribosyl transferase | Hprt | F | CACAGGACTAGAACACCTGC |
| R | GCTGGTGAAAAGGACCTC | ||
| Actin beta | Actb | F | ATCGTGGGCCGCCCTAGGCACCA |
| R | TCCATGTCGTCCCAGTTGGTAACAA | ||
| Hemoglobin alpha adult chain 1 | Hba-a1 | F | AACTTCAAGCTCCTGAGCCA |
| R | GGCAGCTTAACGGTACTTGG | ||
| Hemoglobin beta adult major chain | Hbb-b1 | F | AACGATGGCCTGAATCACTT |
| R | ACGATCATATTGCCCAGGAG | ||
| Aminolevulinic acid synthase 2 | Alas2 | F | GCAGCAGCTATGTTGCTACG |
| R | ACAGGTTGGTCCTTGAGTGG | ||
| Kruppel-like factor 1 | Klf1 | F | ACCACCCTGGGACAGTTTCT |
| R | GAAGGGTCCTCCGATTTCAG | ||
| BCL2-like 1 | Bcl2l1 | F | GGGATGGAGTAAACTGGGGT |
| R | TGCAATCCGACTCACCAATA | ||
| Erythropoietin receptor | Epor | F | TACCTCCCACTCCACCTCAC |
| R | GCTCTGAGTCTGGGACAAGG | ||
| Transcription factor Pu.1 | Pu.1 | F | CACGTCCTCGATACTCCCAT |
| R | GCTGGGGACAAGGTTTGATA | ||
| Transferrin receptor 2 | Trfr2 | F | CTGCCGCTAGACTTCGGCCG |
| R | CGCCGCACGGATGTAGTCCC | ||
| Notch gene homolog 1 | Notch1 | F | TGTTGTGCTCCTGAACAACG |
| R | GTGGGAGACAGAGTGGGTGT |
An unpaired Student's t test was used to determine the levels of statistical significance (P value).
Western blot analysis and protein immunoprecipitation.
For Western blotting, two million cells were lysed in saline solution (1 mM phenylmethylsulfonyl fluoride [PMSF], 150 mM NaCl) and sonicated. Supernatants collected after centrifugation were diluted 1:2 in sample loading buffer (50 mM Tris HCl [pH 6.8], 10% glycerol, 2% sodium dodecyl sulfate [SDS], 0.1% bromophenol blue, 2.5% β-mercaptoethanol), migrated on SDS-polyacrylamide gel electrophoresis (PAGE), and transferred to polyvinylidene fluoride (PVDF) membranes (Santa Cruz). HES1 (Millipore), GATA-1 (N-6; Santa Cruz), GATA-2 (Santa Cruz), EZH2 (Millipore), GFI1B (Santa Cruz), SUZ12 (Cell Signaling), or CDK9 (Santa Cruz) and horseradish peroxidase (HRP)-conjugated antibody (eBioscience) were used for immunoblotting. Membranes were revealed with Western Lightning Plus enhanced chemiluminescence (ECL) (PerkinElmer) on a Fujifilm LAS-4000 luminescent image analyzer. GAPDH (Millipore) or actin (NeoMarkers) antibody was used as a loading control.
Immunoprecipitations (IP) were carried out as described before, with modifications (5). For standard IP, the lysis buffer composition was 150 mM NaCl, 20 mM HEPES (pH 7.9), 0.2 mM EDTA, 1.5 mM MgCl2, 0.5% NP-40, 25% glycerol, 1 mM PMSF, 1 μg/ml aprotinin, and protease inhibitor cocktail (P8340; Sigma). For DNase I, RNase I, and ethidium bromide (EtBr) IP assays, DNase (1 μg/ml; Sigma), RNase (1 μg/ml; Sigma), and EtBr (50 μg/ml; Sigma) were added to the lysis buffer. GATA-1, EZH2, or isotype-matched immunoglobulins were utilized for IP.
Chromatin immunoprecipitation (ChIP) and quantitative real-time PCR assays.
The ChIP assay was carried out per the manufacturer's instructions (Millipore) and as described previously (5). Briefly, cells were cross-linked in 1% formaldehyde for 10 min at 37°C and sonicated to obtain chromatin fragments of 400 to 800 bp on average. Antibodies used for ChIP were directed against diacetylated histone H3 (K9 and K14) and trimethylated histones H3K27, histone deacetylase 1 (HDAC1) and EZH2 (AC22) (Millipore); TFIID (TBP; SI-1), Ikaros (E-20), GATA-1 (N6), polymerase II (Pol II) (N-20), FOG-1 (M-20), MI-2 (H-242), GFI1B (D-19), and RBPJ (D-20) (Santa Cruz); SUZ12 (D39F6) (Cell Signaling); and activated Notch1 (Abcam). Isotype-matched IgG (Santa Cruz) was used as a control. About 1/30 of immunoprecipitated and unbound (input) material was used as the template for quantitative real-time PCR (qPCR), with one primer set specific for Hes1 or Notch1 promoter and another primer set specific for the internal control (kidney-specific Tamm-Horsfall promoter; Thp). Control qPCRs were performed to assess the specificity of the ChIP with primers specific for β-globin HS2, βmaj, Gata2 −2.8 enhancer, Gata2 promoter 1G, and Amy (Table 2). Reactions were performed using SYBR green (Invitrogen) with the iCycler iQ (Bio-Rad). Fold enrichment was quantified according to the 2−ΔΔCT method: 2−[(CTChIPtest − CT inputtestt) − (CT ChIPcontrol − CT inputcontrolt)], where CT is threshold cycle, CT ChIP is the CT value for the ChIP sample, CT input is the CT value for the input sample, test is the primer set of interest, and control is the internal control primer set.
Table 2.
Oligonucleotides used for ChIP analysis
| Specificity (murine genomic DNA) | Symbol | Direction | Sequence (5′–3′) |
|---|---|---|---|
| Hairy and Enhancer of Split 1 gene promoter (pro1) | Hes1 (pro1) | F | CTCTTCCTCCCATTGGCTGA |
| R | GCACCAGCTCCAGATCCTGT | ||
| Hairy and Enhancer of Split 1 gene promoter (pro2) | Hes1 (pro2) | F | GGAAGTTTCACACGAGCCGT |
| R | GCACCAGCTCCAGATCCTGT | ||
| Hairy and enhancer of split 1 gene open reading frame | Hes1 (ORF) | F | TGGCGGCTTCCAAGTGGTGC |
| R | TGTGAGCGAAGGCCCCGTTG | ||
| Tamm-Horsfall protein (uromodulin) gene promoter | Thp | F | GGTGGATGGTGTGGTCACAAC |
| R | GGTCTTGACACACCAGCTTT | ||
| Pancreatic alpha-amylase promoter | Amy2 | F | TCAGTTGTAATTCTCCTTGTAGGG |
| R | CCTCCCATCTGAAGTATGTGGGTC | ||
| Hypersensitive site 2 from β-globin locus | HS2 | F | CCTTGCCTGTTCCTGCTCA |
| R | CACATGTGACCTGTCTGCCAG | ||
| Hemoglobin beta adult major chain gene promoter | βmaj | F | CAGTGAGTGGCACAGCATCC |
| R | CAGTCAGGTGCACCATGATGT | ||
| Gata2 kb −2.8 enhancer | Gata2 −2.8 | F | GCATGGCCCTGGTAATAGCA |
| R | CAGCCGCACCTTCCCTAA | ||
| Gata2 promoter 1G | Gata2 1G | F | AGATACCCAGAAGGTGCACGTC |
| R | GCAGACCCTGCACCCCT | ||
| Kit oncogene gene promoter | c-kit | F | CACCTCCACCATAAGCCGAAT |
| R | CTCCTAGACAATAAAGGACAACCA | ||
| Notch gene homolog 1 promoter | Notch1 | F | GCATGAGAGGCTGTGTTGACG |
| R | TGGCTGTGTCCGACTTAGGTG |
Unpaired Student's t test was used to determine the levels of statistical significance (P value).
Cell sorting.
Three 14.5 dpc fetal livers were washed and resuspended in PBS–5% heat-inactivated FBS. Cells were incubated for 30 min on ice with rat anti-Ter119, anti-rat fluorescein isothiocyanate (FITC)-conjugated (BD Pharmingen), and phycoerythrin (PE)-conjugated anti-CD71 (Biolegends) and sorted by high-speed fluorescence-activated cell sorting (FACS Vantage; Becton, Dickinson).
COS-7 and G1E-ER4 transfection.
The pEGFP-N1 vector containing the FLAG-tagged hemagglutinin (HA)-conjugated Ikaros cDNA (5) was used to transiently transfect COS-7 cells. The pGFP-V-RS vector (OriGene) transcribing the shRNA molecule 381 or 382 (both, directed against EZH2 RNA), MI-2-1 or MI-2-2 (against MI-2 RNA), or GFI1B-1 or GFI1B-2 (against GFI1B) or the nonspecific shRNA molecule shScr were used in transient transfections of G1E-ER4 cells. Transfections were made with Lipofectamine (Invitrogen) or with the Nucleofector apparatus (Amaxa; kit R) according to the manufacturer's instructions. Cells were harvested 36 h posttransfection. Note that Ikaros was tagged with FLAG and HA, and green fluorescent protein (GFP) is not expressed in the pEGFP-N1 construction containing Ikaros-HA.
RESULTS
Levels of Hes1 expression and erythroid cell differentiation.
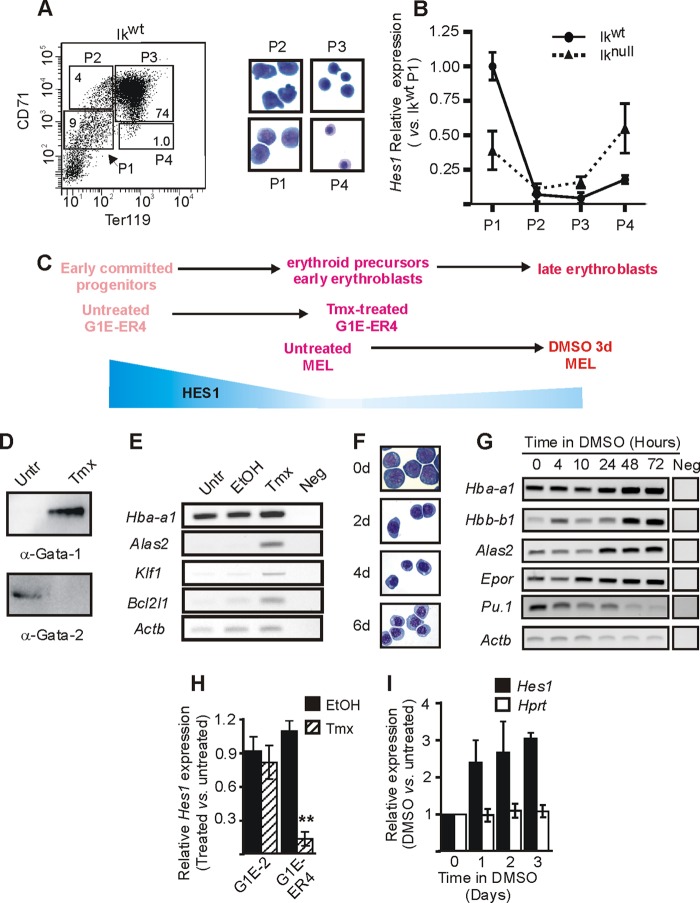
To define the expression levels of Hes1 during erythroid cell (EryC) differentiation, we made use of fluorescence-activated cell sorting (FACS) and isolated four populations of cells from 14.5 day postcoitus (dpc) mouse fetal livers corresponding to different stages of EryC maturation (53, 65). At this time of development, the mouse fetal liver is mostly composed of EryC (>80%) (53). We selected four populations of cells according to the expression levels of the cell surface markers CD71 (transferrin receptor; expressed on proliferating cells) and Ter119 (erythroid cell specific) (Fig. 1A). More than 90% of cells from the P1 population are erythroid progenitors (65). This population contains burst-forming unit erythroid (BFU-E) progenitors and is enriched in erythroid progenitors of CFU erythroid (CFU-E) cells. P2 and P3 populations are made up of proerythroblasts, basophilic, and chromatophilic erythroblasts. P2 and P3 cells expressed about 15 to 20 times less Hes1 than P1 cells (Fig. 1B, Ikwt). Hes1 expression was about 4-fold higher in P4 (orthochromatic erythroblasts) than P3 cells. Thus, Hes1 is transiently downregulated at the proerythroblast and basophilic erythroblast stages of EryC differentiation.
Fig 1.
Hes1 regulation during erythroid differentiation. (A and B) Ikaros wild-type (Ikwt) and Ikaros-null (Iknull) 14.5 dpc fetal livers were collected and sorted on the basis of Ter119 and CD71 expression levels. (A) (Left) FACS dot plot representation of the four sorted populations from Ikwt fetal livers. P1, CD71med Ter119neg/low; P2, CD71high Ter119neg/low; P3, CD71high Ter119high; P4, CD71med/Ter119high. (Right) Wright-Giemsa-staining of Cytospin preparations of sorted fetal liver cells. P1 is enriched in erythroid precursors (BFU-E and CFU-E), P2 is enriched in proerythroblasts and early basophilic erythroblasts, P3 is enriched in basophilic and chromatophilic erythroblasts, and P4 is enriched in orthochromatic erythroblasts (53). (B) Relative expression of Hes1 with standard deviations in each population. Relative expression was calculated according to Pfaffl (43) using Actb as the internal control. (C) Comparative schematic representation of erythroid cell differentiation in different model systems. A schematic view of Hes1 relative expression levels is in blue. (D, E, and H) Untreated (Untr), ethanol (EtOH)-treated or tamoxifen (Tmx)-treated G1E-ER4 cells were used for expression analyses. (D) Western blot analysis of GATA-1 and GATA-2 expression in nuclear protein extract. Antibodies used for the immunodetection are indicated under each panel. (E) Agarose gels presenting the semiquantitative mRNA expression analysis of Hba-a1, Alas2, Klf1, Bcl2l1, and Actb. Neg, semiquantitative RT-PCR performed without mRNA template. (H) Bar graph presenting the relative expression of the Hes1 gene measured by qRT-PCR. Standard deviations are indicated. Relative expression was calculated according to Pfaffl (43) using Actb as the internal control. (F, G, and I) Untreated (Untr) or DMSO-treated MEL cells were used for analyses. (F) Wright-Giemsa-staining of Cytospin preparations of cells induced with DMSO for 0, 2, 4, and 6 days (d). (G) Agarose gels presenting the semiquantitative mRNA expression analysis of the differentiation marker genes Hba-a1, Hbb-b1, Alas2, Epor, Spfi1 (Pu.1), and Actb (15, 30, 39). RT-PCR was performed on untreated cells or cells treated with DMSO for different times. Neg, RT-PCR performed without mRNA template. (I) Relative expression of Hes1 and Hprt (negative control) genes measured by qRT-PCR as a function of time in DMSO. Standard deviations are indicated. Relative expression was calculated according to Pfaffl (43) using Actb as the internal control.
To further define the variable Hes1 expression during EryC differentiation, the model cell lines G1E-ER4 (60, 61) and mouse erythroleukemia (MEL) cells (52) were used. These model cell lines are well defined and recapitulate different segments of EryC differentiation (Fig. 1C). G1E-ER4 cells are deficient for endogenous GATA-1 but express an estrogen-dependent form of GATA-1 (GATA-1 fused to estrogen receptor [GATA-1-ER] (60). Treatment of the cells with tamoxifen induced the nuclear accumulation of GATA-1-ER (26) and expression of GATA-1 target genes (Fig. 1D and E). These changes in gene expression trigger G1E-ER4 cell differentiation from cells resembling erythroid progenitors to basophilic erythroblast-like cells (44, 60, 61, 63). MEL cells, the second model, resemble proerythroblasts and can differentiate into orthochromatic normoblasts in the presence of DMSO (Fig. 1F). EryC differentiation is promoted by the variable expression of specific genes, some of which are also regulated during MEL cell differentiation (Fig. 1G). In both models, we measured Hes1 mRNA expression and found that Hes1 was downregulated in tamoxifen-induced G1E-ER4 cells compared to ethanol (tamoxifen diluent)-treated or uninduced cells (Fig. 1H and data not shown). Tamoxifen induction had no effect on Hes1 expression in G1E-2 cells, the GATA-null parental cell line (Fig. 1H). The expression level of Hes1 is 3-fold higher in DMSO-treated MEL cells than in untreated MEL cells (Fig. 1I). This variation of Hes1 expression is reminiscent of observations made at late EryC differentiation stages in primary fetal liver EryC (Fig. 1B).
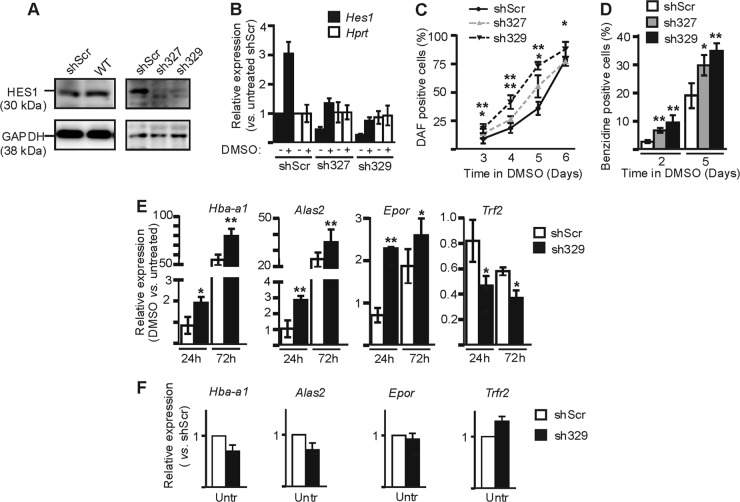
Perturbing Hes1 expression and/or HES1 function is likely to severely impact cellular identity, since it is central to establishing and maintaining a genetic network that controls cell fate. Thus, to clarify the role of HES1 in EryC and to assess the potential biological relevance of the increased HES1 expression observed at late stages of EryC differentiation, we investigated whether reducing Hes1 expression (Hes1kd) in MEL cells by stable expression of specific shRNA could influence MEL cell functions. MEL cells were then stably transfected with the pLKO.1 vector coding for shRNA directed against Hes1 mRNA or with that coding for a nonspecific shRNA (shScr). The expression of HES1 was similar in shScr and wild-type cells, but little to no HES1 protein was detectable by Western blotting with two constructs (sh327 and sh329) (Fig. 2A). By quantitative RT-PCR (qRT-PCR) assay, we observed a decrease in Hes1 but not Hprt (hypoxanthine guanine phosphoribosyl transferase) expression in Hes1kd cells with either one of these constructions (decreased expression of 55% and 73% with sh327 and sh329, respectively) relative to control cells (shScr) (Fig. 2B). Then, the actin gene (Actb) was used as the internal control and Hprt expression was used as the negative control. We tested the ability of HES1-depleted MEL cells to undergo differentiation. As in the control cells, residual Hes1 expression was upregulated in knockdown cells after DMSO induction (Fig. 2B). We evaluated the differentiation of MEL cells by hemoglobin staining with diaminofluorene (DAF) or benzidine (Fig. 2C and D). Comparison of the slopes of curves obtained by calculation of percentages of DAF-positive cells over time after DMSO induction of MEL shSrc versus sh327 and sh329 (Fig. 2C) suggested a more rapid differentiation of MEL cells following Hes1 knockdown. This is supported by the benzidine staining analysis (Fig. 2D) and by variations in expression levels of differentiation marker genes in Hes1kd cells relative to control cells (Fig. 2E). Upon DMSO induction, the upregulation of Hba-a1, Alas2, and Epor genes, three genes with higher expression levels in differentiated EryC, was significantly enhanced in cells deficient for Hes1 (Fig. 2E). Concomitantly, Trfr2 expression, which is downregulated during EryC differentiation, was further decreased in Hes1kd cells (Fig. 2E). This effect of Hes1 level is specific to differentiating EryC, since the relative expression of these genes was not affected in uninduced shHes1 versus shScr cells (Fig. 2F).
Fig 2.
Hes1 influence on MEL cell differentiation. MEL cells were stably transfected with vectors expressing shRNA directed against Hes1 mRNA (shHes1 [sh327 or sh329]) or with a nonspecific scrambled shRNA (ShScr). (A) Western blot analysis of HES1 and GAPDH (control) expression in whole-cell extracts of uninduced cells. The antibodies used for the immunodetections as well as specific bands and their corresponding molecular masses are presented. (B) Relative expression of Hes1 and Hprt (negative control) as a function of DMSO induction measured by qRT-PCR. Standard deviations are indicated. Relative expression was calculated according to Pfaffl (43) using Actb as the internal control. −, uninduced cells; +, cells induced with DMSO for 3 days. (C and D) Percentage of diaminofluorene (DAF)-positive cells (C) or benzidine-positive cells (D), with standard deviations, as a function of time in DMSO. Asterisks (*, P < 0.01; **, P < 0.005) indicate significant differences between the value for sh327 or sh329 and that for shScr according to Student's t test. (E and F) Relative expression of Hba-a1, Alas2, Epor, and Trfr2 as a function of DMSO induction as described for panel B. Untr, untreated cells. Asterisks (*, P < 0.05; **, P < 0.001) indicate significant differences between the values for sh329 and shScr according to Student's t test.
Ikaros and Hes1 gene regulation in erythroid cells.
To define the importance of Ikaros in Hes1 gene regulation in EryC, we used total 14.5 dpc fetal liver cells extracted from mouse embryos that do not express Ikaros (Iknull). The absence of Ikaros had no significant effect on EryC morphology or viability (compared to wild-type fetal liver EryC [Ikwt]) (Fig. 3A) (5). However, Iknull fetal livers are smaller, most likely because of the role of Ikaros in production of hematopoietic precursors (Fig. 3B) (38). In Iknull cells, we observed that Hes1 expression was increased 3-fold in total fetal liver (Fig. 3C). More precisely, Hes1 expression was increased in the basophilic-chromatophilic-orthochromatophilic erythroid populations P3 and P4 (Fig. 1B), where the number of cells was significantly reduced in Iknull versus Ikwt fetal liver (Fig. 3D and E). Thus, the absence of Ikaros leads to the abnormal upregulation of Hes1 and interferes with normal terminal erythroid differentiation at 14.5 dpc (Fig. 3C to E). Furthermore, the increased number of cells and downregulation of Hes1 in the Iknull P1 population suggest that HES1 and Ikaros exert effects in erythroid progenitors opposite those of differentiated EryC (Fig. 1B and 3E).
Fig 3.
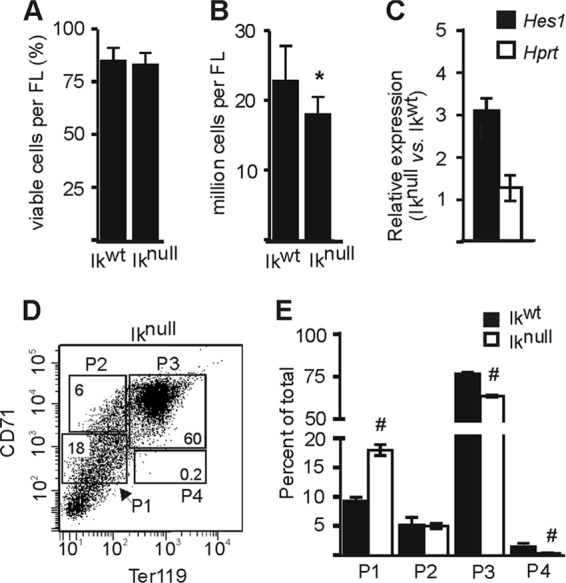
Ikaros involvement in erythroid differentiation and Hes1 regulation in 14.5 dpc fetal liver EryC. (A and B) Ikwt and Iknull total 14.5 dpc fetal liver cells (EryC) were subjected to a viable-cell count by trypan blue exclusion. These results were obtained from at least 15 fetal livers of each background. Bar graphs show the percentage of viable cells (A) or the number of viable cells (B) per fetal liver for each background with standard deviations. *, P < 0.001 (significant differences between the values for Iknull and Ikwt cells according to Student's t test). (C) Relative expression of Hes1 or Hprt (negative control) genes in Ikwt and Iknull total 14.5 dpc fetal liver cells with standard deviations. Relative expression was calculated according to Pfaffl (43) using Actb as the internal control. (D) FACS dot plot representation of the four sorted populations from Iknull fetal livers (populations are described in the legend to Fig. 1A). (E) Percentages of cells in each sorted population of Ikwt and Iknull cells. #, P < 0.05 (significant difference between the values for Iknull and Ikwt cells according to Student's t test).
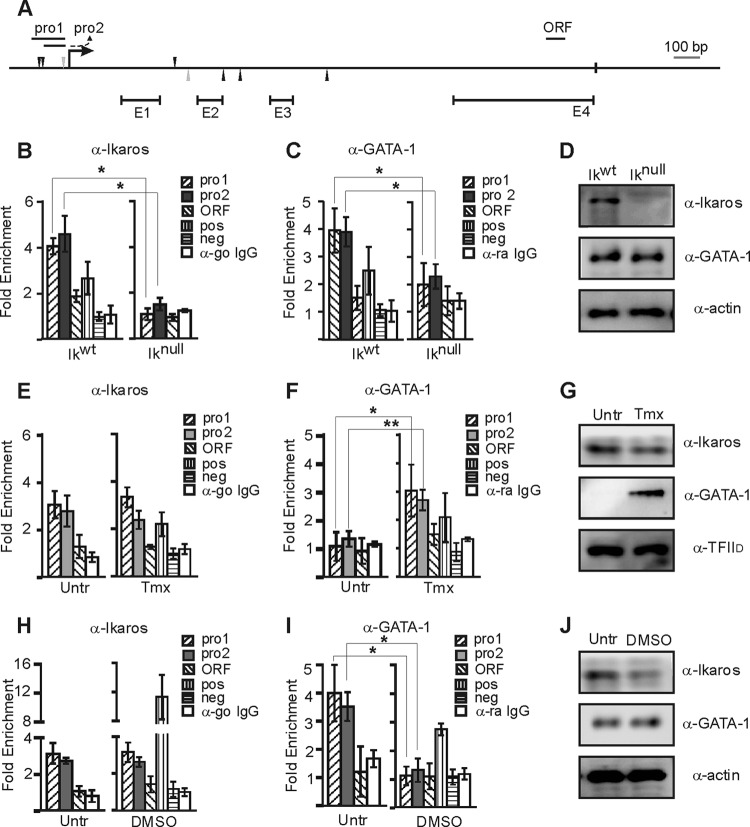
We tested whether Ikaros directly represses Hes1 using a chromatin immunoprecipitation (ChIP) assay. The chromatin binding of Ikaros to the Hes1 promoter was detected with two independent but partially overlapping primer sets (pro1 and pro2) (Fig. 4A). In Ikwt EryC, we detected a 3.5-fold enrichment of Ikaros at the repressed Hes1 promoter relative to a nontarget promoter (Thp; negative control) (Fig. 4B). However, Ikaros was not significantly recruited to the Hes1 open reading frame (ORF). The Amy promoter was used as a negative control, and the GATA-2 1G enhancer was used as a positive control (5) for the Ikaros ChIP analysis. As expected, in Iknull EryC an enrichment value of 1 was obtained at the Hes1 gene (same as observed at Thp promoter) (Fig. 4B). We obtained similar results when ChIP was performed with isotype-matched IgG, confirming the specificity of the antibody. Since Ikaros occupies the Hes1 promoter in Ikwt EryC and Hes1 expression was elevated in Iknull cells (Fig. 3C), we conclude that Ikaros directly represses Hes1 transcription in fetal liver EryC.
Fig 4.
Ikaros and GATA-1 recruitment to the Hes1 promoter in EryC. (A) Schematic representation of Hes1 gene. Potential Ikaros (black triangles) and GATA-1 (gray triangles) binding sites, the transcription start site (arrow), the stop codon (black box), exons (E), and amplicons used for ChIP (pro1, pro2, and ORF) are indicated. (B to J) EryC were collected for ChIP and Western blot analyses, including Ikwt or Iknull total fetal livers (B to D), untreated (Untr) or tamoxifen (Tmx)-treated G1E-ER4 cells (E to G), and untreated (Untr) MEL cells or MEL cells treated with DMSO for 3 days (DMSO) (H to J). Bar graphs present the relative recruitment of Ikaros (B, E, and H) or GATA-1 (C, F, and I) to the Hes1 promoter, expressed as fold enrichment with standard deviations. ChIP was performed with anti-Ikaros (α-Ikaros) or α-GATA-1 and analyzed by qPCR. Fold enrichments were calculated with the 2−ΔΔCT formula, where the Thp (Tamm-Horsfall protein) promoter was the internal control. Hes1 was amplified with three different primer sets as described for panel A; regions amplified for the positive control (pos) were β-globin HS2 (α-GATA-1) and 1G enhancer of Gata2 (α-Ikaros), and the negative control (neg) was the Amy promoter. ChIP was also performed with isotype-matched immunoglobulin G (go, goat; ra, rat) and analyzed by qPCR with pro2 primer set. *, P < 0.05 (significant differences between the values for Iknull and Ikwt cells, untreated and Tmx-treated cells, and untreated and DMSO-treated cells according to Student's t test). (D, G, and J) Western blot analyses of GATA-1, Ikaros, and actin (control) expression in whole-cell extracts or nuclear extracts for G1E-ER4 cells using TFIID as a control (G). The antibodies used for the immunodetections are indicated.
Ikaros facilitates GATA-1 chromatin occupancy and the subsequent repression of Hes1 gene.
GATA-1 can coregulate genes with Ikaros (5), and the analysis of the Hes1 promoter revealed the presence of a conserved GATA binding site ∼100 bp downstream of the Ikaros binding sites (Fig. 4A). Using the ChIP assay, we tested whether GATA-1 occupies the Hes1 promoter in Ikwt fetal liver EryC. While GATA-1 occupied the Hes1 promoter in Ikwt cells, GATA-1 occupancy was significantly reduced in Iknull EryC (Fig. 4C), although its protein level was maintained (Fig. 4D). GATA-1 binding was detected at the Hes1 promoter with two independent primer sets but not at the ORF. Since it is not active in EryC, the Amy promoter was used as a negative control, and the β-globin HS2 region—where GATA-1 binds chromatin in EryC—was the positive control for the GATA-1 ChIP analysis. A ratio of 1 was obtained when ChIP was performed with isotype-matched IgG, confirming the specificity of the antibody. Thus, Ikaros facilitates the binding of GATA-1 to Hes1 promoter chromatin in primary EryC.
To test whether GATA-1 mediates Hes1 repression, we used G1E-ER4 cells. Ikaros protein levels and recruitment were similar in noninduced, EtOH-treated (tamoxifen diluent), and tamoxifen-induced G1E-ER4 cells (Fig. 4E and data not shown) even if Ikaros expression is slightly decreased in G1E-ER4 induced cells (Fig. 4G). As expected, GATA-1 (GATA-1-ER) was recruited to the Hes1 promoter only in tamoxifen-induced cells (Fig. 4F). Ikaros and GATA-1 were also detected at the repressed Hes1 promoter in MEL cells (Fig. 2B, 4H, and 4I). The GATA-1-impaired recruitment to the Hes1 promoter in DMSO-treated cells could not be linked to a variation in GATA-1 protein levels (Fig. 4J). Thus, GATA-1 is not required for Ikaros occupancy at the Hes1 promoter, but Ikaros favors GATA-1 occupancy at the Hes1 promoter. GATA-1 represses Hes1 transcription.
Recruitment of a GATA-1-nucleated repressive complex to Hes1 promoter.
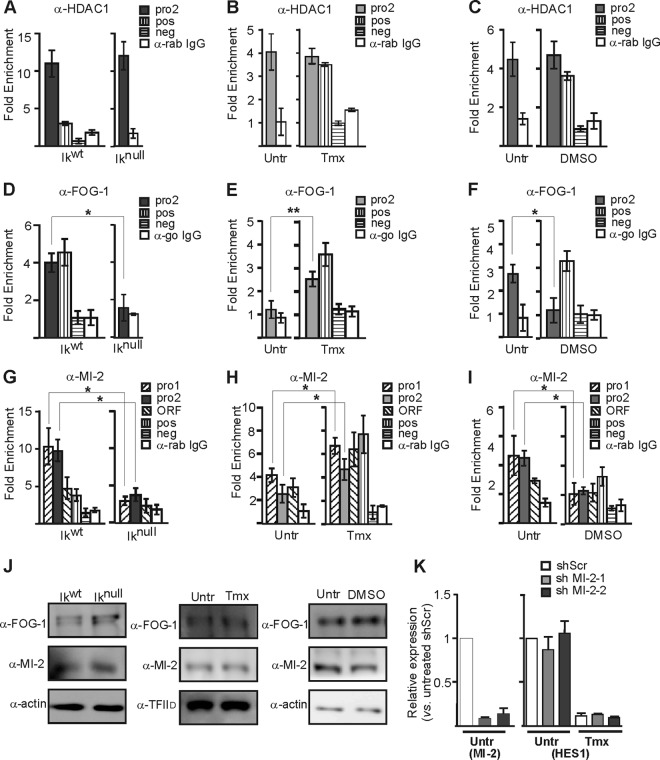
The histone deacetylase HDAC1 and the chromatin remodeling factor MI-2 can be associated with gene repression. These factors interact with Ikaros and GATA-1 directly or via FOG-1 and with Ikaros (18, 22, 28, 47). The interaction of MI-2 with GATA-1 was shown to be indirect and occurs through FOG-1 (18, 22, 28, 47). HDAC1 occupancy to the Hes1 promoter was insensitive to changes in Hes1 expression in the three distinct systems—fetal liver EryC, G1E-ER4, and MEL cells (Fig. 5A to C). However, FOG-1 and MI-2 occupancy was compromised in Iknull EryC as well as in DMSO-induced MEL cells, suggesting that Ikaros and GATA-1 establish and/or maintain these factors at the Hes1 promoter (Fig. 5D, F, G, and I). This is further supported by the observation that the binding of GATA-1 in tamoxifen-treated G1E-ER4 cells favored the recruitment of FOG-1 and MI-2 (Fig. 5E and H) (mRNA ratios for tamoxifen-treated versus untreated cells were 0.99 ± 0.24, 0.53 ± 0.13, 1.07 ± 0.18, and 0.62 ± 0.15 for Ezh2, Mi-2, Gfi1b, and Suz12, respectively). FOG-1 and MI-2 protein levels are not influenced by the absence of Ikaros or GATA-1 or by DMSO treatment (Fig. 5J).
Fig 5.
Cofactor recruitment to the Hes1 promoter in EryC. EryC were collected for ChIP and Western blot analyses: Ikwt or Iknull total fetal livers (A, D, G, and J), untreated (Untr) or tamoxifen (Tmx)-treated G1E-ER4 cells (B, E, H, and J), and untreated (Untr) MEL cells or MEL cells treated with DMSO for 3 days (DMSO) (C, F, I, and J). Bar graphs present the relative recruitment of HDAC1 (A to C), FOG-1 (D to F), or MI-2 (G to I) to the Hes1 promoter, expressed as fold enrichment with standard deviations. ChIP was performed with anti-HDAC1, anti-FOG-1, anti-MI-2, or isotype-matched immunoglobulin G (go, goat; rab, rabbit) and analyzed by qPCR as described for Fig. 4. Regions amplified as positive controls (pos) were the −2.8 enhancer of Gata2 (anti-HDAC1 and anti-MI-2) and β-globin HS2 (anti-FOG-1), and the negative control (neg) was the Amy promoter. *, P < 0.05; **, P < 0.01 (significant differences between values for Iknull and Ikwt cells, untreated and Tmx-treated cells, and untreated and DMSO-treated cells according to Student's t test). (J) Western blots of FOG-1, MI-2, and actin (control) expression in whole-cell extracts or in nuclear extracts for G1E-ER4 cells using TFIID as a control. (K) G1E-ER4 cells were stably transfected with vectors expressing shRNA directed against Mi-2 mRNA (shMI-2-1 or shMI-2-2) or with a nonspecific scrambled shRNA (shScr). shMI-2-1 and shMI2-2 express, respectively, 9% and 15% of the normal MI-2 expression level in Tmx-treated G1E-ER4 cells. Relative expression of Mi-2 or Hes1 in cells with shScr, shMI-2-1, or shMI-2-2 was measured by RT-qPCR in untreated (Untr) or tamoxifen (Tmx)-treated cells. Standard deviations are indicated. The relative expression was calculated according to Pfaffl (43) using Actb as an internal control.
The knockdown of MI-2 was made to define the importance of this remodeling factor in Hes1 repression in EryC. The MI-2 knockdown, obtained independently with two shRNA molecules (shMI-2-1 and shMI-2-2), had no significant effect on the expression levels of Hes1 in uninduced or tamoxifen-treated G1E-ER4 cells (Fig. 5K). Similarly, MI-2 knockdown had no influence on the expression of IKZF1 (Ikaros) or Gata-1-ER in tamoxifen-treated GIE-ER4 cells (data not shown).
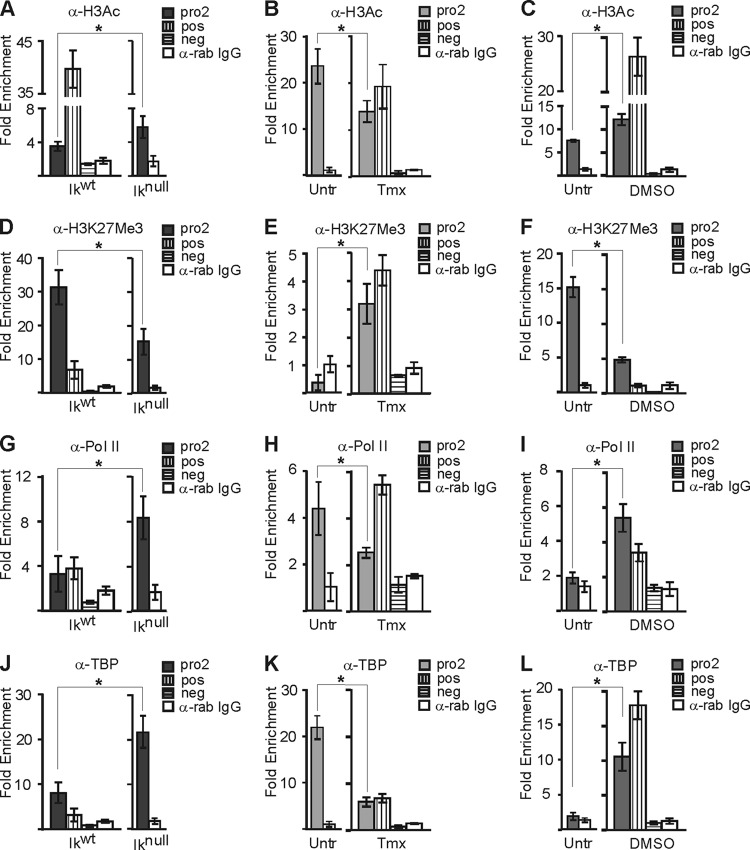
To identify the potential mechanism(s) involved in Hes1 repression, we next investigated epigenetic and transcriptional mechanisms operational at the Hes1 promoter. Lysine 9 and 14 acetylation of H3 (H3Ac) is generally enriched at active genes. We detected significant increases of this epigenetic mark at the Hes1 promoter in Iknull EryC, in noninduced G1E-ER4 cells, and in differentiated MEL cells (Fig. 6A to C). Trimethylation of H3 lysine 27 (H3K27me3) was decreased in Iknull EryC and DMSO-induced MEL cells (Fig. 6D and F). Furthermore, the analysis with G1E-ER4 cells provided evidence that GATA-1 induces and/or stabilizes H3K27me3 at the Hes1 promoter (Fig. 6E). Together, Ikaros and GATA-1 can act on chromatin-promoter organization as well as on transcription elongation (5, 7). Therefore, to complement this chromatin analysis, we looked at the formation of the preinitiation complex (PIC), which is composed of RNA polymerase II (Pol II) and general transcription factors, at the Hes1 promoter. Consistent with the higher expression levels of Hes1, recruitment of Pol II and TATA-binding protein (TBP) were enhanced in Iknull EryC, untreated G1E-ER4 cells, and differentiated MEL cells (Fig. 6G to L). The detection of H3Ac, Pol II, and TBP at the repressed Hes1 promoter could be indicative of a mechanism of priming of this promoter for potential activation at a later point during EryC differentiation (6, 24, 63). However, it cannot be excluded that these results account for a mix of active and repressed Hes1 alleles in the population of cells.
Fig 6.
Histone posttranslational modifications and PIC assembly on the Hes1 promoter in EryC. EryC were collected for ChIP analysis: Ikwt or Iknull total fetal livers (A, D, G, and J), untreated (Untr) or tamoxifen (Tmx)-treated G1E-ER4 cells (B, E, H, and K), and untreated (Untr) MEL cells or MEL cells treated with DMSO for 3 days (DMSO) (C, F, I, and L). Bar graphs present the relative recruitment of acetylated H3 (H3Ac) (A to C), trimethylated lysine 27 of H3 (H3K27me3) (D to F), Pol II (G to I), or TBP (J to L) to the Hes1 promoter, expressed as fold enrichment with standard deviations. ChIP was performed with anti-H3Ac, anti-H3K27me3, anti-Pol II, anti-TBP, or isotype-matched immunoglobulin G (rab, rabbit) and analyzed by qPCR as described for Fig. 4. Regions amplified for positive control (pos) were β-globin HS2 (anti-H3Ac), −2.8 enhancer of Gata2 (anti-H3K27Me3), and βmaj (anti-Pol II and anti-TBP), and the negative control (neg) was the Amy promoter (anti-H3Ac, anti-Pol II, and anti-TBP) and βmaj (anti-H3K27Me3). *, P < 0.05 (significant differences between values for Iknull and Ikwt cells, untreated and Tmx-treated cells, and untreated versus DMSO-treated cells, according to Student's t test).
ChIP experiments and results obtained at Hes1 were validated by the controls and IgG results (Fig. 6).
GATA-1-dependent recruitment of PRC2 to the Hes1 promoter.
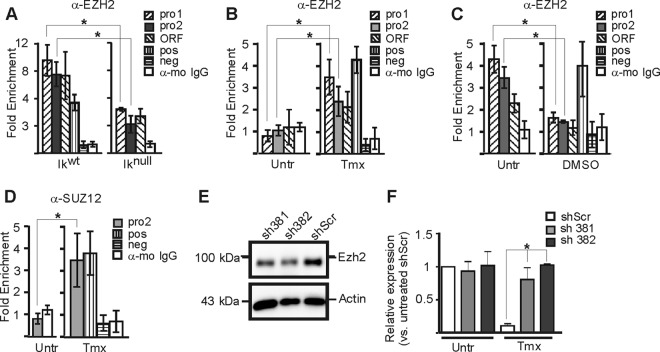
The enrichment of H3K27me3 at the repressed Hes1 promoter (Fig. 6D to F) led us to investigate the recruitment of EZH2, a methyltransferase of the PRC2 required for trimethylation of H3K27 in mammalian cells. In Ikwt EryC, tamoxifen-treated G1E-ER4 cells and in uninduced MEL cells, EZH2 was recruited to the repressed Hes1 promoter (Fig. 7A to C; also, see above). In uninduced G1E-ER4 cells, EZH2 was not recruited to the Hes1 promoter, and hence, H3K27me3 was absent (Fig. 6E and 7B). Similarly, SUZ12, another component of PRC2, was recruited to the Hes1 promoter only in the presence of GATA-1 at Hes1 (Fig. 7D; also, see above). EZH2 binding to the Hes1 promoter was impaired in Iknull EryC and was abolished in differentiated MEL cells, i.e., when Hes1 expression was increased (Fig. 7A and C). The implication of EZH2 in Hes1 regulation is further supported by the Hes1 gene expression analysis in G1E-ER4 cells whereby EZH2 is depleted by knockdown (Fig. 7E and F). In EZH2-depleted G1E-ER4 cells, Hes1 expression is maintained after tamoxifen induction, which indicates that the absence of EZH2 impairs GATA-1-mediated Hes1 silencing.
Fig 7.
PRC2 influence on the Hes1 promoter repression in EryC. (A to D) EryC were collected for ChIP analysis: Ikwt or Iknull total fetal livers (A), untreated (Untr) or tamoxifen (Tmx)-treated G1E-ER4 cells (B and D), and untreated (Untr) MEL cells or MEL cells treated with DMSO for 3 days (DMSO) (C). Bar graphs present the recruitment of EZH2 (A to C) or SUZ12 (D) to the Hes1 promoter, expressed as fold enrichment with standard deviations. ChIP was performed with anti-EZH2, anti-SUZ12, or isotype-matched immunoglobulin G (mo, mouse) and analyzed by qPCR as described for Fig. 4. The region amplified as a positive control (pos) was the −2.8 enhancer of Gata2 (anti-EZH2 and anti-SUZ12), and the negative control (neg) was NM_026543 (anti-EZH2, anti-SUZ12) (64). *, P < 0.05 (significant differences between values for Iknull and Ikwt cells, untreated versus Tmx-treated cells, or untreated [−] and DMSO, according to Student's t test) (E) Western blot analysis of EZH2 knockdown in G1E-ER4. The anti-EZH2 and antiactin (control) antibodies were used for immunodetection. sh381 and sh382 are shRNAs against EZH2 mRNA; shScr is a nonspecific scrambled shRNA. (F) Relative expression of Hes1 in G1E-ER4 cells with sh381, sh382, or shScr. *, P < 0.05 (significant differences between G1E-ER4 shScr Hes1 expression and that of G1E-ER4 sh381 and G1E-ER4 sh382). Standard deviations are indicated.
EZH2 and SUZ12 can be immunoprecipitated with GATA-1 (Fig. 8A) (64). The specificity of EZH2 IP was confirmed by SUZ12 detection and CDK9 (positive and negative controls, respectively). Since EZH2 was recruited only to the GATA-1-occupied Hes1 promoter, we asked whether another hematopoietic factor(s) is required for GATA-1–EZH2 interaction. Thus, we expressed GATA-1 in nonhematopoietic COS-7 cells and conducted the IP assay. GATA-1–EZH2 IP was detected in this system (Fig. 8B). To test whether the DNA template was required for the interaction, we conducted IP analysis with cell lysates treated with DNase I, RNase I, and ethidium bromide (47). Under these conditions, GATA-1-ER and EZH2 immunoprecipitated together (Fig. 8C). Thus, although Ikaros promotes the recruitment of GATA-1 and EZH2, the interaction between GATA-1 and EZH2 does not require Ikaros, the “ER section” of GATA-1-ER, other hematopoietic factors, or DNA.
Fig 8.
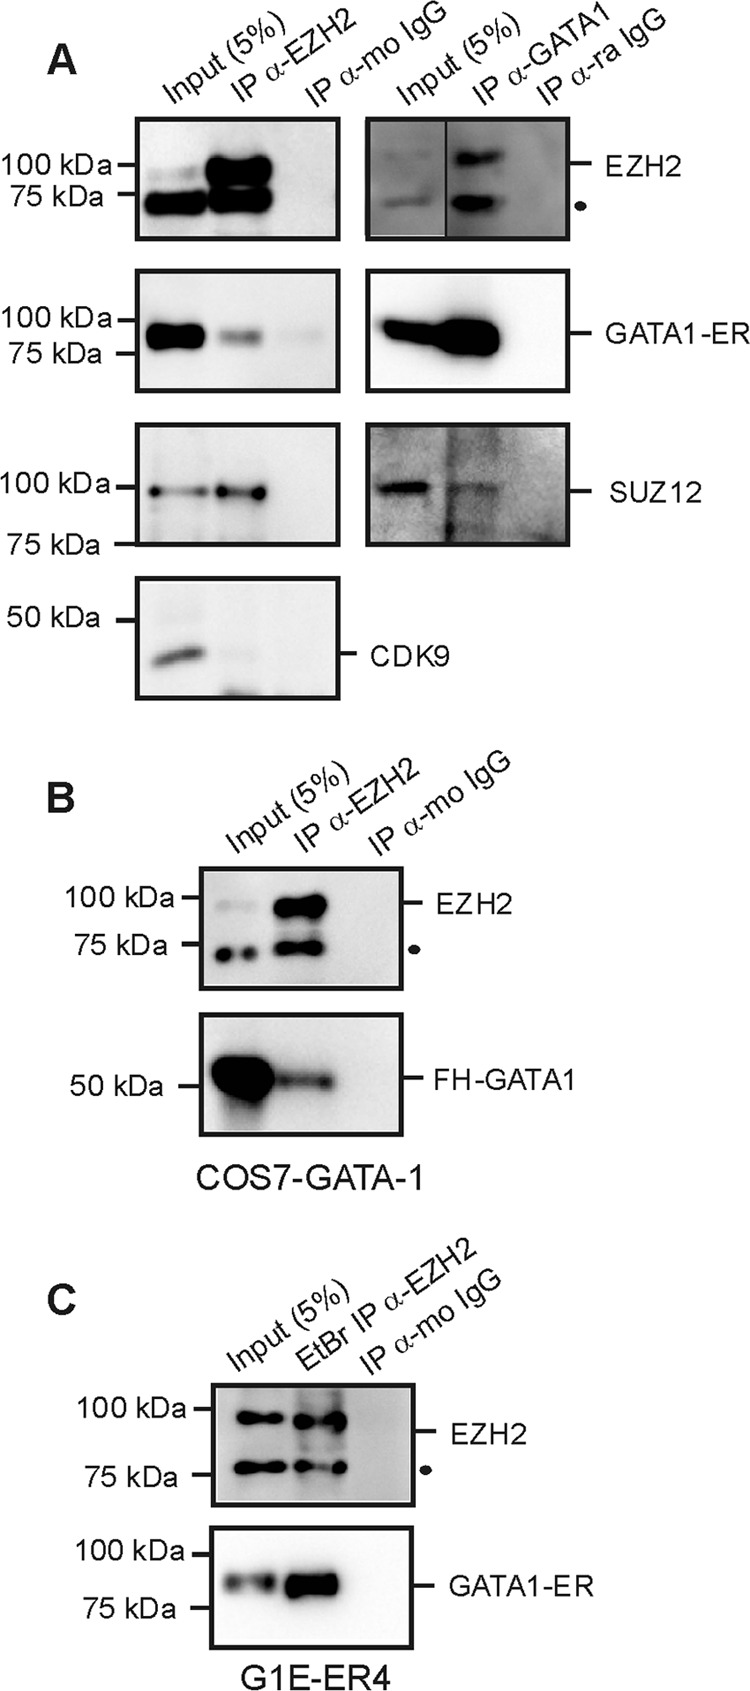
Immunoprecipitations of GATA-1 and PRC2 components. Western blot results were obtained after immunoprecipitation (IP) with the anti-EZH2, anti-GATA-1, or anti-IgG (isotype-matched immunoglobulin G; mo, mouse; ra, rat). IP were made in tamoxifen (Tmx)-treated G1E-ER4 cells (A), in COS7 cells engineered to ectopically express GATA-1 protein (B), or in tamoxifen (Tmx)-treated G1E-ER4 cells treated with ethidium bromide (EtBr), RNase I, and DNase I (C). Protein interactions were revealed by immunodetection with anti-EZH2, anti-GATA-1, anti-SUZ12, and anti-CKD9. Specific bands are labeled and molecular masses are given on the right and left sides of panels, respectively. The dot indicates a nonspecific band. FH-GATA-1, Flag-HA-GATA-1 fusion protein.
Ikaros is required for GFI1B recruitment to Hes1 promoter.
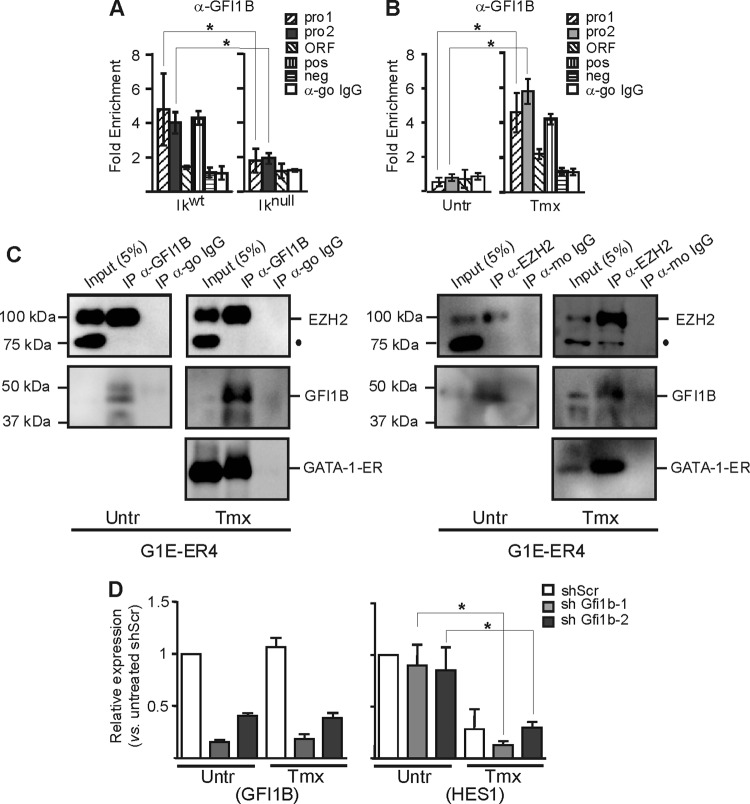
The transcription factor GFI1B interacts with GATA-1 and EZH2 (64). At the Hes1 promoter, we found two potential GFI1B DNA binding sites. ChIP analysis revealed the enhanced recruitment of GFI1B to the Hes1 promoter chromatin in EryC, but only when Ikaros and GATA-1 were present (Fig. 9A and B; also, see above). An IP with anti-GFI1B was conducted in uninduced G1E-ER4, which revealed EZH2 interaction with GFI1B in the absence of GATA-1 (Fig. 9C). Thus, GATA-1 is required for GFI1B occupancy at the Hes1 promoter, but the interaction between GFI1B and EZH2 does not require GATA-1.
Fig 9.
GFI1B influence in the Hes1 promoter regulation in EryC. (A to C) EryC were collected for ChIP and Western blot analysis: Ikwt or Iknull total fetal livers (A) and untreated (Untr) or tamoxifen (Tmx)-treated G1E-ER4 cells (B and C). Bar graphs show the recruitment of GFI1B (A and B) to the Hes1 promoter, expressed as fold enrichment with standard deviations. ChIP was performed with anti-GFI1B or isotype-matched immunoglobulin G (go, goat) and analyzed by qPCR as described for Fig. 4. The region amplified for positive control (pos) was the Gfi1b promoter, and the negative control (neg) was the Car1 promoter (48). *, P < 0.05 (significant differences between values for Iknull and Ikwt cells or untreated versus Tmx-treated cells according to Student's t test). (D) G1E-ER4 cells were stably transfected with vectors expressing shRNA directed against Gfi1b mRNA (shGFI1B-1 or shGFI1B-2) or with a nonspecific scrambled shRNA (shScr). Compared with the normal Gfi1b expression levels detected in untreated or Tmx-treated G1E-ER4 cells, the expression of Gfi1b is significantly downregulated in the shGFI1B-1 and shGFI1B-2 stable populations of G1E-ER4 cells. Relative expression of Gfi1b or Hes1 in cells with shScr, shGfi1b-1, or shGfi1b-2 was measured by qRT-PCR in untreated (Untr) or tamoxifen (Tmx)-treated cells. Standard deviations are indicated. Relative expression was calculated according to Pfaffl (43) using Actb as an internal control.
Since EZH2 is required for the Hes1 repression described here and GFI1B can interact with EZH2, we knocked down GFI1B to define the influence of GFI1B on Hes1 regulation in EryC. As shown in Fig. 9D, the knockdown of GFI1B had no significant effect on Hes1 expression in uninduced or tamoxifen-treated GIE-ER4 cells. The expression levels of IKZF1 (Ikaros) and Gata-1-ER were also not significantly influenced by the decreased expression of GFI1B in the knockdowns (data not shown).
Ikaros influence on the Notch pathway in erythroid cells.
Interestingly, other genes of the Notch pathway have also been identified as GATA-1 targets in erythroid cells by genome wide analyses (11, 16, 54, 64). Notch1 is a common target in all these studies, and Ikaros is a regulator of Notch1 in lymphoid cells (19). As can be seen in Fig. 10A and B, Ikaros also influences the expression of Notch1 by binding its promoter in EryC. The importance of Ikaros in Notch pathway regulation is also observed by the increased recruitment of NICD and RBPJ to the Hes1 promoter in the absence of Ikaros (Fig. 10C and D). Therefore, our data suggest that the combination of Ikaros and GATA-1 is important for the regulation of different genes of the Notch pathway in EryC.
Fig 10.
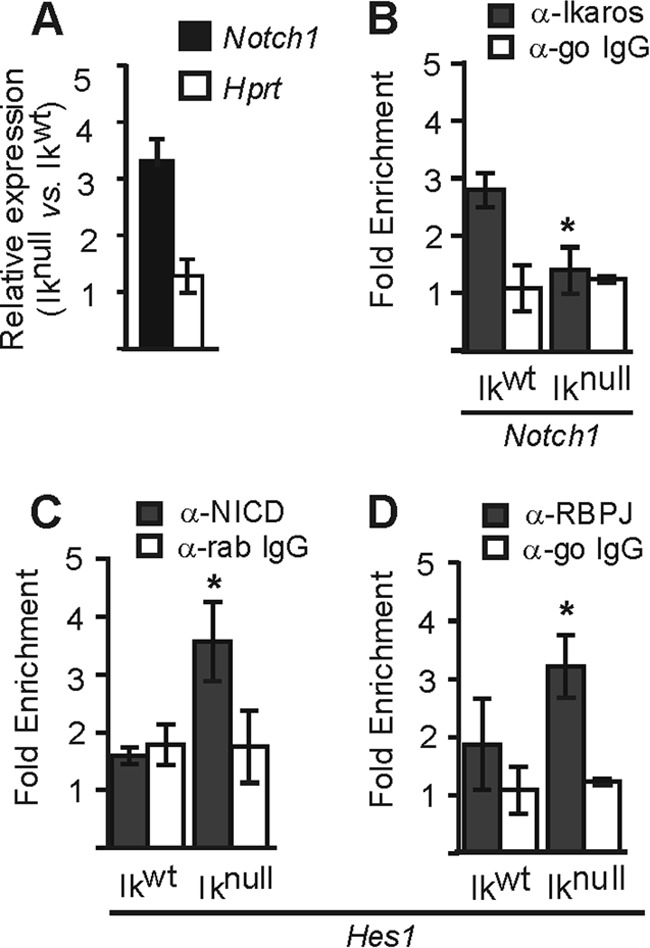
Ikaros influence on Notch1 in EryC. (A) Relative expression of Notch1 in Iknull versus Ikwt EryC. Standard deviations are shown. The relative expressions were calculated according to Pfaffl (43), using Actb as the internal control. Hprt was the negative control. (B to D) Bar graphs of the recruitment of Ikaros (A), Notch intracellular domain (NICD) (B), or RBPJ (D) to the Notch1 (B) or Hes1 (C and D) promoter, expressed as fold enrichment with standard deviations. ChIP was performed with anti-Ikaros, anti-NICD, anti-RBPJ, or isotype-matched immunoglobulin G (go, goat; rab, rabbit) and analyzed by qPCR as described for Fig. 4. *, P < 0.05 (significant differences between values for Iknull and Ikwt cells according to Student's t test).
DISCUSSION
Expression levels of Hes1 during erythroid cell differentiation.
The Notch pathway influences apoptosis in mouse yolk sac and bone marrow EryC (46). It is also reported to affect EryC differentiation, although this is controversial (21, 23). Here, we provide the evidence that the Notch target gene Hes1 has a dynamic regulation during EryC differentiation (Fig. 11). The analysis of fetal liver cell subpopulations corresponding to diverse stages of EryC differentiation revealed a sharp decrease of Hes1 expression from the early progenitor cells (P1) to the enriched proerythroblast stage (P2) of differentiation (Fig. 1B). This observation was also made in differentiating G1E-ER4 cells (Fig. 1H). However, our results suggest that this repression is not definitive, since Hes1 expression was increased in orthochromatic erythroblasts and in DMSO-treated MEL cells (Fig. 1B and 1I). To define whether this decrease of expression is biologically relevant in EryC, we knocked down Hes1 in MEL cells. The enhanced differentiation of DMSO-induced MEL cells in the absence of HES1 was reminiscent of observations made in fibroblasts and in specific cancers, such as rhabdomyosarcomas, where HES1 inhibition favors cellular differentiation (49). In the early progenitor population of fetal liver cells, expression levels of HES1 have the opposite effect, since it is the enhanced expression of HES1 that favors differentiation. A differentiation stage-specific effect of HES1 could explain why opposite results were obtained when the HES1 influence over EryC differentiation has been assessed in different model cell lines (21, 23). Furthermore, Notch1 downregulation, which should ablate Hes1 transcription, was previously reported to impair MEL cell differentiation (50). The apparent discrepancy between these and our results could be attributed to one or more of the following: (i) Notch1 regulates several target genes in erythroid cells, and some of these targets might influence MEL cells differently than HES1; (ii) other Notch receptors, such as Notch2, are likely involved in Hes1 regulation in EryC; and (iii) Hes1 is not solely regulated by the Notch pathway. The latter possibility is highlighted in this report, since we provide evidence that Ikaros and GATA-1 are required for Hes1 silencing at specific steps of EryC differentiation.
Fig 11.
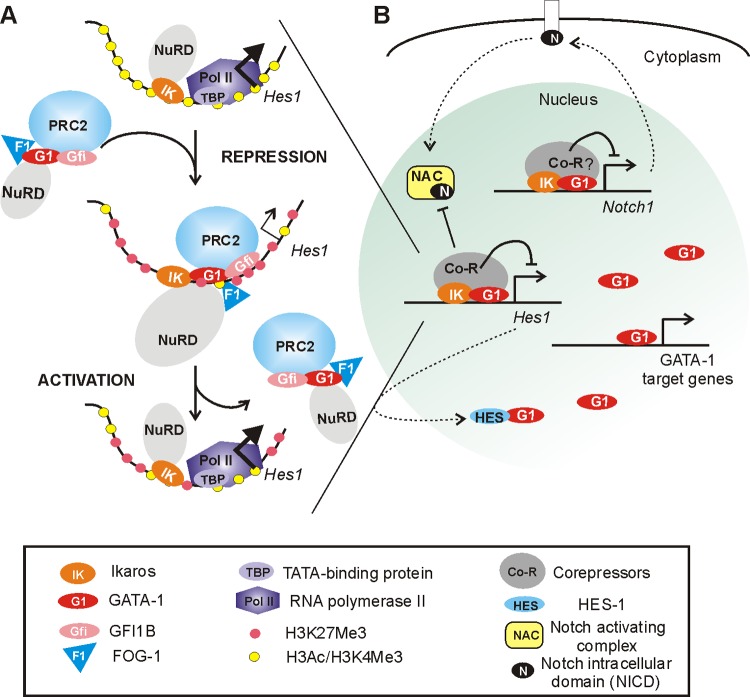
Model showing the influence of Ikaros and GATA-1 on the Notch pathway during differentiation in erythroid cells. (A) Ikaros is recruited to Hes1, where it facilitates GATA-1 chromatin binding. GATA-1 then promotes the recruitment of different factors and complexes with the capacity to repress gene transcription and, hence, represses the Hes1 gene. Ikaros, GATA-1, and EZH2 are required for Hes1 repression. (B) The recruitment of Ikaros and GATA-1 interferes with the recruitment of RBPJ and the Notch-activating complex (NAC) to the Hes1 promoter (Fig. 10). The repression of Notch1 by Ikaros leads to a decreased level of NICD, a critical component of the NAC released upon cleavages of the Notch receptor after binding of a Notch ligand (Fig. 10). Since HES1 interferes with GATA-1 activity in the nucleus (23), the repression of Notch1 and Hes1 by Ikaros and GATA-1 favors a high concentration of free GATA-1 that can bind to its target genes.
Regulation of Hes1 by Ikaros and GATA-1 in erythroid cells.
GATA-1 and Ikaros were both reported to influence EryC homeostasis (17, 38, 42, 45, 51, 55, 56, 59, 62). GATA-1 regulates a number of genes in EryC; however, to date only a few Ikaros-regulated genes have been identified in these cells (3, 5, 45). While an expression array revealed that the absence of Ikaros causes variable expression of different genes controlling apoptosis in EryC (45), the precise effect of Ikaros on erythroid gene regulation has been studied mainly at the β-globin locus (3, 5, 7). Ikaros can physically interact with GATA-1, whereupon these proteins promote silencing of γ-globin genes in a developmental-stage-specific manner in EryC (5, 7). The combinatorial effect of Ikaros and GATA-1 is also implicated in silencing of the Gata2 general promoter in EryC (5, 7). Observations made at the γ-globin and Gata2 general promoters led us to propose that when implicated in silencing, Ikaros and GATA-1 nucleate a repressive complex (5).
Our present data demonstrate that GATA-1 and Ikaros are both required for Hes1 regulation in EryC. Ikaros is directly recruited to the Hes1 promoter, and Hes1 expression is significantly increased in the absence of Ikaros. This is reminiscent of observations made in lymphoid cells, where Ikaros is a dominant repressor of Hes1 (9). Whether or not Ikaros repression of Hes1 in EryC prevails over Notch activation is unknown; however, the results presented here indicate that Ikaros facilitates GATA-1 and FOG-1 binding to the Hes1 promoter and that in the absence of GATA-1, Ikaros is not sufficient to repress Hes1.
The mechanism behind the decreased GATA-1 recruitment and subsequent alleviation of Hes1 repression in differentiated MEL cells as well as in the P4 population of fetal liver cells is unknown. Since it is not likely due to a decreased expression of GATA-1 (Fig. 4J), it could be related to posttranslational modifications of GATA-1 and/or Ikaros acting on their interaction or on GATA-1 recruitment to chromatin at Hes1. Nonetheless, it cannot be excluded that another mechanism, perhaps another transcription factor, could affect the GATA-1 binding to Hes1 chromatin at late stages of EryC differentiation.
MI-2 is primarily associated with transcriptional repression, but when associated with GATA-1 and FOG-1, as it was determined to be at Hes1, it can be linked to either gene activation or repression (32). No significant variation in Hes1 expression was detected when MI-2 was knocked down in G1E-ER4 cells (Fig. 5K). The enrichment of H3K27me3 at the repressed Hes1 promoter prompted us to investigate the possible recruitment of EZH2 and PRC2. We found that PRC2 subunits EZH2 and SUZ12 are also recruited in a GATA-1-dependent manner to the repressed Hes1 promoter in EryC. Furthermore, since GATA-1 and GFI1B can interact and colocalize with EZH2 at different regions of the genome (64), we found that GFI1B binds the repressed Hes1 promoter in the presence of GATA-1 in induced G1E-ER4. GFI1B frequently promotes the recruitment of the histone H3K4 demethylase LSD1 (48). The slight decrease of H3K4me3 at Hes1 when GFI1B is recruited (data not shown) could be an indirect consequence of LSD1 demethylase activity on H3K4me2 and H3K4me1 (1). However, the knockdown of GFI1B or MI-2 did not significantly affect Hes1 expression in G1E-ER4 cells, which may be related to a redundancy in repressive components at the Hes1 promoter in these cells. In principle, MI-2 and GFI1B might play a more significant role in Hes1 expression at other stages of differentiation and/or in other hematopoietic cells. Thus, we show for the first time that GATA-1 is required for the recruitment of the PRC2 subunits EZH2 and SUZ12 as well as GFI1B to a specific promoter (Hes1). The implication of PRC2 in Hes1 regulation is supported by the increased level of H3K27me3 at silenced Hes1 promoters and by the increased expression of Hes1 when EZH2 is knocked down.
Based on our results, we propose a model whereby Ikaros facilitates GATA-1 and FOG-1 recruitment, which in turn promote the recruitment of potential repressive factors, including MI-2/NuRD, GFI1B, and PRC2 (Fig. 11). Since the decreased expression of EZH2 significantly affected the expression level of Hes1, our results support a model whereby EZH2 and PRC2 are critical for the transient repression of Hes1 during EryC differentiation. Consequently, GATA-1 is central to Hes1 repression in EryC. Additionally, results presented in Fig. 10 suggest that, as in lymphoid cells (19), Ikaros is implicated in repression of the Notch1 gene in EryC. Since GATA-1 can bind the Notch1 locus (16), Ikaros and GATA-1 are likely to influence multiple genes along the Notch pathway. Although the possibility that a variation of Notch expression induced by Ikaros could also exert an indirect effect on Hes1 expression cannot be excluded, our results undoubtedly demonstrate the direct recruitment of Ikaros and GATA-1 to and their influence on Hes1 gene regulation in EryC.
HES1 can interfere with the capacity of GATA-1 to regulate gene expression (23). Thus, the dynamic regulation of Hes1 during EryC differentiation and especially the repression of Hes1 by GATA-1 in proerythroblast populations are apparently required for terminal differentiation of EryC. This is further supported by previous studies indicating a requirement for GATA-1 at this stage of EryC differentiation (17, 41). The interplay between HES1 and GATA-1 permits the regulation of both factors, providing a mechanism influencing EryC differentiation.
In summary, our results reveal a noncanonical mechanism of Hes1 regulation in EryC whereby the facilitated GATA-1 binding to chromatin at the Hes1 promoter induces the recruitment of FOG-1, GFI1B, the nucleosome remodeling ATPase MI-2, and Polycomb repressive complex 2 (PRC2) and consequently the silencing of Hes1. Such Hes1 repression occurs at a critical stage of EryC differentiation when high levels of GATA-1 expression are required. Key factors implicated in this newly identified GATA-1-dependent mechanism, including Ikaros, GATA-1, HES1, and EZH2, were reported to be mutated or to exhibit altered expression in different hematological malignancies, including leukemia (2, 27, 31, 35–37). Further investigations will be needed to define whether the mutation or altered expression of these factors can collaborate to promote hematological malignancies and, in particular, myeloproliferative neoplasms and myelodysplastic syndromes with marked erythroid dysplasia, or even erythroleukemia.
ACKNOWLEDGMENTS
We thank J. G. Filep, S. Bottardi, and E. Drobetsky for critical reading of the manuscript; K. Georgopoulos for the Iknull mouse line; M. Weiss for the G1E-2 and the G1E-ER4 cell lines; F. Grosveld for the MEL C88 cell line; V. Bourgoin for technical assistance; and G. D'Angelo for Wright-Giemsa staining analysis.
This study was supported by a grant from the Canadian Institutes of Health Research (MOP 97738) held by E.M. E.H.B. is supported by NIH R01 DK50107. J.R. is supported by a Fond de la Recherche du Québec en Santé (FRQS) Doctoral Training Award, and E.M. is a scholar of the FRQS.
Footnotes
Published ahead of print 9 July 2012
REFERENCES
- 1. Adamo A, Barrero MJ, Belmonte JC. 2011. LSD1 and pluripotency: a new player in the network. Cell Cycle 10: 3215–3216 [DOI] [PubMed] [Google Scholar]
- 2. Alcalay M, et al. 2003. Acute myeloid leukemia fusion proteins deregulate genes involved in stem cell maintenance and DNA repair. J. Clin. Invest. 112: 1751–1761 [DOI] [PMC free article] [PubMed] [Google Scholar]
- 3. Bank A. 2006. Regulation of human fetal hemoglobin: new players, new complexities. Blood 107: 435–443 [DOI] [PMC free article] [PubMed] [Google Scholar]
- 4. Bigas A, Robert-Moreno A, Espinosa L. 2010. The Notch pathway in the developing hematopoietic system. Int. J. Dev. Biol. 54: 1175–1188 [DOI] [PubMed] [Google Scholar]
- 5. Bottardi S, et al. 2009. Ikaros and GATA-1 combinatorial effect is required for silencing of human gamma-globin genes. Mol. Cell. Biol. 29: 1526–1537 [DOI] [PMC free article] [PubMed] [Google Scholar]
- 6. Bottardi S, Ross J, Pierre-Charles N, Blank V, Milot E. 2006. Lineage-specific activators affect beta-globin locus chromatin in multipotent hematopoietic progenitors. EMBO J. 25: 3586–3595 [DOI] [PMC free article] [PubMed] [Google Scholar]
- 7. Bottardi S, et al. 2011. Ikaros interacts with P-TEFb and cooperates with GATA-1 to enhance transcription elongation. Nucleic Acids Res. 39: 3505–3519 [DOI] [PMC free article] [PubMed] [Google Scholar]
- 8. Bray SJ. 2006. Notch signalling: a simple pathway becomes complex. Nat. Rev. Mol. Cell Biol. 7: 678–689 [DOI] [PubMed] [Google Scholar]
- 9. Chari S, Umetsu SE, Winandy S. 2010. Notch target gene deregulation and maintenance of the leukemogenic phenotype do not require RBP-J. kappa in Ikaros null mice. J. Immunol. 185: 410–417 [DOI] [PMC free article] [PubMed] [Google Scholar]
- 10. Chari S, Winandy S. 2008. Ikaros regulates Notch target gene expression in developing thymocytes. J. Immunol. 181: 6265–6274 [DOI] [PMC free article] [PubMed] [Google Scholar]
- 11. Cheng Y, et al. 2009. Erythroid GATA1 function revealed by genome-wide analysis of transcription factor occupancy, histone modifications, and mRNA expression. Genome Res. 19: 2172–2184 [DOI] [PMC free article] [PubMed] [Google Scholar]
- 12. Dumortier A, et al. 2006. Notch activation is an early and critical event during T-cell leukemogenesis in Ikaros-deficient mice. Mol. Cell. Biol. 26: 209–220 [DOI] [PMC free article] [PubMed] [Google Scholar]
- 13. Elagib KE, et al. 2004. Jun blockade of erythropoiesis: role for repression of GATA-1 by HERP2. Mol. Cell. Biol. 24: 7779–7794 [DOI] [PMC free article] [PubMed] [Google Scholar]
- 14. Fischer A, Gessler M. 2007. Delta-Notch—and then? Protein interactions and proposed modes of repression by Hes and Hey bHLH factors. Nucleic Acids Res. 35: 4583–4596 [DOI] [PMC free article] [PubMed] [Google Scholar]
- 15. Fraser PJ, Curtis PJ. 1987. Specific pattern of gene expression during induction of mouse erythroleukemia cells. Genes Dev. 1: 855–861 [DOI] [PubMed] [Google Scholar]
- 16. Fujiwara T, et al. 2009. Discovering hematopoietic mechanisms through genome-wide analysis of GATA factor chromatin occupancy. Mol. Cell 36: 667–681 [DOI] [PMC free article] [PubMed] [Google Scholar]
- 17. Fujiwara Y, Browne CP, Cunniff K, Goff SC, Orkin SH. 1996. Arrested development of embryonic red cell precursors in mouse embryos lacking transcription factor GATA-1. Proc. Natl. Acad. Sci. U. S. A. 93: 12355–12358 [DOI] [PMC free article] [PubMed] [Google Scholar]
- 18. Georgopoulos K. 2002. Haematopoietic cell-fate decisions, chromatin regulation and ikaros. Nat. Rev. Immunol. 2: 162–174 [DOI] [PubMed] [Google Scholar]
- 19. Gomez-del Arco P, et al. 2010. Alternative promoter usage at the Notch1 locus supports ligand-independent signaling in T cell development and leukemogenesis. Immunity 33: 685–698 [DOI] [PMC free article] [PubMed] [Google Scholar]
- 20. Hadland BK, et al. 2004. A requirement for Notch1 distinguishes 2 phases of definitive hematopoiesis during development. Blood 104: 3097–3105 [DOI] [PMC free article] [PubMed] [Google Scholar]
- 21. Henning K, et al. 2007. mNotch1 signaling and erythropoietin cooperate in erythroid differentiation of multipotent progenitor cells and upregulate beta-globin. Exp. Hematol. 35: 1321–1332 [DOI] [PubMed] [Google Scholar]
- 22. Hong W, et al. 2005. FOG-1 recruits the NuRD repressor complex to mediate transcriptional repression by GATA-1. EMBO J. 24: 2367–2378 [DOI] [PMC free article] [PubMed] [Google Scholar]
- 23. Ishiko E, et al. 2005. Notch signals inhibit the development of erythroid/megakaryocytic cells by suppressing GATA-1 activity through the induction of HES1. J. Biol. Chem. 280: 4929–4939 [DOI] [PubMed] [Google Scholar]
- 24. Jimenez G, Griffiths SD, Ford AM, Greaves MF, Enver T. 1992. Activation of the beta-globin locus control region precedes commitment to the erythroid lineage. Proc. Natl. Acad. Sci. U. S. A. 89: 10618–10622 [DOI] [PMC free article] [PubMed] [Google Scholar]
- 25. Kawamata S, Du C, Li K, Lavau C. 2002. Overexpression of the Notch target genes Hes in vivo induces lymphoid and myeloid alterations. Oncogene 21: 3855–3863 [DOI] [PubMed] [Google Scholar]
- 26. Kim SI, Bultman SJ, Jing H, Blobel GA, Bresnick EH. 2007. Dissecting molecular steps in chromatin domain activation during hematopoietic differentiation. Mol. Cell. Biol. 27: 4551–4565 [DOI] [PMC free article] [PubMed] [Google Scholar]
- 27. Klinakis A, et al. 2011. A novel tumour-suppressor function for the Notch pathway in myeloid leukaemia. Nature 473: 230–233 [DOI] [PMC free article] [PubMed] [Google Scholar]
- 28. Koipally J, Renold A, Kim J, Georgopoulos K. 1999. Repression by Ikaros and Aiolos is mediated through histone deacetylase complexes. EMBO J. 18: 3090–3100 [DOI] [PMC free article] [PubMed] [Google Scholar]
- 29. Lam LT, Ronchini C, Norton J, Capobianco AJ, Bresnick EH. 2000. Suppression of erythroid but not megakaryocytic differentiation of human K562 erythroleukemic cells by notch-1. J. Biol. Chem. 275: 19676–19684 [DOI] [PubMed] [Google Scholar]
- 30. Lin TS, Ishiguro K, Sartorelli AC. 1998. Role of gp55 in restoring the sensitivity of Friend murine erythroleukemia cells to erythropoietin by exposure to dimethyl sulfoxide. Oncol. Res. 10: 175–184 [PubMed] [Google Scholar]
- 31. Makishima H, et al. 2010. Novel homo- and hemizygous mutations in EZH2 in myeloid malignancies. Leukemia 24: 1799–1804 [DOI] [PubMed] [Google Scholar]
- 32. Miccio A, et al. 2010. NuRD mediates activating and repressive functions of GATA-1 and FOG-1 during blood development. EMBO J. 29: 442–456 [DOI] [PMC free article] [PubMed] [Google Scholar]
- 33. Mukherjee T, Kim WS, Mandal L, Banerjee U. 2011. Interaction between Notch and Hif-alpha in development and survival of Drosophila blood cells. Science 332: 1210–1213 [DOI] [PMC free article] [PubMed] [Google Scholar]
- 34. Muller P, et al. 2010. SOX9 mediates the retinoic acid-induced HES-1 gene expression in human breast cancer cells. Breast Cancer Res. Treat. 120: 317–326 [DOI] [PubMed] [Google Scholar]
- 35. Mullighan C, Downing J. 2008. Ikaros and acute leukemia. Leuk. Lymphoma 49: 847–849 [DOI] [PubMed] [Google Scholar]
- 36. Muntean AG, Ge Y, Taub JW, Crispino JD. 2006. Transcription factor GATA-1 and Down syndrome leukemogenesis. Leuk. Lymphoma 47: 986–997 [DOI] [PubMed] [Google Scholar]
- 37. Nakahara F, et al. 2010. Hes1 immortalizes committed progenitors and plays a role in blast crisis transition in chronic myelogenous leukemia. Blood 115: 2872–2881 [DOI] [PubMed] [Google Scholar]
- 38. Nichogiannopoulou A, Trevisan M, Neben S, Friedrich C, Georgopoulos K. 1999. Defects in hemopoietic stem cell activity in Ikaros mutant mice. J. Exp. Med. 190: 1201–1214 [DOI] [PMC free article] [PubMed] [Google Scholar]
- 39. Nudel U, et al. 1977. Accumulation of alpha- and beta-globin messenger RNAs in mouse erythroleukemia cells. Cell 12: 463–469 [DOI] [PubMed] [Google Scholar]
- 40. Palis J, Yoder MC. 2001. Yolk-sac hematopoiesis: the first blood cells of mouse and man. Exp. Hematol. 29: 927–936 [DOI] [PubMed] [Google Scholar]
- 41. Pevny L, et al. 1995. Development of hematopoietic cells lacking transcription factor GATA-1. Development 121: 163–172 [DOI] [PubMed] [Google Scholar]
- 42. Pevny L, et al. 1991. Erythroid differentiation in chimaeric mice blocked by a targeted mutation in the gene for transcription factor GATA-1. Nature 349: 257–260 [DOI] [PubMed] [Google Scholar]
- 43. Pfaffl MW. 2001. A new mathematical model for relative quantification in real-time RT-PCR. Nucleic Acids Res. 29: e45. [DOI] [PMC free article] [PubMed] [Google Scholar]
- 44. Pilon AM, et al. 2011. Genome-wide ChIP-Seq reveals a dramatic shift in the binding of the transcription factor erythroid Kruppel-like factor during erythrocyte differentiation. Blood 118: e139–148 [DOI] [PMC free article] [PubMed] [Google Scholar]
- 45. Pulte D, et al. 2006. Ikaros increases normal apoptosis in adult erythroid cells. Am. J. Hematol. 81: 12–18 [DOI] [PubMed] [Google Scholar]
- 46. Robert-Moreno A, Espinosa L, Sanchez MJ, de la Pompa JL, Bigas A. 2007. The notch pathway positively regulates programmed cell death during erythroid differentiation. Leukemia 21: 1496–1503 [DOI] [PubMed] [Google Scholar]
- 47. Rodriguez P, et al. 2005. GATA-1 forms distinct activating and repressive complexes in erythroid cells. EMBO J. 24: 2354–2366 [DOI] [PMC free article] [PubMed] [Google Scholar]
- 48. Saleque S, Kim J, Rooke HM, Orkin SH. 2007. Epigenetic regulation of hematopoietic differentiation by Gfi-1 and Gfi-1b is mediated by the cofactors CoREST and LSD1. Mol. Cell 27: 562–572 [DOI] [PubMed] [Google Scholar]
- 49. Sang L, Roberts JM, Coller HA. 2010. Hijacking HES1: how tumors co-opt the anti-differentiation strategies of quiescent cells. Trends Mol. Med. 16: 17–26 [DOI] [PMC free article] [PubMed] [Google Scholar]
- 50. Shelly LL, Fuchs C, Miele L. 1999. Notch-1 inhibits apoptosis in murine erythroleukemia cells and is necessary for differentiation induced by hybrid polar compounds. J. Cell Biochem. 73: 164–175 [DOI] [PubMed] [Google Scholar]
- 51. Simon MC, et al. 1992. Rescue of erythroid development in gene targeted GATA-1- mouse embryonic stem cells. Nat. Genet. 1: 92–98 [DOI] [PubMed] [Google Scholar]
- 52. Singer D, Cooper M, Maniatis GM, Marks PA, Rifkind RA. 1974. Erythropoietic differentiation in colonies of cells transformed by Friend virus. Proc. Natl. Acad. Sci. U. S. A. 71: 2668–2670 [DOI] [PMC free article] [PubMed] [Google Scholar]
- 53. Socolovsky M, et al. 2007. Negative autoregulation by FAS mediates robust fetal erythropoiesis. PLoS Biol. 5: e252 doi:10.1371/journal.pbio.0050252 [DOI] [PMC free article] [PubMed] [Google Scholar]
- 54. Soler E, et al. 2010. The genome-wide dynamics of the binding of Ldb1 complexes during erythroid differentiation. Genes Dev. 24: 277–289 [DOI] [PMC free article] [PubMed] [Google Scholar]
- 55. Takahashi S, et al. 1997. Arrest in primitive erythroid cell development caused by promoter-specific disruption of the GATA-1 gene. J. Biol. Chem. 272: 12611–12615 [DOI] [PubMed] [Google Scholar]
- 56. Tsai SF, Strauss E, Orkin SH. 1991. Functional analysis and in vivo footprinting implicate the erythroid transcription factor GATA-1 as a positive regulator of its own promoter. Genes Dev. 5: 919–931 [DOI] [PubMed] [Google Scholar]
- 57. Tsiftsoglou AS, Vizirianakis IS, Strouboulis J. 2009. Erythropoiesis: model systems, molecular regulators, and developmental programs. IUBMB Life 61: 800–830 [DOI] [PubMed] [Google Scholar]
- 58. Wang JH, et al. 1996. Selective defects in the development of the fetal and adult lymphoid system in mice with an Ikaros null mutation. Immunity 5: 537–549 [DOI] [PubMed] [Google Scholar]
- 59. Weiss MJ, Orkin SH. 1995. Transcription factor GATA-1 permits survival and maturation of erythroid precursors by preventing apoptosis. Proc. Natl. Acad. Sci. U. S. A. 92: 9623–9627 [DOI] [PMC free article] [PubMed] [Google Scholar]
- 60. Weiss MJ, Yu C, Orkin SH. 1997. Erythroid-cell-specific properties of transcription factor GATA-1 revealed by phenotypic rescue of a gene-targeted cell line. Mol. Cell. Biol. 17: 1642–1651 [DOI] [PMC free article] [PubMed] [Google Scholar]
- 61. Welch JJ, et al. 2004. Global regulation of erythroid gene expression by transcription factor GATA-1. Blood 104: 3136–3147 [DOI] [PubMed] [Google Scholar]
- 62. Whyatt D, et al. 2000. An intrinsic but cell-nonautonomous defect in GATA-1-overexpressing mouse erythroid cells. Nature 406: 519–524 [DOI] [PubMed] [Google Scholar]
- 63. Wu W, et al. 2011. Dynamics of the epigenetic landscape during erythroid differentiation after GATA1 restoration. Genome Res. 21: 1659–1671 [DOI] [PMC free article] [PubMed] [Google Scholar]
- 64. Yu M, et al. 2009. Insights into GATA-1-mediated gene activation versus repression via genome-wide chromatin occupancy analysis. Mol. Cell 36: 682–695 [DOI] [PMC free article] [PubMed] [Google Scholar]
- 65. Zhang J, Socolovsky M, Gross AW, Lodish HF. 2003. Role of Ras signaling in erythroid differentiation of mouse fetal liver cells: functional analysis by a flow cytometry-based novel culture system. Blood 102: 3938–3946 [DOI] [PubMed] [Google Scholar]


