

Abstract
Iron overload is the histological hallmark of genetic hemochromatosis and transfusional hemosiderosis but also may occur in chronic hepatopathies. This article provides an overview of iron deposition and diseases where liver iron overload is clinically relevant. Next, this article reviews why quantitative non-invasive biomarkers of liver iron would be beneficial. Finally, we describe current state of the art methods for quantifying iron with MRI and review remaining challenges and unsolved problems,
Keywords: iron quantification, magnetic resonance imaging, hepatic iron overload, quantitative biomarkers
Introduction
This article reviews emerging magnetic resonance imaging techniques that attempt to quantify liver iron non-invasively. The content is divided into the following sections:
Overview of iron deposition and diseases where liver iron overload is clinically relevant.
Review why quantitative non-invasive biomarkers of liver iron would be beneficial.
Describe current state of the art methods for quantifying iron with MRI, including remaining challenges and unsolved problems.
Explore the challenge and new approaches for quantifying iron overload when both iron and fat are present in the liver.
After reading this content, the reader should understand the scope of diffuse liver disease in regards to iron deposition and the limitations of biopsy, and be familiar with emerging quantitative MRI methods for measuring liver iron.
Background
Iron metabolism and overload
Hepatic iron overload is the abnormal and excessive intracellular accumulation of iron in hepatocytes, Kupffer cells, or both hepatocytes and Kupffer cells, primarily as ferritin particles and hemosiderin aggregates1, 2. Iron overload may occur selectively in the liver but more commonly iron overload is a systemic condition that affects extrahepatic organs as well as liver. In this section, we briefly review normal iron metabolism and the pathogenesis and clinical relevance of iron overload.
Normal iron metabolism
An essential nutrient, iron is required by every human cell1, 3. Under physiologic conditions, about 10% of dietary iron (1 to 2 mg/day) is absorbed daily, while a similar amount of iron is lost via sloughing of cells from the skin and mucosal surfaces4-6. An additional 2 mg/day is lost in premenopausal women due to menstruation4. The intestinal absorption of iron adjusts to physiological needs and is carefully regulated to balance losses3. As a result, iron concentration is normally maintained in a narrow homeostatic range, about 40 mg Fe/kg body weight in women and 50 mg Fe/kg in men1, 3. About 80% of body iron is functional, located in hemoglobin in red blood cells, myoglobin in muscle, and in iron-containing enzymes7, 8. A small fraction of iron is bound to transferrin, an intravascular transport protein that delivers iron to the liver, bone marrow, and other tissues7, 9. About 20% of body iron is in storage form and contained within the storage protein, ferritin, a hollow apoprotein shell with a central cavity, (7–8 nm in diameter, filled with iron oxyhydroxide nanocrystals) 8, 10. In normal mammalian liver tissues, ferritin is found mainly in the cytoplasm of hepatic Kupffer cells as well as spleen and in bone marrow macrophages.
Hepatic iron overload
While the body is capable of regulating intestinal absorption of iron, the body has no mechanism for regulating iron elimination. Thus, increased supply of iron leads to systemic iron overload. If sustained, the overload eventually overwhelms the capacity of ferritin to sequester the excess iron. When ferritin storage capacity is exceeded, free iron accumulates in the cells of the affected organ or organs. Additionally, ferritin molecules cluster in the cystoplasm and inside lysosomes of affected cells. Some of the ferritin denatures to form insoluble aggregates of hemosiderin8, 10, nanoscale particles with a relatively broad range of size and shape10. Thus, in normal conditions, iron is stored mainly as ferritin molecules in the cytoplasm, but in iron overload states, iron is stored not only as cytoplasmic ferritin molecules but also as cytoplasmic ferritin clusters, lysosomal ferritin clusters, and insoluble hemosiderin aggregates. The functional iron pool is unaffected.
The free intracellular iron reacts with hydrogen and lipid peroxides and generates toxic hydroxyl and lipid radicals that attack cell membranes, cellular proteins and nucleic acids11, 12. The damage, if sustained, leads to progressive fibrosis and organ dysfunction. Clinical manifestations depend on the pattern and severity of organ involvement, which in turn depend on the route and cause of the iron overload.
Iron overload may result from excess intestinal absorption, repeated intravenous blood transfusions, or a combination of the two:
Excess intestinal absorption leads initially to accumulation of iron in periportal hepatocytes and later to hepatocytes throughout the liver lobule. 13. With further progression, iron accumulates in Kupffer cells and biliary epithelium. Eventually, there is spillage of iron into the circulation, where it binds to transferrin7. The transferrin delivers the excess iron to organs with high transferrin-receptor density (pancreas, myocardium, thyroids, gonads, hypophysis, skin), leading to iron overload at these sites. Extra-hepatic reticuloendothelial organs (spleen, marrow, and lymph nodes) are relatively spared.
Intravenous blood transfusions lead to preferential involvement of the reticuloendothelial system. Red blood cell transfusions provide 200 to 250 mg iron per unit, and the iron contained in the transfused red blood cells accumulates in the reticuloendothelial cells of liver, spleen, bone marrow, and lymph nodes, where it is safely sequestered as ferritin until the storage capacity of the retioculoendothelial system (10 gm of iron, or the amount of iron delivered by 40 to 50 transfusions) is saturated7. After saturation, the iron accumulates in hepatocytes and in parenchymal cells of the pancreas, myocardium, and endocrine glands7.
Conditions associated with hepatic iron overload include hereditary hemochromastosis (HH), thalassemia, sickle cell cell disease (SCD), sideroblastic anemia, chronic hemolytic anemias, transfusional and parenteral iron overload, dietary iron overload, myelodysplasia, and chronic hepatopathies14. Below, we briefly discuss iron overload in HH, thalassemia, SCD, and chronic hepatopathy. In the first three conditions, excess iron deposits in an otherwise normal liver and may cause liver disease; in the latter condition, iron deposits in an already abnormal liver and may accelerate disease progression.
Hereditary hemochromastosis
HH is a genetic disorder associated with mutations in genes regulating iron metabolism6, the most common of which are in the HFE gene15, 16. These gene mutations result in dysregulated consitutitive intestinal iron uptake. Affected patients absorb iron at 5 to 10 times the normal rate (up to 10 mg/day)6, which may lead to total-body iron overload and accumulation of excess iron in liver, heart, and other organs as discussed above3. Liver iron stores are often more than 10 times that of normal liver 17. HH is the most common genetic disorder in populations of Northern European ancestry. In the United States, about 6% of persons have a mutation in one of the causative genes6, 10. The penetrance of disease is lower6, and the prevalence of clinically relevant disease is about 1 in 300 to 400 in Caucasian populations and lower in other racial groups10. Complications of HH include liver fibrosis, cirrhosis (5% of patients), arthritis, diabetes, and assorted cardiac disturbances due to iron deposition in the liver, joints, pancreas, and heart, respectively1, 3, 6, 18. These complications are more common in and occur at a younger age in men than women3, in whom menstruation helps to check the progression of iron overload4. Patients with cirrhosis may develop hepatocelluar carcinoma, which is a leading cause of death in these patients14, 18. In patients with HH, the severity of hepatic iron overload is an important prognostic biomarker for development of both hepatic and extrahepatic complications.
Thalassemias
These are genetic disorders in hemoglobin synthesis that prevent the body from producing sufficient hemoglobin and red blood cells. Thalassemias are prevalent in people of Mediterranean origin. The prevalence is low in Northern Europe. Chronic blood transfusion is life saving, but the repeated transfusions cause progressive accumulation of iron in the reticuloendothelial system. Patients with thalassemia major and other transfusion-dependent anemias receive roughly 0.4mg/kg/day of heme iron, 10 to 50 times the physiologic rate of iron absorption19. This transfusional overload is exacerbated by increased intestinal iron absorption to stimulated by tissue hypoxia, apoptosis of defective erythroid precursors generated by ineffective erythropoesis, as well as hemolysis of native and transfused red blood cells20. Due to the additive iron-loading mechanisms, systemic iron overload becomes severe in infancy or early childhood. Without aggressive iron chelation therapy, affected patients die from endocrine and cardiac dysfunction in the second decade of life21-23. Liver disease caused by hepatic iron overload may cause morbidity and contribute to poor quality of life but, in the absence of concomitant viral hepatitis24, death due to cirrhosis is rare20. The relative rarity of end stage liver disease in these patients can be attributed in part due to premature death from cardiac and endocrine disease and in part due to preferential accumulation of iron in Kupffer cells rather than hepatocytes as part of the hepatic involvement.
Sickle cell disease
Sickle cell disease (SCD) is a common, genetic blood disorder with high prevalence in African Americans. Although sickle cell disease is associated with anemia, erythropoesis is virtually normal and so there is no significant increase in intestinal iron absorption. Thus, nontransfused SCD patients do not spontaneously load iron7. Patients with SCD, however, may receive blood transfusions to alleviate symptoms that occur during a sickle crisis and consequently develop transfusional iron overload25. SCD also is associated with intravascular (extrasplenic) hemolysis. Free hemoglobin is released from destroyed red blood cells into the blood and filtered by the kidneys; some of the filtered hemoglobin is excreted in the urine but some is reabsorbed by the proximal convoluted tubules and deposits in the renal cortex as ferritin and hemosiderin7.
Chronic hepatopathy
Chronic liver diseases (hepatitis B and C virus infection, alcohol-induced liver disease, nonalcoholic fatty liver disease, and porphyria cutanea tarda) are sometimes associated with hepatic iron overload3, 14; this has been attributed to diminished functional hepatocyte mass, aberrant hepatic signaling with excess intestinal iron absorption, 26and reduced mobilization of storage iron from the liver. In these diseases, the primary liver condition is the paramount abnormality and the secondary iron overload is less important. Emerging evidence suggests, however, that hepatic iron accumulation in patients with pre-existing liver disease plays a synergistic role in the development of hepatic fibrosis and cirrhosis, reduces response to antiviral interferon therapy, and contributes to the development of HCC24, 27, 28.
Treatment of Iron Overload
The treatment of iron overload is based on its cause, severity, and organ involvement. The primary treatment for patients with HH is life-long therapeutic phlebotomy (regular extractions of about 500 ml of blood), which aims to remove excess iron and prevent iron-mediated tissue damage3, 14, 26. Phlebotomy is initially performed weekly, with longer intervals between sessions once hemoglobin levels decrease or an acceptable liver iron concentration (LIC) is achieved. Liver fibrosis may regress in response to therapy29, and life expectancy may return to that of a normal person18.
Iron overload in patients with transfusion-dependent anemias cannot be treated by phlebotomy. Instead, these patients are treated with chelation therapy3, 30, 31. Currently, three chelating agents are available: deferasirox, deferiprone, and deferoxamine21, 32, 33. The aim of therapy is to maintain total body iron at a level sufficiently low to prevent or even reverse iron toxicity while simultaneously minimizing treatment side effects. Close monitoring of iron levels is necessary1, 32.
In patients with viral hepatitis and hepatic iron overload, iron-chelating therapy is under investigation.
Quantification of Liver Iron is Important
Liver iron quantification is important. In HH, measuring the liver iron content permits identification of individuals suitable for phlebotomy therapy and helps exclude clinical disease in individuals at risk for HH based on genetic studies1. Liver iron content also provides important prognostic information regarding the risk for developing hepatic complications such as hepatic fibrosis and cirrhosis14, 34, 35.
In thalassemia and other iron-loading anemias, liver iron content serves as an indirect marker of total body iron26. The liver contains about 70% of total body iron and is the main iron storage site in the body1, 36. It correlates closely with total body iron and accounts for 98% of the variation in total iron stores26. Thus, measuring liver iron provides a reliable marker of total body iron to guide, monitor, and titrate therapy1. Liver iron also serves as prognostic biomarker for endocrine and cardiovascular complications in patients with thalassemia. It should be emphasized, however, that while liver iron content correlates with total body iron, it is not a perfect marker1, 33. In iron-loading anemias, most iron-mediated toxicities occur in extra-hepatic organs that account for only a fraction of total body iron19. Moreover, iron loading and clearance rates in these conditions are organ-dependent; thus, liver iron content may not reflect iron content in iron-sensitive target organs such as heart, pituitary, and pancreas1, 20. While high liver iron levels convey prognostic risk, low liver iron values do not exclude iron overload in the myocardium or other specific target tissues19. Finally, the relationship of liver iron to total body iron depends on the etiology and route of iron overload: iron preferentially accumulates in the liver in patients with HH, especially early in the course of iron loading, whereas it accumulates throughout the reticuloendothelial system in iron-loading anemias and other conditions in which recurrent blood transfusions are a major source of iron.
With the recognition that mild iron overload may be a co-factor in the progression of hepatic disorders27, evaluation of liver iron content is now considered relevant in the management of chronic liver diseases such as viral hepatitis, alcoholic liver disease, non- alcoholic fatty liver disease, and porphyria cutanea tarda28.
Coexistence of Fatty Liver and Iron Overload
Intracellular hepatic fat and iron overload may occur together. In fact, abnormally elevated intra-hepatic stores of iron are considered by some as a potential cofactor in the development of inflammation and fibrosis in the aggressive form of NAFLD, non-alcoholic steatohepatitis (NASH) 37-39. Despite this, the role of role of iron in NAFLD remains unknown. In some studies, up to 40% of NAFLD patients have concomitant iron overload39, 40, with a strong association between iron and aggressive histology. In our experience, combined steatosis and iron overload occur occasionally. In patients with HH, accumulation of iron within hepatocytes creates oxidative stress that can lead to end-stage cirrhosis, liver failure and the development of hepatocellular carcinoma41, which is a major cause of death in patients with hemochromatosis41. Moreover, in patients with iron overload from HH, coexisting steatosis can accelerate disease progression42. Thus, iron and steatosis are important and common features of diffuse liver disease whose coexistence is common and important due to probable synergistic injury mechanisms to the liver. Importantly, as we discuss later, the co-existence of fat and iron has important technical implications for quantification of these disease features with MRI.
Currents Methods for Quantifying Hepatic Iron – Biopsy, Imaging, Spectroscopy, and Susceptometry
Percutaneous Liver Biopsy
Non-targeted percutaneous liver biopsy with direct histological visualization is the current gold standard to diagnose diffuse liver disease including iron overload. Iron deposition is typically evaluated on a semi-quantitative scale based on Prussian Blue staining of iron granules. The most commonly used method is the scoring system of Rowe et al43, based on detection of iron granules and the magnifications at which discrete granules are resolved. This method uses a 5 point grading scale: grade 0 = granules absent/barely discernible at ×400 power, grade 1+ = iron granules barely discernible (×250); grade 2+ = discrete iron granules resolved (×100); grade 3+ = discrete granules resolved (×25); grade 4+ =masses visible (×10 or grossly visible). This is the most reproducible method and has been shown to correlate with liver iron concentration (LIC), a more precise measure of iron. Direct measurement of LIC requires the use of atomic absorption spectrophotometry, which is often performed when the specific diagnosis of iron overload is suspected or monitor therapy. Normal LIC ranges from 0.2 mg Fe/g dry weight (3.6 μmol Fe/kg dry weight) to 2 mg Fe/g dry weight (36 μmol Fe/kg dry weight). Iron overload is defined as iron that exceeds the upper limit of normal. In HH, the LIC may range up to 10 times the upper limit of normal (20 mg Fe/g dry weight or, equivalently, 360 μl Fe/dry weight). In iron overload associated with transfusion-dependent anemias, the LIC may exceed 20 times the upper limit of normal (40 mg Fe/g dry weight or 720 μl Fe/g dry weight). Unfortunately, atomic absorption spectrophotometry for LIC quantification44 is only available at specialized centers. It is a destructive technique and the specimen submitted for chemical analysis cannot also be evaluated histologically.
Owing to nonuniformity in the distribution of liver iron, measurement of LIC from biopsy specimens is subject to sampling error. In one study, the average coefficient of variation (CV) of LIC values in multiple needle biopsies was 19% in nondiseased livers and 40% in cirrhotic livers. Biopsy also carries significant risk of complications leading to hospitalization (1-3%) and death (1:10,000)45, and is also not feasible in many research studies, including epidemiological and genetic studies. In summary, due to the invasiveness, discomfort, risk, and sampling variability of biopsy, there is an urgent need for accurate, precise and noninvasive methods to assess liver fat and iron.
Quantitative phlebotomy
In quantitative phlebotomy, the amount of iron in the removed blood is measured. This method can assess total body iron stores26, but cannot be used in transfusion-dependent patients with iron overload and is generally acceptable only if the procedure provides therapeutic benefit1.
Ultrasound
Iron deposition is not detectable at ultrasound, and ultrasound has no clinical role in the evaluation of the iron overloaded liver, other than assessing the sequela of liver injury, such as cirrhosis and portal hypertension.
Computed Tomography
Iron overload in the liver is well known to increase the overall attenuation of liver through increased absorption of X-rays by iron, and CT has been described for the qualitative detection of iron overload from genetic hemochromatosis and hemosiderosis46, 47. Unfortunately, just as with fat quantification, many confounding factors, including steatosis, may alter hepatic attenuation and CT is not a reliable method for detection and quantification of hepatic iron overload3, 48.
Magnetic Resonance Spectroscopy
MRS can also be used to assess liver iron. Wang et al developed a multi-echo MRS sequence49. Single-voxel spectra were acquired at multiple echo times in human subjects with varying degrees of hepatic iron overload. The T2 relaxation value of the liver water peak was measured from the multi-echo spectra. T2 relaxation values showed high correlation with corresponding LIC values measured from synchronous liver biopsies, showing proof of concept that MRS could be used to estimate LIC values in human subjects. While the method is promising, the use of MRS for assessment of liver iron has the same limitations as MRS for liver fat, as discussed in the article by Reeder and Sirlin in this edition of MRI Clinics.
Susceptometry
Liver iron susceptometry using a superconducting quantum interference device (SQUID) is generally regarded as the most accurate non-invasive method to quantify liver iron11. This susceptometric technique, first proposed over 40 years ago50, 51, is based on the concept that iron is the only non-trace element with high susceptibility. Thus, normal tissue is diamagnetic and has susceptibility close to that of the water; in the presence of iron, the susceptibility of the liver is modified. The instrument measures the magnetic field variation produced outside the body adjacent to the liver in response to an external magnetic field. The magnetic field variation is proportional to the amount of tissue iron52. Other paramagnetic materials (oxygen, deoxyhemoglobin, some trace metals) make negligible contributions to the hepatic magnetic susceptibility and their effects can be ignored. Hence, magnetic measurements are highly specific for iron concentration. The SQUID has been validated by experiments showing excellent correlation with chemical assay-determined LIC. While the SQUID has been calibrated, validated and used for clinical studies, its complexity, high cost and limited availability (only four instruments in the whole world) have precluded widespread implementation3, 11. Another limitation is that the SQUID only assesses liver iron11; since iron loading and clearance rates are organ- specific, a method that measures iron at other body sites, if comparable in accuracy, would be preferable.
Quantification of Iron Accumulation in the Liver with MRI
Conventional MR Imaging for Detection of Iron
Similar to its use in detection of liver fat, conventional MRI has been used to detect liver iron for over 25 years53, 54. MRI does not image the iron directly but instead detects the effect of iron on water protons in the tissue of interest. The basis of using MRI for iron detection is that iron accelerates T2 relaxation and T2* signal decay, thereby causing signal loss on T2w spin-echo/fast spin-echo and T2*w gradient echo MR images.
Iron also accelerates T1 relaxation and may cause signal augmentation on T1 weighted images53, 55; the T1-shortening effect may be difficult to observe on clinical MR images because, and unless the TE is very short, signal loss from T2 or T2* shortening typically dominates signal augmentation from T1 shortening. In clinical practice, therefore, T1 weighted imaging is not used to detect iron.
The detailed mechanisms that underlie T2 and T2* shortening are not well understood but the following concepts are accepted by many investigators. On a cellular scale, iron is distributed as ferritin particles and hemosiderin aggregates in a non-uniform fashion10, 13. The non-uniformly distributed iron depots act like tiny bar magnets that create microscopic focal magnetic field inhomogneities. These inhomogenities cause protons within the voxel to precess at different precessional frequencies. The resulting frequency spread generates phase differences through the voxel between excitation and readout, causing accumulation of static dephasing and signal decay10, 19. Static dephasing and the resulting signal decay are reversible using spin-echo methods and therefore contribute to T2* signal decay but not to T2 relaxation.
To explain T2 relaxation, investigators have proposed “outer sphere” and “inner sphere” theories. According to the outer sphere theory, water protons diffusing through the field inhomogeneities experience different magnetic field inhomogeneities and accrue different phase shifts depending on their specific path of diffusion8, 19. This leads to diffusion-dependent dephasing and signal decay. Unlike static dephasing and signal decay, diffusion-dependent dephasing and signal decay are not reversible with spin-echo methods and hence contribute to T2 as well as T2* relaxation. The degree of diffusion-dependent dephasing and signal decay depend on several factors, including the number, size, shape, and distribution of iron-containing depots; the diffusivity of the water molecules; and the echo spacing10, 17. According to the inner sphere theory, iron electrons enhance the relaxation of protons of water molecules bound to iron-containing proteins. Through chemical exchange, enhanced relaxation of bound water protons is then transferred to the bulk water protons8, 56.
Regardless of the mechanism, the T2 and T2* shortening caused by iron can be detected by conventional MRI using T2w or T2*w images. On such images, iron overload can be inferred if the liver (or other tissue of interest) has lower signal intensity than normal. For example, on T2w and T2*w images, the normal liver has slightly lower signal intensity than spleen and kidneys. Moderate or marked hypointensity of liver relative to spleen or kidneys is abnormal and suggests iron overload. The degree of signal loss depends on the amount of iron and the echo time; in general, the greater the echo time, the greater the signal loss (Figure 1).
Figure 1.

Conventional T2*-weighted gradient echo and T2w-weighted imaging is a well-established qualitative method for detecting iron overload within the liver and assessing involvement of other organs. Shown are breath-held gradient echo images with echo times (TEs) of 2.3, 4.6, and 9 ms and a respiratory-triggered fat-saturated fast spin echo image with TE of 70 ms at 1.5T through the same slice of the liver in a male patient with transfusional iron overload. Notice abnormally low signal intensity of liver, spleen, and marrow on all images, indicating iron overload in these recticulo-endothelial tissues. The pancreas, which has normal signal intensity, is spared. The pattern of organ involvement is typical for transfusional overload. The liver is mildly hypointense at 2.3 but then shows progressive signal loss with increasing TE on the gradient echo images, indicating fast T2* decay. The spleen is markedly hypointense at 2.3 ms, indicating even faster T2* decay. As its signal intensity at 2.3 ms is already very low, the spleen does not appreciably lose additional signal with increasing TE.
Importantly, iron-induced T2* shortening induced exceeds iron-induced T2 shortening. Hence, T2*w images have greater sensitivity for detecting iron10 and are superior for delineating its distribution, as illustrated in Figure 2.
Figure 2.

T2*-weighted gradient echo (GRE) sequences are more sensitive to the presence and distribution of hepatic iron overload than T2-weighted single shot fast spin echo (SSFSE) sequences. Shown are co-localized SSFSE (top row) and GRE (bottom row) images in a woman with transfusional iron overload at baseline and at 4 and 8 months after chelation therapy. The T2-weighted SSFSE images look similar at all three time points, but the T2*-weighted GRE images show diffuse iron overload at baseline, partial regression of iron overload at 4 months, and near complete regression at 8 months. Notice that at 4 months, the GRE image shows normal signal intensity in a branching peri-portal pattern with persistent hypointensity in intervening parenchyma and along the periphery, suggesting that different parts of the liver may clear excess iron at different rates.
The distribution of iron overload is usually diffuse and homogeneous but it may be heterogeneous with a lobar/segmental, heteroegenous, or patchy pattern (Figure 2). In patients with cirrhosis, the accumulation also may be focal, reflecting selective accumulation of iron in siderotic nodules7; these nodules may be distributed in a patchy or diffuse fashion (Figure 3). As expected, the pattern of organ involvement reflects the etiology. In patients with HH, there is preferential involvement of the liver, pancreas, and heart, with sparing of extra-hepatic reticuloendothelial organs (spleen, bone marrow, lymph nodes)7, 57. By comparison, in thalassemia and other transfusion-dependent anemias, preferential involvement of the reticuloendothelial system (liver, spleen, marrow, nodes) is characteristic (Figure 4)58. Involvement of the pancreas, heart, and other non-reticuloendothelial system organs suggests the storage capacity of the RE system has been exceeded7. As opposed to patients with transfusion-dependent anemias, patients with transfusion-independent anemias may exhibit an HH-type pattern, presumably due to upregulated intestinal absorption of iron. In SCD, the renal cortex may show iron accumulation related to intravascular hemolysis (Figure 5)7. The liver in SCD patients is usually spared in the absence of transfusion therapy; involvement of the liver in non-tranfused SCD patients suggests a coexisting cause for hepatic iron overload such as HH7.
Figure 3.

In patients with pre-existing cirrhosis, iron may accumulate in regenerating nodules. Iron-laden regenerating nodules are known as siderotic nodules. Shown are T2*-weighted gradient echo images after administration of a gadolinium based contrast agent in two patients with cirrhosis secondary to hepatitis C viral infection. Siderotic nodules are hypointense due to T2* shortening effects of iron. In the patient on the left, scattered siderotic nodules are evident in a patchy distribution, while in the patient on the right they are diffusely distributed. Hyperintense reticulations in the liver in both patients represent gadolinium-enhanced fibrotic bands. These are more conspicuous in the patient on the right due to greater contrast between the hyperintense fibrotic bands and the diffusely distributed hypointense siderotic nodules.
Figure 4.

Patients with thalassemia and secondary iron overload have preferential involvement of reticuloendothelial tissues. Shown are dual-echo gradient echo images obtained at 3T with echo times (TEs) of 2.3 and 5.8 ms. Notice low signal of liver and spleen at 2.3 ms and incremental signal loss at 5.8 msec due to iron-mediated T2* shortening. In principle, the signal loss of the liver at 5.8 ms (nominally out of phase at 3T) could be attributed to steatosis rather than iron overload, which is a limitation of the IP-OP sequence design commonly implemented at 3T. In this case, a fat quantification sequence (not shown) excluded the presence of concomitant fat. The pancreas and kidney are spared, suggesting the storage capacity of the reticuloendothelial system has not been exceeded.
Figure 5.

Patients with SCD and secondary iron overload may have iron accumulation in the renal cortex. In this patient with SCD and history of transfusion therapy, notice low signal in the renal cortex and liver on T1-weighted dual-echo gradient echo images acquired at 1.5T with echo times as shown. The low signal is more pronounced on the second echo (TE = 4.6 ms). As illustrated in this case, dual-echo T1-weighted imaging can be used to detect iron overload in tissue. Signal loss on the second echo compared to the first echo indicates short T2* decay and suggests the presence of iron. As discussed in the text, hepatic iron overload does not occur in patients with SCD in the absence of transfusion therapy.
Historically, T2*w images were obtained as single-echo GRE sequences with long echo times (e.g., 10-15 ms) to impart T2* weighting. While opposed-phase and in-phase (OP and IP) imaging was developed for liver fat detection it also permits iron detection because the second echo has a longer echo time than the first echo and is therefore more T2* weighted (Figures 1 and 5). Most commercial 1.5T scanners implement the dual echo sequence using an OP-IP sequence design: the first echo has a TE of about 2.3ms (OP at 1.5T) and the second echo has a TE of about 4.6ms (IP at 1.5T). On such sequences, appreciable signal loss between the first echo (OP) and the second echo (IP) indicates short T2* decay and suggests the presence of parenchymal iron. The normal liver has a long T2* relaxation time (greater than 20ms) and loses only minimal signal intensity across closely spaced gradient echoes; iron accumulation, however, shortens the transverse relaxation and increases the amount of signal intensity loss. Concomitant liver steatosis may confound the interpretation, however, because signal loss due fat-water signal cancellation on the first echo (OP) may mask or even dominate T2* signal decay on the second echo (IP).
Many commercial 3T scanners implement the dual echo sequence using an IP-OP sequence design: the first echo has a TE of 2.3 ms (IP at 3T) and the second echo has a TE of about 5.8 ms (OP at 3T) (Figure 4). On IP-OP design sequences, signal loss on the second echo is nonspecific as it could be attributable to steatosis with fat-water signal cancellation, iron overload with short T2*, or coexisting steatosis and iron overload with both fat-water signal cancellation and short T2*. Thus, caution should be exercised in the interpretation of any T2*w GRE image if the TE is nominally OP because tissue hypointensity could be attributed to fat-water signal cancellation, T2* shortening, or both. If the IP-OP dual echo sequence shows signal loss on the second echo, obtaining a non-fat-saturated T2w sequence may help: moderate to marked hypointensity of the liver on the T2w image suggests iron overload while higher-than-normal signal intensity of the liver suggests fat.
Advanced MR Imaging for Quantification of Liver Iron
While detection of liver iron using qualitative MRI is possible, qualitative MRI methods do not reliably assess the degree of iron overload and hence does not reliably guide treatment initiation or therapy monitoring. This requires quantitative methods that can predict the exact LIC based on MRI data. An ideal technique would measure LIC accurately over its entire clinical range from 2 mg Fe/g dry weight (36 μmol Fe/kg) to over 40 mg Fe/g dry weight (720 ul Fe/g dry weight)59 in a manner that is reproducible across most clinical MRI platforms. Two general MRI-based strategies for measuring LIC are
Signal intensity ratios (SIR) based on T2w or T2*w imaging
Relaxometry based on T2 or T2* relaxation times (or R2 or R2* relaxation rates)
While the methods differ in their details, as discussed later, they fundamentally have the same approach. For each method, MR images are obtained and MRI measurements (signal intensity ratios or relaxation times) are made. The MRI measurements are compared cross-sectionally to chemically determined LIC values from liver biopsies in huma13n subjects to generate empirical calibration curves10, 60. An empirical approach is required, because there is not yet sufficient understanding of the underlying relaxation mechanisms to derive the curves based on first principles. Owing to the sampling variability of LIC values derived from biopsy samples, large numbers of subjects are required to generate reliable calibration curves that may be suitable for eventual implementation into clinical practice.
In the sub-sections below, we discuss the two strategies (SIR and relaxometry), review the leading specific methods for each strategy, and discuss their relative advantages and disadvantages. We conclude the section on iron quantification with a discussion on current limitations and unsolved problems.
Signal intensity ratio (SIR)
In SIR methods, the signal intensity of the liver on spin-echo or gradient echo sequences is divided by the signal intensity of a reference tissue that does not accumulate iron (e.g. fat, skeletal muscle) or noise38, 61-66. To reduce depth-dependent signal intensity drop off, images are acquired using a body coil62. Large regions-of-interest are placed in the liver and the reference object on the same image, while avoiding artifacts, vessels, and boundaries. The mean signal intensity of the liver ROIs is then divided by the mean signal intensity of the reference ROIs. Comparison to a reference is necessary because the absolute signal intensity measured by MRI is arbitrary and depends on acquisition parameters and instrumentation. The most commonly used reference is skeletal muscle. One advantage of using skeletal muscle is that liver usually has higher signal intensity than muscle, so visual comparison can corroborate a slight decline in relative liver signal intensity. Moreover, acquisition parameters such as voxel size or bandwidth only minimally impact the liver-to-muscle ratio while these parameters may alter the liver-to-noise ratio considerably. The use of adipose tissue as a reference is problematic because the signal intensity of fat varies strongly with echo time and measurements of fat signal may be difficult in children and thin adults.
While many SIR methods have been proposed, the leading such method is the one described by Gandon et al62. In this method, five breath-hold GRE sequences are obtained while adjusting the flip angle or TE (as listed in Table 1) to modulate the weighting and generate nominally T1-weighted, proton density-weighted, or mildly, moderately, or heavily T2*-weighted images. On each sequence, the liver signal intensity is measured in three operator-defined regions of interest in the peripheral aspect of the right lobe, while muscle signal intensity is measured in two regions of interest on right and left paraspinous muscles (Figure 6). The mean liver signal intensity is then divided by the mean muscle signal intensity to yield a liver/muscle ratio. The authors evaluated this technique in 149 patients with LIC values ranging from 36 to 709 μmol Fe/g. By combining the signal intensity ratio data from the five sequences, they designed a computer-based algorithm (available at http://www.radio.univ-rennes1.fr) that 62estimate the LIC with high accuracy (mean difference of 0·8 μmol/g (95% CI –6·3 to 7·9) over a range of LIC values from 3 to 375 μmol Fe/g dry weight (0.2 to 20.9 mg iron/g dry weight).
Table 1. Gandon, St. Pierre, and Wood Acquisition Techniques [comp, set this table vertically on the page, do not turn it sideways].
| Author | Method type | Sequence type | Number of acquisitions | Acquisition parameters | Total scan duration |
|---|---|---|---|---|---|
| Gandon | SIR | Single-echo gradient echo | 5 breathheld acquisitions | TR 120 ms | 10 minutes |
| FA 90° – TE 4 ms | |||||
| FA 20° – TE 4 ms | |||||
| FA 20° – TE 9 ms | |||||
| FA 20° – TE 14 ms | |||||
| FA 20° – TE 21 ms | |||||
| St. Pierre | R2 | Single-echo spin echo | 7 free-breathing acquisitions | TR 2500 ms | 20+ minutes |
| TE 6, 7, 8, 9, 12, 15, 18 ms | |||||
| Wood | R2* | Single-echo gradient echo | 17 during a single breathhold | TR 25 ms | One breathhold |
| FA° 20 | |||||
| TE 0.8 – 4.8 ms at 0.25 ms intervals |
Note.–SIR = signal intensity ratio. TR = repetition time. FA = flip angle. TE = echo time.
Figure 6.

Quantification of iron can be performed using multiple gradient echo images acquired with T1 weighting (TE=4ms, flip=90°), and increasing amounts of T2* weighted (TE=4, 9, 14 and 21ms, with flip = 20°) according to Gandon et al62. At least three ROI's are placed in the liver, and two in the muscle to provide normalization for B1 sensitivity and provide signal ratios. ROI's are propagated to all 5 images and values entered in the website available on-line at: http://www.radio.univ-rennes1.fr/Sources/EN/HemoCalc15.html. Based on the signal intensities entered, an estimated LIC is provided automatically.
Although promising, the Gandon method has limitations. In principle, the liver-to-muscle ratio is affected by numerous variables including choice of sequence (spin-echo or gradient echo), scan parameters (field strength, repetition time, echo time, flip angle), and type of coil (surface or body) used. Thus, standardization of parameters is necessary. Even with standardization of parameters, however, LIC estimates made by the Gandon method depend on the scanner type67, suggesting that results may not be reproducible across platforms or sites. Also, the liver-to-muscle ratio derived from each sequence has a different empirical correlation with chemically determined LIC values as well as a different dynamic range. Initially, the curves are linear and show decline of the liver-muscle ratio with increasing LIC, but all sequences eventually saturate (ie, the liver muscle ratio has reached the noise floor and cannot decline further with increasing LIC values)62. Consequently, the method cannot quantify LIC values greater than 375 μmol/kg (20.9 mg/kg) and hence does not capture the entire relevant range of values59. Another limitation is that biological factors (e.g., hepatic steatosis and fat with muscle fascial planes) may confound the interpretation, as these factors are known to affect the signal intensity of the liver and muscle, respectively. Chemical fat saturation can be applied to reduce the confounding effects of fat, but this requires homogenous fat saturation of both the liver and the reference tissue. Also, body habitus may affect the homogeneity of the signal intensity across the image and complicate the analysis of signal intensity ratios. Finally, the technique requires several breathholds and total acquisition time including inter-breathhold intervals is about 10 minutes65.
Relaxometry
Overview
Compared to SIR methods, relaxometry is a theoretically more robust approach for estimating LIC. In relaxometry, a series of images is acquired with increasing echo times, the signal intensity of the tissue of interest (e.g., liver) is modeled as a function of echo time, and signal decay constants (e.g., T2 or T2*) are calculated68. As opposed to SIR methods, in which the signal intensity of two tissues (e.g., liver and reference tissue) is compared at a given TE, relaxometry models the signal intensity of a single tissue (e.g., liver) across multiple TEs. Because the tissue of interest is measured at a co-localized location at each TE, depth-dependent signal intensity changes in the image do not confound the results. Thus, use of surface coils to acquire the data is acceptable. Depending on whether a spin-echo or gradient-echo based sequence is performed, T2 or T2* values can be calculated. Some investigators report rates of signal decay, R2 or R2*, instead of the time constants T2 or T2*. These rates are simply the reciprocals of T2 and T2*, ie: R2 = 1000/T2 and R2* = 1000/T2*. Typically, T2 and T2* are expressed in ms, while R2 and R2* are expressed in s-1. The observed T2 or T2* value is inversely related to the iron concentration: the lower the T2 or T2*, the greater the iron concentration. By comparison, the observed R2 or R2* value is directly related to the iron concentration: the greater the R2 or R2*, the greater the iron concentration. The time (T2 or T2*) or rate (R2 or R2*) calculations can be repeated pixel by pixel from the co-registered images to generate parametric maps (Figure 7). These maps demonstrate the quantity and distribution (Figures 7-9) of the measured parameter. By placing regions of interest on the maps, representative parameter (T2, T2*, R2, R2*) values can be recorded. The R2 or R2* values can be used for diagnosis or treatment monitoring (Figure 10).
Figure 7.
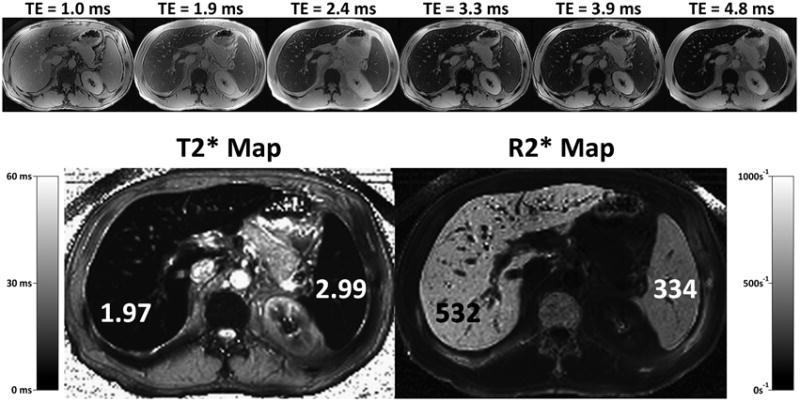
R2* mapping can be performed in a single breath-hold using rapid gradient echo methods that acquire multiple images at increase echo times, within the same TR. Results are typically displayed as an R2* map (bottom right), where areas of high iron concentration appear bright. Alternatively, results can also be displayed as a T2* map (bottom left), which may be more intuitive since regions of elevated iron appear dark, corresponding to the appearance of iron overloaded tissue in heavily T2* weighted images. Both approaches are equally valid.
Figure 9.

R2* map shows scattered siderotic nodules (arrows) in a patient with alcoholic cirrhosis. C = cava. Ao = aorta. St = stomach. Sp = spleen. The liver margins have been highlighted in black to improve demarcation of the liver.
Figure 10.

R2* maps can be used to monitor treatment for iron overload, as with this 52 year old female with known genetic hemochromatosis. R2* maps acquired 1 year after treatment with phlebotomy demonstrate a marked decrease in R2* from 185s-1 to 96s-1, with a corresponding decrease in the serum ferritin, which is an indirect marker of iron overload. These particular R2* maps were acquired with the Yu method which automatically produces an R2* map as part of the correction needed for fat quantification.
Technical issues
Key technical issues in performing relaxometry are (a) field strength, (b) parameter of interest (R2, R2*), (c) pulse sequence design, (d) choice of TEs, and (e) model for data fitting. These are discussed below.
Field strength
Relaxation rates R2 and R2* increase with field strength8, 10, 69. Due to the dependency of relaxation rates on field strength, calibration curves obtained at one field strength (e.g., 1.5T) cannot be transferred directly to another field strength (e.g., 3T). Thus, calibration curves at different field strength should be derived and validated. Also, while 3T imaging provides higher signal to noise than 1.5T, it has theoretical disadvantages for LIC estimation. For example, susceptibility artifacts are worse than at 1.5T, which may degrade grade echo image quality19. More importantly, due to faster signal decay at 3T, the maximum quantification limit may be lower than at 1.5T19, potentially lowering the utility of 3T scanners for iron quantification.
Parameter of interest (R2 or R2*)
R2 and R2* methods have different theoretical advantages and disadvantages. R2 measurements are less sensitive than R2* measurements to confounding factors unrelated to iron content; these include technical factors (scanner, voxel size and shape, receive bandwidth), external magnetic inhomogeneities, and artifacts caused by metal clips, gas-soft tissue interfaces, and other sources of susceptibility2, 70. By comparison, R2* measurements are less sensitive than R2 measurements to variations in the size and distribution of iron particles71 and hence are less confounded by factors (e.g., etiology and severity of iron overload, presence and severity of cirrhosis) that affect these features57. Another advantage of R2* techniques is that they can be performed in a single breath-hold55, 57, 72-75, while R2 techniques take 5 to 20 minutes (depending on methodology)23, 70, 76.
While there is not yet consensus regarding the optimal relaxation rate parameter (R2 or R2*) for LIC estimation, R2 and R2* values generated comparable noninvasive estimates of LIC in a recent study77. Given the much shorter acquisition time required for R2* techniques, the use of R2 techniques may be difficult to justify if additional studies confirm equivalent accuracy.
Pulse sequence design
R2 can be measured using a series of single spin-echoes, each acquired after a separate excitation23, 25, or a train of spin-echoes, each acquired after a single excitation (i.e., a Carr-Purcell-Meiboom-Gill, or CPMG, sequence)20, 25, 68, 78. Compared to those made with a series of single spin-echoes, R2 measurements made with a train of spin-echoes will be lower (due to more frequent application of refocusing pulses) and will vary with the echo spacing2, 79. R2* is usually measured using a breath-hold multi-echo gradient echo technique72, 80, as most modern scanners now permit acquisition of multiple co-registered gradient-echo images across a range of echo times after a single excitation. In general, R2* measurements made with a multi-echo GRE technique are less affected by echo spacing than R2 measurements made with an echo-train spin-echo (CPMG) technique.
Choice of TE
To reliably measure relaxation parameters, it is important that the TEs span the range of expected clinically relevant T2 (2.5 to 60 ms) or T2* (0.5 to 30 ms) values70. Optimally, the first echo time should be as short as possible: 5 ms or less for spin-echo (T2 measurements) and 1 ms or less for gradient echo (T2* measurements) sequences70. The last echo time should be as long as reasonable without degradation by motion and other artifacts. Practically, this usually corresponds to a TE of 15 to 30 ms for spin-echo (T2 measurements) and 10 to 15 ms for gradient echo (T2* measurements) sequences70.
The optimal number of echoes has not been determined. Two reasonable approaches would be to acquire as many echoes as possible between the first and last echoes or to space the echoes logarithmically. To achieve the appropriate echo spacing, it may be necessary to utilize a small frequency matrix (192 or 224), fractional echo sampling, and high receive bandwidth (>100 kHz).
Liver fat alters the signal decay observed in hepatic tissue and may confound the T2* measurements. To suppress the potentially confounding signals from fat, one option is to collect echoes only at in-phase echo times, but this approach is problematic in heavily iron-overloaded livers. In such livers, considerable signal decay may occur by the first in-phase echo time (2.3 ms at 3T, 4.6 ms at 1.5T), and sampling of the decay curve may be inadequate for reliable R2* estimation. The use of quantitative MRI techniques in patients with coexisting steatosis and iron overload is discussed further in a subsequent section.
Model for data fitting
The simplest model for data fitting is a monoexponential model given by,
| (3) |
Where, S is measured signal intensity and A is the signal intensity expected at TE = 0. An important limitation is that the model assumes uniform iron concentration within each tissue voxel. This assumption is incorrect60, as voxels may contain both iron-dense (iron-loaded hepatocytes and/or Kupffer cells) and iron-sparse components (bile, blood, interstitial fluid)70. The iron-dense component generates rapidly decaying signal, while the iron-sparse component generates slowly decaying signal. The mono-exponential model assumes, as a simplification, that a single exponential describes the contributions of both components; while a mono-exponential model describes the early part of the composite signal decay curve reasonably well (i.e., over early echo times), it may not describe the tail end of the composite signal decay curve (i.e., over late echo times). Also, the model neglects the confounding effect of image noise. Transverse relaxation measurements are usually derived from magnitude MR images. Such images have non- zero baseline signal intensity owing to the presence of additive noise (noise in the real and imaginary components of the complex MR signal has a Gaussian distribution with zero mean, but noise in the displayed magnitude image has a Rician distribution with non-zero mean). The additive noise produces a signal level offset in the magnitude images, prevents the observed signal intensity from decaying to zero25, and prolongs the apparent decay curve81. Ignoring the long-T2* contribution of the iron-sparse component and the confounding effect of Rician noise in magnitude images introduces estimation errors: the time constants T2 and T2* are overestimated while the rate constants R2 and R2* are underestimated70.
Numerous data-fitting models have been proposed to address the limitations of the mono-exponential model23, 25, 33, 55, 60, 81, 82, including those listed below.
Monoexponential with truncation (echoes with low signal intensity are excluded until a good fit to mono-exponential decay is achieved).
Monoexponential model with weighting (signal decay is assumed to be exponential but progressively less weight is given to echoes with decreasing signal intensity).
- Monoexponential model with offset (a constant offset is added to account for noise and long T2* components. The model is given by,
(4) Monoexponential model with baseline subtraction (measured image noise is subtracted directly from the tissue signal intensity at each echo time; the corrected signal intensity of the tissue is then entered into a mono-exponential model).
- Bi-exponential model (two components are modeled: an iron-dense, short-T2* component and an iron-sparse, long-T2* component). The model is given by,
(5)
Where, A and B are the iron-dense, short-T2*and iron-sparse, long-T2* components, respectively).
Each of the five models has advantages and disadvantages, and consensus has not yet been reached regarding which model is optimal. For example, while the bi-exponential model provides a more complete description of the multi-component nature of liver tissue, it has four degrees of statistical freedom70. This makes the fitting process unstable unless mathematical constraints are imposed. Further research is needed to identify the most accurate model.
Specific relaxometry methods
Numerous specific methods to measure R2 and R2* for LIC estimation have been published. The most rigorously validated methods are those of St. Pierre et al. (R2 mapping)2, 59, 76 and Wood et al. (R2* mapping)77, and are discussed below:
St. Pierre method (FerriScan®
The St. Pierre method59, 76 was approved by the Food and Drug Administration (FDA) and is marketed as FerriScan® (http://www.ferriscan.com/). The method uses seven T2-weighted single spin-echo free-breathing sequences under fixed gain control with constant TR and increasing TE spaced at 1-3 ms intervals 76. Images are acquired in half-Fourier mode to reduce acquisition time. An external calibration phantom with very long T2 is placed within the field of view to permit correction for instrumental drift across sequences. Image analysis is centralized and requires several post processing steps including gain drift correction60, respiratory motion correction, background noise subtraction60, estimation of effective initial signal intensity at zero TE, and bi-exponential modeling pixel by pixel to generate liver R2 parametric maps2, 60. (The model assumes a dual-compartment system with slow-R2 and fast-R2 components. The R2 values of the slow and fast components are computed from the model. The composite R2 is calculated as the average of the R2 values of the individual components weighted by their relative population densities in each voxel). The largest slice is then selected and the mean composite R2 value across the slice is calculated.
The authors evaluated this technique in over 100 patients with LIC values ranging from 0.3 to 42.7 mg Fe/g dry weight (5to 747 μmol Fe/g). Liver R2 demonstrated a curvilinear relationship with LIC over the entire LIC range with a correlation coefficient of 0.9876. The iron concentration could be predicted from the measured liver R2 as:
| (6) |
with prediction errors comparable to those expected from the variability in liver biopsy (22,23).
The curvilinear relationship between R2 and LIC indicates that R2 values plateau at high LIC values. The plateau has been attributed to clustering of iron into large aggregates in patients with severe iron overload76, 77. These aggregates are thought to cause magnetic inhomogeneities greater than the diffusion-dependent movement of water molecules. In the presence of such large inhomogeneities, diffusing water molecules experience a relatively constant magnetic field between excitation and refocusing pulses and hence there is relatively little diffusion-dependent dephasing and signal decay.
Although FDA approved, the St. Pierre method has limitations. The data analysis is centralized and cannot be completed directly by the radiologist. An external calibration phantom is required. Acquisition time is long (∼20 minutes) due to the multiple free-breathing sequences. Finally, as the relationship between R2 and LIC is curvilinear, the method is relatively insensitive to longitudinal changes in LIC in patients with extreme iron overload, which may limit the suitability of the technique for monitoring such patients.
Wood method
The Wood method uses 17 T2*-weighted single-echo gradient echo sequences in a single-breathhold with constant TR, constant flip angle, and increasing TE spaced at equal 0.25 ms intervals (as listed in Table 1)83. Dummy scans are performed to achieve longitudinal steady-state prior to data acquisition. R2* is measured by fitting the observed data to a mono-exponential model with offset (data fitting model 3 listed above) pixel by pixel to generate a parametric map. The mean R2* value from all liver pixels on a single midhepatic slice is the calculated, excluding major vessels and areas of susceptibility artifact such as lung-liver interfaces.
The authors evaluated this technique in over 20 patients with LIC values ranging from 1.3 to 32.9 mg iron/g dry weight (23 to 590 μmol iron/g dry weight). Liver R2* demonstrated a linear relationship with LIC with a correlation coefficient of 0.97. The iron concentration could be predicted from the measured liver R2* as:
| (7) |
with prediction errors comparable to those of the St. Pierre method. In an independent confirmatory study, Hankins et al. derived a similar calibration curve using a single-breath-hold R2* technique in a separate patient population80.
Importantly, the linear relationship between R2* and LIC indicates that R2* values do not plateau at high LIC values, presumably because R2* values are relatively unaffected by iron particle size and distribution. A limitation of the Wood method is that quantification linearity has been shown only up to a LIC of 32.9 mg iron/g dry weight. Further study is needed to determine if the Wood method maintains linearity through the upper end of LIC values encountered clinically. It is possible that linearity is not maintained: in the authors' study, a single patient had a LIC of 57.8 mg iron dry/weight; this patient's R2* value underestimated the chemically determined LIC and the patient was excluded from analysis77. A possible reason for LIC underestimation by the Wood method in patients with extreme iron overload is that the first echo time of 0.8 msec may be too long to reliably measure ultra fast signal decay signal decay. For such measurements, it may be necessary to utilize sequences with ultra short first echo times 83.
Current limitations of MRI-based iron quantification methods
While published SIR and relaxometry methods have shown high accuracy for predicting LIC values, limitations remain. Most importantly, all current MRI methods are based on a “black box” approach in which MR measurements are correlated with chemically determined LIC values to derive empirical calibration curves13, 82. This is in contradistinction to PDFF, the biomarker for liver fat accumulation, which is based on first principles. A consequence of the black box approach for MRI-based iron quantification is that recalibration in patients in necessary for any pulse sequence modifications, even minor changes such as TR – a tedious, time-consuming, and expensive process13. Furthermore, an empirical approach is not suitable for extrahepatic organs that may accumulate iron such as heart, brain, pituitary, and pancreas. Finally, empirical approaches implicitly assumes that iron is the only variable that affects the MRI parameter being measured, even though many biological and technical factors may confound the MRI measurement-LIC calibration8, as described briefly below.
Iron particle size, distribution, and other features
Iron deposits in the iron-overloaded liver show heterogeneity in size and distribution over spatial scales spanning three orders of magnitude13:
intracellular (variable number and size of iron particles within different parts of individual cells; spatial scale in microns)
intercellular (variable amount of iron in adjacent cells; spatial scale tens of microns)
zonal (variable amount of iron between aggregates of cells in different zones of the hepatic lobule; spatial scale hundreds of microns).
The loading factor of ferritin varies widely from 2500 to over 4500 iron atoms per molecule10. MRI particles may have round, cylindrical, or irregular shapes84. These features (particle size, distribution, loading factor, and shape) may vary between individual patients, between patient groups, or in response to different chelating agents11, 85. They are thought to affect the relationship between LIC and R2 relaxation values10, 11, 71, 84, 86, 87 and, because they cannot be determined non-invasively, introduce unavoidable error in R2-based LIC estimation. Finally, the biochemical form of the iron (hemosiderin vs ferritin) is known to impact relaxivity measurements in vitro, and possibly affect signal relaxation in vivo.
Technical factors
Numerous technical factors may confound the MRI measurement-LIC calibration curve. These include field strength8, 69, type of sequence (spin-echo, CPMG, fast spin-echo, gradient echo)13, echo spacing13, 60, 84, 87, voxel size and shape, receive bandwidth, type of coil (surface or body), and data fitting model13, 60, 81. The effect of many of these factors on MRI-based LIC estimation has not been well studied.
Normal variability
The range of liver T2 and T2* values in individuals without iron overload is wide. For example, Schwenzer et al. found that normal T2* values ranged from 14 to 46 ms at 1.5T (mean 28 ms, standard deviation 7 ms)74. The wide range of T2 and T2* values in individuals without iron overload is in contradistinction to PDFF, the liver steatosis biomarker, which varies narrowly in individuals without excess liver fat. The wide T2 and T2* range makes relaxometry methods inherently inaccurate for quantifying mild iron overload; the reason is that depending on an individual's baseline T2 or T2* value, the amount of iron in mild overload states may fail to drive the T2 or T2* into the abnormal range. Thus, while relaxometry methods may be accurate for quantifying iron in subjects with moderate to severe iron overload (e.g., patients with thalassemia or HH), they may not be accurate for quantifying iron in subjects with mild iron overload (e.g., patients chronic hepatopathy and secondary iron overload).
Concomitant fibrosis, inflammation, and fat
Hepatic fibrosis and inflammation may confound the MRI measurement-LIC relationship because they prolong T2 relaxation and so may partially offset the T2-shortening effect of iron9. Also, both inflammation and fibrosis are associated with restricted diffusion of water molecules in the liver parenchyma88, 89. As the effects of diffusion contribute strongly to iron-mediated relaxation mechanisms13, 17, 84, diffusion restriction may reduce the sensitivity of relaxation parameters to the presence of iron. Moreover, fibrosis alters the spatial distribution of iron2, which may affect R2 as discussed above. The confounding effect of fat is discussed in the next section.
Quantification of Iron and Fat when both are Present
Does the presence of fat corrupt our ability to quantify iron? Some investigators have described the use of T2* weighted imaging 63 and multi-echo R2* map measurements by only acquired “in-phase” echoes77. If fat had a single discrete NMR peak, this would be an excellent approach to avoid the effects of fat when quantifying R2*. However, fat signal is never truly “in-phase” except at TE=0. The interference of the multiple resonance peaks of fat leads to destructive interference that accelerates signal decay, shortening the apparent T2* (T2*app). Figure 11 contains a simulation that illustrates the signal behavior of tissue containing 0%, 20% and 40% fat with a true T2* of 25ms, all at 1.5T. When signal is acquired at three “in-phase” echo times (4.6ms, 9.2ms, 13.8ms) and the apparent T2* is estimated, considerable error results due the accelerated signal decay from the interference caused by the multiple peaks of fat, with apparent T2* of 25ms (as expected), 21ms and 18ms for 0% fat, 20% fat and 40% fat, respectively. Figure 12 further illustrates this point by demonstrating that the estimated T2* is highly dependent on the number of “in-phase” echoes, contrary to the concept that exponential signal decay time constants, are, by definition, independent of the echo times.
Figure 11.

Fat corrupts the ability of gradient echo methods to quantify T2* using conventional multi-echo imaging methods. In the simulation shown in this figure, the signal from a water-fat mixture with increasing amounts of fat at 0% (black), 20% (red) and 40% (blue) are shown for a true T2*=25ms at 1.5T. Even when images are acquired “in-phase” (asterisks) the fitted values of T2* are inaccurate when fat is present. This occurs because the spectral complexity of fat causes fat to interfere with itself and accelerates the effective signal decay. In order to measure T2* accurately, simultaneous measurement of fat and T2* is necessary, including spectral modeling of fat, such as performed by the methods of Bydder et al and Yu et al. Without simultaneous measurement of fat and T2* with spectral modeling, it is not possible to measure fat-concentration and iron concentration (indirectly through T2*), when both iron and fat are present.
Figure 12.

The number of echoes used to quantify iron (indirectly, through measurement of T2*) also impacts the ability of MRI to measure T2*, when fat is present. The presence of fat creates a complicated signal pattern due to the interference of multiple fat peaks, leading to signal decay that is no longer monoexponential. Without simultaneous measurement of fat and T2*, including spectral modeling, the ability of MRI to measure T2* accurately is corrupted, even when images are acquired at “in-phase” echo times (squares). In this simulation the true T2*=25ms, and the fat-fraction is 40%.
The ability to measure iron through T2* decay (R2* mapping) is therefore, heavily influenced by the presence of fat. Thus, it is not possible to measure fat-fraction and R2* without measuring the two simultaneously. Fortunately, three groups have described methods that simultaneously estimate water and fat signals, along with T2* decay 90-93. Although these methods were all developed primarily in the context of measuring fat-fraction, they also offer new opportunities to quantify R2* by correcting for the presence of fat. Importantly, as demonstrated in Figures 11 and 12, the multiple peaks of fat are the primary reason why the presence of fat creates bias in the measurement of R2*. Therefore, measurement of R2* in the presence of fat should incorporate spectral modeling of fat into their T2* correction methods 91 90, 92. To date, only the methods of Bydder et al91 and Yu et al90, 92 incorporate both the effects of T2* decay and spectral modeling.
Figures 13 through 16 show examples of patients with co-existing steatosis and iron overload imaged using the methods of Bydder et al and Yu et al, that both provide a simultaneous proton density fat-fraction (PDFF) map and an R2* map. Interestingly, in Figure 14, the conventional IOP images demonstrated nearly identical signal intensity between the in-phase and opposed-phase images, indicating that the effects of iron and fat exactly balanced one another in this case. The complex method of Yu et al92 measured 13.5% fat and T2*=9.6ms, both of which are abnormal and clinically important. Figure 15 shows a different patient with severe steatosis (36.5% PDFF) and coexisting iron overload (T2*=9.4ms). Figure 16 shows an example of diffuse steatosis with nodular areas of focal fat, with superimposed iron overload imaged with 2-point IOP and the method of Bydder et al91 that illustrates the importance of T2* correction and spectral modeling when both fat and iron are present.
Figure 13.

IOP imaging in a 60 year old male with known genetic hemochromatosis shows paradoxical decrease in signal on the in-phase images (middle column) because these images are more heavily T2* weighted (TE=4.6ms, compared to 2.3ms for opposed-phase images). R2* maps measured using the Yu method demonstrate dramatically shortened T2* in the liver (4.0ms) as well as the pancreas (arrow, T2*=5.0ms). Note that while the liver and pancreas are affected, the spleen is spared, typical of genetic hemochromatosis.
Figure 16.

Simultaneous measurement of fat-fraction and R2* using the Bydder method. Multiple unusual hypodense lesions were identified at CT (not shown), concerning for metastatic disease. Conventional IOP imaging reveals multiple hypointense nodules, best seen on OP images (left) corresponding to the hypodense nodules seen on CT. Fat signal fraction (FSF) calculated with 2-point IOP imaging (equation 2) shows no evidence of liver fat, because of T2* shortening. PDFF and R2* maps measured with the Bydder method show diffuse fatty liver with nodular areas of focal fat, as well as elevated R2* (shortened T2*) in both the liver and spleen suggestive of hemosiderosis.
Figure 14.

Fat and iron corrupt the ability to detect and quantify the other using IOP imaging. In this obese patient with hemosiderosis, the signal intensity of the in-phase and opposed-phase images are essentially equal, suggesting that the liver is normal. However, quantitative imaging with the complex method of Yu et al92 shows markedly decreased T2* (9.6ms) and abnormally high fat concentration (13.5%) demonstrating how the presence of iron and fat corrupt the ability to measure the other, unless both are measured simultaneously. Also, note the shortened T2* in the spleen, consistent with hemosiderosis. Images courtesy Vasanawala, MD, PhD, Stanford University, Stanford, CA and Huanzhou Yu, PhD, MR Global Applied Science Lab, GE Healthcare, Menlo Park, CA.
Figure 15.

High fat concentrations and elevated iron can coexist, necessitating the use of methods such as those by Bydder et al91 and Yu et al92 that can simultaneously estimate PDFF and T2*. In this obese patient with hemosiderosis, the PDFF measured with the complex method of Yu was 36.5%, and the T2* was 9.4ms, both highly abnormal. Images courtesy Vasanawala, MD, PhD, Stanford University, Stanford, CA and Huanzhou Yu, PhD, MR Global Applied Science Lab, GE Healthcare, Menlo Park, CA.
An important assumption made by these methods is that the T2* decay of water and fat are either the same90 or closely dependent on one another91. Differences in T2* decay between water and fat will lead to an averaging effect if a common T2* decay parameter is assumed in the signal model. Very recently, Chebrolu et al described a reconstruction approach that allows independent estimation of T2* of water and fat, including the effects of spectral fat modeling94. This method was shown to improve quantification of fat and iron in a water-fat-SPIO phantom. O'Regan et al 93 have described a magnitude-based method that allows independent estimation of T2* for water and fat, although they did not incorporate spectral modeling of fat. This work measured the T2* of water and fat to be 21.8±6.7ms and 4.6±1.8ms, respectively, in five healthy volunteers. By comparison, Schwenzer et al measured the average T2* in 129 healthy volunteers, measuring an average of 25.4 ± 6.0 ms74. These results suggest that the method of O'Regan et al underestimates the T2* of fat, and possible water, possibly due to the interference of the multiple fat peaks that causes apparent accelerated signal decay.
The effects of fat on iron estimation methods that acquire T2 weighted imaging or R2 maps using spin-echo techniques deserve a mention. Images acquired with these methods acquire signal at spin-echoes where the phase of water and all fat peaks are in-phase. Thus, the destructive interference effects of fat that occur with R2* methods will not be a factor with R2 methods. However, there is a dilutional effect of fat that may impact both R2* and R2 methods. Iron deposits in the liver exist in the form of iron oxide crystal within the cytoplasm of cells. Thus, they may have a differentially greater magnetic field perturbation on water signal, compared to fat signal. This could lead to bioexponetial decay of water and fat signals due to a mixing or dilutional effect from fat. The overall impact and importance of this effect remains to be determined, but should be considered in future studies in patients with concomitant iron overload and steatosis.
Summary
Despite incomplete understanding of the underlying relaxation mechanisms, clinical studies have empirically established calibration curves that accurately predict chemically determined LIC values from MRI measurements (SIR, R2, R2*). The leading methods are the ones published by Gandon (SIR), St. Pierre (R2), and Wood (R2*). The St. Pierre method is FDA approved and commercially available (with a service charge), but is time consuming to perform. Preliminary studies suggest the Wood method may be of comparable accuracy but requires a single breathhold. A limitation of all SIR, R2, and R2* methods is that they are based on empirical approaches. Many factors may confound the results but are not yet well understood.
New biomarkers of iron have the potential of benefitting a large number of patients with liver disease, due to increasing availability of MR technology and decreasing cost of MR exams over the past decade. Today, estimated 10,000 to 15,000 MRI scanners are operational in US, which translates to approximately 30 to 45 MRI scanners per million95. MRI scanners are now commonly found in both urban and rural communities and considered as accessible as CT and US. Moreover, it is generally agreed that MRI is more accessible than liver biopsy. The use of MRI as a quantitative biomarker of intracellular liver iron overload has shown tremendous progress in recent years and hold great promise to provide accessible and accurate evaluation of diffuse liver disease.
Figure 8.

R2* map (below) is the reciprocal of T2* map (above). Both maps depict the distribution of iron in the liver. In this patient, the left lobe has greater iron content than the right lobe, and it appears darker than the right lobe on the T2* map and brighter on the R2* map. As illustrated in this case, R2* maps may depict heterogeneity in iron distribution to better advantage than T2* maps because of their wider gray-level dynamic range.
References
- 1.Brittenham GM, Cohen AR, McLaren CE, et al. Hepatic iron stores and plasma ferritin concentration in patients with sickle cell anemia and thalassemia major. Am J Hematol. 1993 Jan;42(1):81–85. doi: 10.1002/ajh.2830420116. [DOI] [PubMed] [Google Scholar]
- 2.St Pierre TG, Clark PR, Chua-Anusorn W. Single spin-echo proton transverse relaxometry of iron-loaded liver. NMR Biomed. 2004 Nov;17(7):446–458. doi: 10.1002/nbm.905. [DOI] [PubMed] [Google Scholar]
- 3.Alustiza JM, Castiella A, De Juan MD, Emparanza JI, Artetxe J, Uranga M. Iron overload in the liver diagnostic and quantification. European Journal of Radiology. 2007;61(3):499–506. doi: 10.1016/j.ejrad.2006.11.012. [DOI] [PubMed] [Google Scholar]
- 4.Bothwell TH, Charlton RW. A general approach to the problems of iron deficiency and iron overload in the population at large. Semin Hematol. 1982 Jan;19(1):54–67. [PubMed] [Google Scholar]
- 5.Cook JD, Skikne BS, Lynch SR, Reusser ME. Estimates of iron sufficiency in the US population. Blood. 1986 Sep;68(3):726–731. [PubMed] [Google Scholar]
- 6.Pietrangelo A. Hereditary hemochromatosis--a new look at an old disease. N Engl J Med. 2004 Jun 3;350(23):2383–2397. doi: 10.1056/NEJMra031573. [DOI] [PubMed] [Google Scholar]
- 7.Siegelman ES, Mitchell DG, Semelka RC. Abdominal iron deposition: metabolism, MR findings, and clinical importance. Radiology. 1996 Apr;199(1):13–22. doi: 10.1148/radiology.199.1.8633135. [DOI] [PubMed] [Google Scholar]
- 8.Gossuin Y, Muller RN, Gillis P. Relaxation induced by ferritin: a better understanding for an improved MRI iron quantification. Nmr in Biomedicine. 2004 Nov;17(7):427–432. doi: 10.1002/nbm.903. [DOI] [PubMed] [Google Scholar]
- 9.Carneiro AA, Fernandes JP, de Araujo DB, et al. Liver iron concentration evaluated by two magnetic methods: magnetic resonance imaging and magnetic susceptometry. Magn Reson Med. 2005 Jul;54(1):122–128. doi: 10.1002/mrm.20510. [DOI] [PubMed] [Google Scholar]
- 10.Li TQ, Aisen AM, Hindmarsh T. Assessment of hepatic iron content using magnetic resonance imaging. Acta Radiol. 2004 Apr;45(2):119–129. doi: 10.1080/02841850410003680. [DOI] [PubMed] [Google Scholar]
- 11.Brittenham GM, Badman DG. Noninvasive measurement of iron: report of an NIDDK workshop. Blood. 2003 Jan 1;101(1):15–19. doi: 10.1182/blood-2002-06-1723. [DOI] [PubMed] [Google Scholar]
- 12.Andrews NC. Disorders of iron metabolism. N Engl J Med. 1999 Dec 23;341(26):1986–1995. doi: 10.1056/NEJM199912233412607. [DOI] [PubMed] [Google Scholar]
- 13.Ghugre NR, Coates TD, Nelson MD, Wood JC. Mechanisms of tissue-iron relaxivity: nuclear magnetic resonance studies of human liver biopsy specimens. Magn Reson Med. 2005 Nov;54(5):1185–1193. doi: 10.1002/mrm.20697. [DOI] [PMC free article] [PubMed] [Google Scholar]
- 14.Adams P, Brissot P, Powell LW. EASL International Consensus Conference on Haemochromatosis. J Hepatol. 2000 Sep;33(3):485–504. doi: 10.1016/s0168-8278(01)80874-6. [DOI] [PubMed] [Google Scholar]
- 15.Feder JN, Gnirke A, Thomas W, et al. A novel MHC class I-like gene is mutated in patients with hereditary haemochromatosis. Nat Genet. 1996 Aug;13(4):399–408. doi: 10.1038/ng0896-399. [DOI] [PubMed] [Google Scholar]
- 16.Beutler E, Gelbart T, West C, et al. Mutation analysis in hereditary hemochromatosis. Blood Cells Mol Dis. 1996;22(2):187–194. doi: 10.1006/bcmd.1996.0027. discussion 194a-194b. [DOI] [PubMed] [Google Scholar]
- 17.Jensen JH, Chandra R. Theory of nonexponential NMR signal decay in liver with iron overload or superparamagnetic iron oxide particles. Magn Reson Med. 2002 Jun;47(6):1131–1138. doi: 10.1002/mrm.10170. [DOI] [PubMed] [Google Scholar]
- 18.Niederau C, Fischer R, Sonnenberg A, Stremmel W, Trampisch HJ, Strohmeyer G. Survival and causes of death in cirrhotic and in noncirrhotic patients with primary hemochromatosis. N Engl J Med. 1985 Nov 14;313(20):1256–1262. doi: 10.1056/NEJM198511143132004. [DOI] [PubMed] [Google Scholar]
- 19.Wood JC. Magnetic resonance imaging measurement of iron overload. Curr Opin Hematol. 2007 May;14(3):183–190. doi: 10.1097/MOH.0b013e3280d2b76b. [DOI] [PMC free article] [PubMed] [Google Scholar]
- 20.Papakonstantinou O, Alexopoulou E, Economopoulos N, et al. Assessment of iron distribution between liver, spleen, pancreas, bone marrow, and myocardium by means of R2 relaxometry with MRI in patients with beta-thalassemia major. J Magn Reson Imaging. 2009 Apr;29(4):853–859. doi: 10.1002/jmri.21707. [DOI] [PubMed] [Google Scholar]
- 21.Anderson LJ, Wonke B, Prescott E, Holden S, Walker JM, Pennell DJ. Comparison of effects of oral deferiprone and subcutaneous desferrioxamine on myocardial iron concentrations and ventricular function in beta-thalassaemia. Lancet. 2002 Aug 17;360(9332):516–520. doi: 10.1016/s0140-6736(02)09740-4. [DOI] [PubMed] [Google Scholar]
- 22.Ehlers KH, Levin AR, Markenson AL, et al. Longitudinal study of cardiac function in thalassemia major. Ann N Y Acad Sci. 1980;344:397–404. doi: 10.1111/j.1749-6632.1980.tb33678.x. [DOI] [PubMed] [Google Scholar]
- 23.Beaumont M, Odame I, Babyn PS, Vidarsson L, Kirby-Allen M, Cheng HLM. Accurate Liver T-2* Measurement of Iron Overload: A Simulations Investigation and In Vivo Study. Journal of Magnetic Resonance Imaging. 2009;30(2):313–320. doi: 10.1002/jmri.21835. [DOI] [PubMed] [Google Scholar]
- 24.Angelucci E, Muretto P, Nicolucci A, et al. Effects of iron overload and hepatitis C virus positivity in determining progression of liver fibrosis in thalassemia following bone marrow transplantation. Blood. 2002 Jul 1;100(1):17–21. doi: 10.1182/blood.v100.1.17. [DOI] [PubMed] [Google Scholar]
- 25.Bonny JM, Zanca M, Boire JY, Veyre A. T-2 maximum likelihood estimation from multiple spin-echo magnitude images. Magnetic Resonance in Medicine. 1996 Aug;36(2):287–293. doi: 10.1002/mrm.1910360216. [DOI] [PubMed] [Google Scholar]
- 26.Angelucci E, Brittenham GM, McLaren CE, et al. Hepatic iron concentration and total body iron stores in thalassemia major. New England Journal of Medicine. 2000 Aug 3;343(5):327–331. doi: 10.1056/NEJM200008033430503. [DOI] [PubMed] [Google Scholar]
- 27.Fujita N, Sugimoto R, Urawa N, et al. Hepatic iron accumulation is associated with disease progression and resistance to interferon/ribavirin combination therapy in chronic hepatitis C. J Gastroenterol Hepatol. 2007 Nov;22(11):1886–1893. doi: 10.1111/j.1440-1746.2006.04759.x. [DOI] [PubMed] [Google Scholar]
- 28.Pietrangelo A. Non-invasive assessment of hepatic iron overload: are we finally there? Journal of Hepatology. 2005;42(1):153–154. doi: 10.1016/j.jhep.2004.10.009. [DOI] [PubMed] [Google Scholar]
- 29.O'Neil J, Powell L. Clinical aspects of hemochromatosis. Semin Liver Dis. 2005 Nov;25(4):381–391. doi: 10.1055/s-2005-923310. [DOI] [PubMed] [Google Scholar]
- 30.Brittenham GM, Griffith PM, Nienhuis AW, et al. Efficacy of deferoxamine in preventing complications of iron overload in patients with thalassemia major. N Engl J Med. 1994 Sep 1;331(9):567–573. doi: 10.1056/NEJM199409013310902. [DOI] [PubMed] [Google Scholar]
- 31.Borgna-Pignatti C, Castriota-Scanderbeg A. Methods for evaluating iron stores and efficacy of chelation in transfusional hemosiderosis. Haematologica. 1991 Sep-Oct;76(5):409–413. [PubMed] [Google Scholar]
- 32.Drakonaki EE, Maris TG, Maragaki S, Klironomos V, Papadakis A, Karantanas AH. Deferoxamine Versus Combined Therapy for Chelating Liver, Spleen and Bone Marrow Iron in beta-Thalassemic Patients: A Quantitative Magnetic Resonance Imaging Study. Hemoglobin. 2010;34(1):95–106. doi: 10.3109/03630260903546445. [DOI] [PubMed] [Google Scholar]
- 33.Positano V, Salani B, Pepe A, et al. Improved T2* assessment in liver iron overload by magnetic resonance imaging. Magn Reson Imaging. 2009 Feb;27(2):188–197. doi: 10.1016/j.mri.2008.06.004. [DOI] [PubMed] [Google Scholar]
- 34.Bassett ML, Halliday JW, Powell LW. Value of hepatic iron measurements in early hemochromatosis and determination of the critical iron level associated with fibrosis. Hepatology. 1986 Jan-Feb;6(1):24–29. doi: 10.1002/hep.1840060106. [DOI] [PubMed] [Google Scholar]
- 35.Adams PC, Deugnier Y, Moirand R, Brissot P. The relationship between iron overload, clinical symptoms, and age in 410 patients with genetic hemochromatosis. Hepatology. 1997 Jan;25(1):162–166. doi: 10.1002/hep.510250130. [DOI] [PubMed] [Google Scholar]
- 36.Carneiro AAO, Fernandes JP, Zago MA, Covas DT, Angulo IL, Baffa O. An alternating current superconductor susceptometric system to evaluate liver iron overload. Review of Scientific Instruments. 2003 Jun;74(6):3098–3103. [Google Scholar]
- 37.Bonkovsky HL, Jawaid Q, Tortorelli K, et al. Non-alcoholic steatohepatitis and iron: increased prevalence of mutations of the HFE gene in non-alcoholic steatohepatitis. J Hepatol. 1999 Sep;31(3):421–429. doi: 10.1016/s0168-8278(99)80032-4. [DOI] [PubMed] [Google Scholar]
- 38.Bonkovsky HL, Rubin RB, Cable EE, Davidoff A, Rijcken TH, Stark DD. Hepatic iron concentration: noninvasive estimation by means of MR imaging techniques. Radiology. 1999 Jul;212(1):227–234. doi: 10.1148/radiology.212.1.r99jl35227. [DOI] [PubMed] [Google Scholar]
- 39.George DK, Goldwurm S, MacDonald GA, et al. Increased hepatic iron concentration in nonalcoholic steatohepatitis is associated with increased fibrosis. Gastroenterology. 1998 Feb;114(2):311–318. doi: 10.1016/s0016-5085(98)70482-2. [DOI] [PubMed] [Google Scholar]
- 40.Moirand R, Mortaji AM, Loreal O, Paillard F, Brissot P, Deugnier Y. A new syndrome of liver iron overload with normal transferrin saturation. Lancet. 1997 Jan 11;349(9045):95–97. doi: 10.1016/S0140-6736(96)06034-5. [DOI] [PubMed] [Google Scholar]
- 41.Harrison SA, Bacon BR. Relation of hemochromatosis with hepatocellular carcinoma: epidemiology, natural history, pathophysiology, screening, treatment, and prevention. Med Clin North Am. 2005 Mar;89(2):391–409. doi: 10.1016/j.mcna.2004.08.005. [DOI] [PubMed] [Google Scholar]
- 42.Powell EE, Ali A, Clouston AD, et al. Steatosis is a cofactor in liver injury in hemochromatosis. Gastroenterology. 2005 Dec;129(6):1937–1943. doi: 10.1053/j.gastro.2005.09.015. [DOI] [PubMed] [Google Scholar]
- 43.Rowe JW, Wands JR, Mezey E, et al. Familial hemochromatosis: characteristics of the precirrhotic stage in a large kindred. Medicine (Baltimore) 1977 May;56(3):197–211. [PubMed] [Google Scholar]
- 44.Barry M, Sherlock S. Measurement of liver-iron concentration in needle-biopsy specimens. Lancet. 1971 Jan 16;1(7690):100–103. doi: 10.1016/s0140-6736(71)90838-5. [DOI] [PubMed] [Google Scholar]
- 45.Bravo A, Sheth S, Chopra S. Liver Biopsy. New England Journal of Medicine. 2001;344(7):495–500. doi: 10.1056/NEJM200102153440706. [DOI] [PubMed] [Google Scholar]
- 46.Rofsky NM, Fleishaker H. CT and MRI of diffuse liver disease. Semin Ultrasound CT MR. 1995 Feb;16(1):16–33. doi: 10.1016/0887-2171(95)90012-8. [DOI] [PubMed] [Google Scholar]
- 47.Mortele KJ, Ros PR. Imaging of diffuse liver disease. Semin Liver Dis. 2001 May;21(2):195–212. doi: 10.1055/s-2001-15496. [DOI] [PubMed] [Google Scholar]
- 48.Guyader D, Gandon Y, Deugnier Y, et al. Evaluation of computed tomography in the assessment of liver iron overload. A study of 46 cases of idiopathic hemochromatosis. Gastroenterology. 1989 Sep;97(3):737–743. doi: 10.1016/0016-5085(89)90646-x. [DOI] [PubMed] [Google Scholar]
- 49.Wang ZJ, Haselgrove JC, Martin MB, et al. Evaluation of iron overload by single voxel MRS measurement of liver T2. J Magn Reson Imaging. 2002 Apr;15(4):395–400. doi: 10.1002/jmri.10080. [DOI] [PubMed] [Google Scholar]
- 50.Bauman JH, Hoffman RW. Magnetic susceptibility meter for in vivo estimation of hepatic iron stores. IEEE Trans Biomed Eng. 1967 Oct;14(4):239–243. doi: 10.1109/tbme.1967.4502511. [DOI] [PubMed] [Google Scholar]
- 51.Bauman JH, Harris JW. Estimation of hepatic iron stores by vivo measurement of magnetic susceptibility. J Lab Clin Med. 1967 Aug;70(2):246–257. [PubMed] [Google Scholar]
- 52.Carneiro AAO, Baffa O, Fernandes JP, Zago MA. Theoretical evaluation of the susceptometric measurement of iron in human liver by four different susceptometers. Physiological Measurement. 2002 Nov;23(4):683–693. doi: 10.1088/0967-3334/23/4/308. [DOI] [PubMed] [Google Scholar]
- 53.Stark DD, Bass NM, Moss AA, et al. Nuclear magnetic resonance imaging of experimentally induced liver disease. Radiology. 1983 Sep;148(3):743–751. doi: 10.1148/radiology.148.3.6192464. [DOI] [PubMed] [Google Scholar]
- 54.Stark DD, Goldberg HI, Moss AA, Bass NM. Chronic liver disease: evaluation by magnetic resonance. Radiology. 1984 Jan;150(1):149–151. doi: 10.1148/radiology.150.1.6689754. [DOI] [PubMed] [Google Scholar]
- 55.Maris TG, Papakonstantinou O, Chatzimanoli V, et al. Myocardial and liver iron status using a fast T*2 quantitative MRI (T*2qMRI) technique. Magn Reson Med. 2007 Apr;57(4):742–753. doi: 10.1002/mrm.21204. [DOI] [PubMed] [Google Scholar]
- 56.Brooks RA, Moiny F, Gillis P. On T2-shortening by weakly magnetized particles: the chemical exchange model. Magn Reson Med. 2001 Jun;45(6):1014–1020. doi: 10.1002/mrm.1135. [DOI] [PubMed] [Google Scholar]
- 57.Brewer CJ, Coates TD, Wood JC. Spleen R2 and R2* in iron-overloaded patients with sickle cell disease and thalassemia major. J Magn Reson Imaging. 2009 Feb;29(2):357–364. doi: 10.1002/jmri.21666. [DOI] [PMC free article] [PubMed] [Google Scholar]
- 58.Siegelman ES, Mitchell DG, Rubin R, et al. Parenchymal versus reticuloendothelial iron overload in the liver: distinction with MR imaging. Radiology. 1991 May;179(2):361–366. doi: 10.1148/radiology.179.2.2014275. [DOI] [PubMed] [Google Scholar]
- 59.St Pierre TG, Clark PR, Chua-Anusorn W. Measurement and mapping of liver iron concentrations using magnetic resonance imaging. Ann N Y Acad Sci. 2005;1054:379–385. doi: 10.1196/annals.1345.046. [DOI] [PubMed] [Google Scholar]
- 60.Clark PR, Chua-anusorn W, St Pierre TG. Bi-exponential proton transverse relaxation rate (R2) image analysis using RF field intensity-weighted spin density projection: potential for R2 measurement of iron-loaded liver. Magn Reson Imaging. 2003 Jun;21(5):519–530. doi: 10.1016/s0730-725x(03)00080-8. [DOI] [PubMed] [Google Scholar]
- 61.Ernst O, Sergent G, Bonvarlet P, CanvaDelcambre V, Paris JC, LHermine C. Hepatic iron overload: Diagnosis and quantification with MR imaging. American Journal of Roentgenology. 1997 May;168(5):1205–1208. doi: 10.2214/ajr.168.5.9129412. [DOI] [PubMed] [Google Scholar]
- 62.Gandon Y, Olivie D, Guyader D, et al. Non-invasive assessment of hepatic iron stores by MRI. Lancet. 2004 Jan 31;363(9406):357–362. doi: 10.1016/S0140-6736(04)15436-6. [DOI] [PubMed] [Google Scholar]
- 63.Gandon Y, Guyader D, Heautot JF, et al. Hemochromatosis: diagnosis and quantification of liver iron with gradient-echo MR imaging. Radiology. 1994 Nov;193(2):533–538. doi: 10.1148/radiology.193.2.7972774. [DOI] [PubMed] [Google Scholar]
- 64.Kreeftenberg HG, Mooyaart EL, Huizenga JR, Sluiter WJ, Kreeftenberg HG. Quantification of liver iron concentration with magnetic resonance imaging by combining T1-, T2-weighted spin echo sequences and a gradient echo sequence. Netherlands Journal of Medicine. 2000 Apr;56(4):133–137. doi: 10.1016/s0300-2977(00)00003-6. [DOI] [PubMed] [Google Scholar]
- 65.Olthof AW, Sijens PE, Kreeftenberg HG, Kappert P, van der Jagt EJ, Oudkerk M. Non-invasive liver iron concentration measurement by MRI: Comparison of two validated protocols. European Journal of Radiology. 2009;71(1):116–121. doi: 10.1016/j.ejrad.2008.02.008. [DOI] [PubMed] [Google Scholar]
- 66.Rose C, Vandevenne P, Bourgeois E, Cambier N, Ernst O. Liver iron content assessment by routine and simple magnetic resonance imaging procedure in highly transfused patients. European Journal of Haematology. 2006 Aug;77(2):145–149. doi: 10.1111/j.0902-4441.2006.t01-1-EJH2571.x. [DOI] [PubMed] [Google Scholar]
- 67.Virtanen JM, Komu ME, Parkkola RK. Quantitative liver iron measurement by magnetic resonance imaging: in vitro and in vivo assessment of the liver to muscle signal intensity and the R2* methods. Magn Reson Imaging. 2008 Oct;26(8):1175–1182. doi: 10.1016/j.mri.2008.01.028. [DOI] [PubMed] [Google Scholar]
- 68.Alexopoulou E, Stripeli F, Baras P, et al. R2 relaxometry with MRI for the quantification of tissue iron overload in beta-thalassemic patients. Journal of Magnetic Resonance Imaging. 2006 Feb;23(2):163–170. doi: 10.1002/jmri.20489. [DOI] [PubMed] [Google Scholar]
- 69.Bulte JW, Miller GF, Vymazal J, Brooks RA, Frank JA. Hepatic hemosiderosis in non-human primates: quantification of liver iron using different field strengths. Magn Reson Med. 1997 Apr;37(4):530–536. doi: 10.1002/mrm.1910370409. [DOI] [PubMed] [Google Scholar]
- 70.Wood JC, Ghugre N. Magnetic resonance imaging assessment of excess iron in thalassemia, sickle cell disease and other iron overload diseases. Hemoglobin. 2008;32(1-2):85–96. doi: 10.1080/03630260701699912. [DOI] [PMC free article] [PubMed] [Google Scholar]
- 71.Gossuin Y, Muller RN, Gillis P, Bartel L. Relaxivities of human liver and spleen ferritin. Magnetic Resonance Imaging. 2005;23(10):1001–1004. doi: 10.1016/j.mri.2005.10.009. [DOI] [PubMed] [Google Scholar]
- 72.Chandarana H, Lim RP, Jensen JH, et al. Hepatic iron deposition in patients with liver disease: preliminary experience with breath-hold multiecho T2*-weighted sequence. AJR Am J Roentgenol. 2009 Nov;193(5):1261–1267. doi: 10.2214/AJR.08.1996. [DOI] [PubMed] [Google Scholar]
- 73.McCarville MB, Hillenbrand CM, Loeffler RB, et al. Comparison of whole liver and small region-of-interest measurements of MRI liver R2* in children with iron overload. Pediatr Radiol. 2010 Mar 24; doi: 10.1007/s00247-010-1596-8. epub. [DOI] [PMC free article] [PubMed] [Google Scholar]
- 74.Schwenzer NF, Machann J, Haap MM, et al. T2* relaxometry in liver, pancreas, and spleen in a healthy cohort of one hundred twenty-nine subjects-correlation with age, gender, and serum ferritin. Invest Radiol. 2008 Dec;43(12):854–860. doi: 10.1097/RLI.0b013e3181862413. [DOI] [PubMed] [Google Scholar]
- 75.Westwood M, Anderson LJ, Firmin DN, et al. A single breath-hold multiecho T2*cardiovascular magnetic resonance technique for diagnosis of myocardial iron overload. Journal of Magnetic Resonance Imaging. 2003 Jul;18(1):33–39. doi: 10.1002/jmri.10332. [DOI] [PubMed] [Google Scholar]
- 76.St Pierre TG, Clark PR, Chua-anusorn W, et al. Noninvasive measurement and imaging of liver iron concentrations using proton magnetic resonance. Blood. 2005 Jan 15;105(2):855–861. doi: 10.1182/blood-2004-01-0177. [DOI] [PubMed] [Google Scholar]
- 77.Wood JC, Enriquez C, Ghugre N, et al. MRI R2 and R2* mapping accurately estimates hepatic iron concentration in transfusion-dependent thalassemia and sickle cell disease patients. Blood. 2005 Aug 15;106(4):1460–1465. doi: 10.1182/blood-2004-10-3982. [DOI] [PMC free article] [PubMed] [Google Scholar]
- 78.Voskaridou E, Douskou M, Terpos E, et al. Magnetic resonance imaging in the evaluation of iron overload in patients with beta thalassaemia and sickle cell disease. Br J Haematol. 2004 Sep;126(5):736–742. doi: 10.1111/j.1365-2141.2004.05104.x. [DOI] [PubMed] [Google Scholar]
- 79.Wright GA, Hu BS, Macovski A. 1991 I.I. Rabi Award. Estimating oxygen saturation of blood in vivo with MR imaging at 1.5 T. J Magn Reson Imaging. 1991 May-Jun;1(3):275–283. doi: 10.1002/jmri.1880010303. [DOI] [PubMed] [Google Scholar]
- 80.Hankins JS, McCarville MB, Loeffler RB, et al. R2* magnetic resonance imaging of the liver in patients with iron overload. Blood. 2009 May 14;113(20):4853–4855. doi: 10.1182/blood-2008-12-191643. [DOI] [PMC free article] [PubMed] [Google Scholar]
- 81.He T, Gatehouse PD, Kirk P, Mohiaddin RH, Pennell DJ, Firmin DN. Myocardial T-2* measurement in iron-overloaded thalassemia: An ex vivo study to investigate optimal methods of quantification. Magnetic Resonance in Medicine. 2008 Aug;60(2):350–356. doi: 10.1002/mrm.21625. [DOI] [PubMed] [Google Scholar]
- 82.Christoforidis A, Perifanis V, Spanos G, et al. MRI assessment of liver iron content in thalassamic patients with three different protocols: comparisons and correlations. European Journal of Haematology. 2009;82(5):388–392. doi: 10.1111/j.1600-0609.2009.01223.x. [DOI] [PubMed] [Google Scholar]
- 83.Chappell KE, Patel N, Gatehouse PD, et al. Magnetic resonance imaging of the liver with ultrashort TE (UTE) pulse sequences. J Magn Reson Imaging. 2003 Dec;18(6):709–713. doi: 10.1002/jmri.10423. [DOI] [PubMed] [Google Scholar]
- 84.Yablonskiy DA, Haacke EM. Theory of Nmr Signal Behavior in Magnetically Inhomogeneous Tissues - the Static Dephasing Regime. Magnetic Resonance in Medicine. 1994 Dec;32(6):749–763. doi: 10.1002/mrm.1910320610. [DOI] [PubMed] [Google Scholar]
- 85.Wood JC, Aguilar M, Otto-Duessel M, Nick H, Nelson MD, Moats R. Influence of iron chelation on R1 and R2 calibration curves in gerbil liver and heart. Magn Reson Med. 2008 Jul;60(1):82–89. doi: 10.1002/mrm.21660. [DOI] [PMC free article] [PubMed] [Google Scholar]
- 86.Gutierrez L, Lazaro FJ, Abadia AR, et al. Bioinorganic transformations of liver iron deposits observed by tissue magnetic characterisation in a rat model. Journal of Inorganic Biochemistry. 2006;100(11):1790–1799. doi: 10.1016/j.jinorgbio.2006.06.010. [DOI] [PubMed] [Google Scholar]
- 87.Muller RN, Gillis P, Moiny F, Roch A. Transverse relaxivity of particulate MRI contrast media: from theories to experiments. Magn Reson Med. 1991 Dec;22(2):178–182. doi: 10.1002/mrm.1910220203. discussion 195-176. [DOI] [PubMed] [Google Scholar]
- 88.Taouli B, Chouli M, Martin AJ, Qayyum A, Coakley FV, Vilgrain V. Chronic hepatitis: role of diffusion-weighted imaging and diffusion tensor imaging for the diagnosis of liver fibrosis and inflammation. J Magn Reson Imaging. 2008 Jul;28(1):89–95. doi: 10.1002/jmri.21227. [DOI] [PubMed] [Google Scholar]
- 89.Taouli B, Tolia AJ, Losada M, et al. Diffusion-weighted MRI for quantification of liver fibrosis: preliminary experience. AJR Am J Roentgenol. 2007 Oct;189(4):799–806. doi: 10.2214/AJR.07.2086. [DOI] [PubMed] [Google Scholar]
- 90.Yu H, McKenzie CA, Shimakawa A, et al. Multiecho reconstruction for simultaneous water-fat decomposition and T2* estimation. J Magn Reson Imaging. 2007 Oct;26(4):1153–1161. doi: 10.1002/jmri.21090. [DOI] [PubMed] [Google Scholar]
- 91.Bydder M, Yokoo T, Hamilton G, et al. Relaxation effects in the quantification of fat using gradient echo imaging. Magn Reson Imaging. 2008 Apr;26(3):347–359. doi: 10.1016/j.mri.2007.08.012. [DOI] [PMC free article] [PubMed] [Google Scholar]
- 92.Yu H, Shimakawa A, McKenzie CA, Brodsky E, Brittain JH, Reeder SB. Multiecho water-fat separation and simultaneous R2* estimation with multifrequency fat spectrum modeling. Magn Reson Med. 2008 Nov;60(5):1122–1134. doi: 10.1002/mrm.21737. [DOI] [PMC free article] [PubMed] [Google Scholar]
- 93.O'Regan DP, Callaghan MF, Wylezinska-Arridge M, et al. Liver fat content and T2*: simultaneous measurement by using breath-hold multiecho MR imaging at 3.0 T--feasibility. Radiology. 2008 May;247(2):550–557. doi: 10.1148/radiol.2472070880. [DOI] [PubMed] [Google Scholar]
- 94.Chebrolu VV, Hines CD, Yu H, et al. Independent estimation of T*2 for water and fat for improved accuracy of fat quantification. Magn Reson Med. 2010 Apr;63(4):849–857. doi: 10.1002/mrm.22300. [DOI] [PMC free article] [PubMed] [Google Scholar]
- 95.Personal communication, Jason Polzin, PhD, GE Healthcare. In: Polzin J, ed2009