Abstract
Heterogeneity correction algorithms can have a large impact on the dose distributions of stereotactic body radiation therapy (SBRT) for lung tumors. Treatment plans of 20 patients who underwent SBRT for lung tumors with the prescribed dose of 48 Gy in four fractions at the isocenter were reviewed retrospectively and recalculated with different heterogeneity correction algorithms: the pencil beam convolution algorithm with a Batho power-law correction (BPL) in Eclipse, the radiological path length algorithm (RPL), and the X-ray Voxel Monte Carlo algorithm (XVMC) in iPlan. The doses at the periphery (minimum dose and D95) of the planning target volume (PTV) were compared using the same monitor units among the three heterogeneity correction algorithms, and the monitor units were compared between two methods of dose prescription, that is, an isocenter dose prescription (IC prescription) and dose–volume based prescription (D95 prescription). Mean values of the dose at the periphery of the PTV were significantly lower with XVMC than with BPL using the same monitor units (P < 0.001). In addition, under IC prescription using BPL, RPL and XVMC, the ratios of mean values of monitor units were 1, 0.959 and 0.986, respectively. Under D95 prescription, they were 1, 0.937 and 1.088, respectively. These observations indicated that the application of XVMC under D95 prescription results in an increase in the actually delivered dose by 8.8% on average compared with the application of BPL. The appropriateness of switching heterogeneity correction algorithms and dose prescription methods should be carefully validated from a clinical viewpoint.
Keywords: heterogeneity correction, lung tumor, Monte Carlo dose calculation, stereotactic body radiation therapy
INTRODUCTION
Stereotactic body radiation therapy (SBRT) for early-stage lung cancer is a non-invasive cancer treatment with an innovative radiotherapeutic technique. Various recent studies of SBRT have yielded promising clinical results [1–11]. In addition, some prospective multi-institutional trials of SBRT have recently reported high control rates and favorable outcomes for inoperable or elderly patients. In the Radiation Therapy Oncology Group (RTOG) 0236 trial, a phase II trial of SBRT for medically inoperable stage I/II non-small cell lung cancer (NSCLC), the 3-year local control and overall survival rates were 98 and 56%, respectively [12]. In the Japan Clinical Oncology Group (JCOG) 0403 phase II trial, those rates were 86 and 76%, respectively, in operable patients with stage IA NSCLC [13].
The influences of heterogeneity correction on dose distribution have been reported for SBRT of lung cancer [14–18]. These studies compared treatment plans using pencil-beam algorithms with those recalculated with convolution superposition-type algorithms or the Monte Carlo algorithm, and all indicated that the dose to the periphery of the planning target volume (PTV) was overestimated when using pencil-beam algorithms depending on the field size and the energy of the beam. On the other hand, the methods of dose prescription have changed from prescription at the isocenter point of the treatment plan (IC prescription) to prescription dose at the periphery of the PTV, for example, the dose to cover 95% of the PTV (D95 prescription). In the USA, 60 Gy in 20-Gy fractions is delivered to 95% of the PTV (D95 prescription) in the RTOG 0236 protocol [19]. In Japan, D95 prescription was adopted in the JCOG 0702 phase I trial instead of the IC prescription adopted in the previous JCOG 0403 phase II trial.
SBRT for lung cancer has been implemented in our institute since 1998, and this method has been applied to more than 400 patients with lung cancer to date. We initially performed SBRT with a linear accelerator (Clinac 2300C/D; Varian Medical Systems, Inc., Palo Alto, CA) and treatment planning was performed with CadPlan and Eclipse (Varian Medical Systems, Inc.) using the pencil beam convolution algorithm with a Batho power-law correction (BPL). Since the middle of 2009, however, we have switched to the Novalis system (BrainLAB AG, Feldkirchen, Germany) and the iPlan 4.0 treatment planning system (BrainLAB AG) with an X-ray Voxel Monte Carlo (XVMC) dose calculation engine.
To make the best use of previous experience and ensure consistent SBRT treatments using the new heterogeneity algorithm, it is important to verify the difference in dose distributions between BPL and XVMC. The present study was performed in order to evaluate the impacts of different heterogeneity correction algorithms on dose distributions of SBRT for lung tumors. We compared the dose–volume statistics for the target and normal lung tissue among different heterogeneity correction algorithms using the same monitor units. In addition, we also compared the results of two types of dose prescription: IC prescription and D95 prescription.
MATERIALS AND METHODS
The data of the computed tomography (CT) scans of 20 patients with solitary primary lung tumors who underwent SBRT between March 2006 and February 2007 were used, and the treatment plans were recalculated with different dose calculation algorithms in the present study. Nine and 11 patients had tumors in the left and right lung, respectively. Treatment planning included delineation of target and normal lung volumes, arrangement of irradiation beams and dose calculation using treatment planning systems.
Delineation of target and normal lung
Internal target volumes (ITVs) were delineated on the long-scan-time CT images with a rotation time of 4 s, including the motion blurs around lung tumors. PTVs were created by adding 5-mm margins to the ITVs in all directions. Normal lung volumes were defined as the bilateral pulmonary parenchyma outside the PTV [20]. Characteristics of the targets are shown in Table 1.
Table 1.
Characteristics of the targets
| Location [pts] | left lobe | 9 | |
| right lobe | 11 | ||
| Volume [ml] | ITVs | 14.6 ± 11.1 | (3.7–46.5) |
| PTVs | 34.5 ± 19.6 | (13.5–88.0) | |
| Shortest distance between IC and chest wall [cm] | 1.7 ± 1.0 | (0.7–4.6) | |
| Shortest distance between PTV margin and chest wall [cm] | 0.0 ± 0.8 | (–0.6 to 2.3) | |
Data are shown as means ± SD (range). SD = standard deviation, ITV = internal target volume, PTV = planning target volume.
Beam arrangement and dose calculation for clinical plans
We used Novalis (BrainLAB AG) for the present study, and arranged six static beams (two coplanar beams and four non-coplanar beams) with 6-MV X-rays. A 5-mm margin was uniformly added to the PTVs to create the shape of the MLC for each port [20]. The prescription dose was 48 Gy in four fractions (12 Gy per fraction) at the isocenter. We calculated the dose distributions with Eclipse 7.3 (Varian Medical Systems, Inc.) using beam data obtained from the Novalis system prepared for Eclipse. BPL was used for heterogeneity correction.
Recalculation of dose distribution
These treatment plans were recalculated with iPlan 4.0 (BrainLAB AG) using a fully commissioned radiological path length algorithm (RPL) and XVMC for heterogeneity correction using the same monitor units as the plans described above with Eclipse.
In all plans with the three different heterogeneity correction algorithms, all factors except the heterogeneity correction algorithm, such as target volumes (ITV and PTV) and beam arrangements (e.g. coordinates of the isocenter and gantry and couch angles) were identical. Dose distributions were calculated using RPL and XVMC under the same monitor units as in the plan in which 48 Gy was prescribed at the isocenter using a fully commissioned BPL. In addition, the plans were recalculated using two dose prescription methods: 48 Gy at the isocenter (IC prescription) and 48 Gy to cover 95% of the PTV (D95 prescription).
The calculation grid size was 2.5 mm in all plans. In XVMC, the dose calculation was performed with a spatial resolution of 2.5 mm and mean variance of 2%.
Plan analyses
The following dose–volume statistics were calculated with all types of heterogeneity correction:
isocenter dose;
mean, minimum dose (lowest point dose), and D95 for the ITVs;
mean, minimum, maximum dose (highest point dose), D95, and homogeneity index (HI) for the PTVs;
mean dose, the percentage of the volume receiving more than 20 Gy (V20); and the percentage of the volume receiving more than 5 Gy (V5) for the normal lung.
Thereafter, in both dose prescription methods, dose–volumetric data were compared using analysis of variance (ANOVA) among the three algorithms of heterogeneity correction. All pairwise comparisons were performed using Tukey's test. Statistical significance was defined as P < 0.05.
RESULTS
The mean volumes of the ITVs and PTVs in the 20 patients were 14.6 ml (range 3.7–46.5 ml) and 34.5 ml (range 13.5–88.0 ml), respectively.
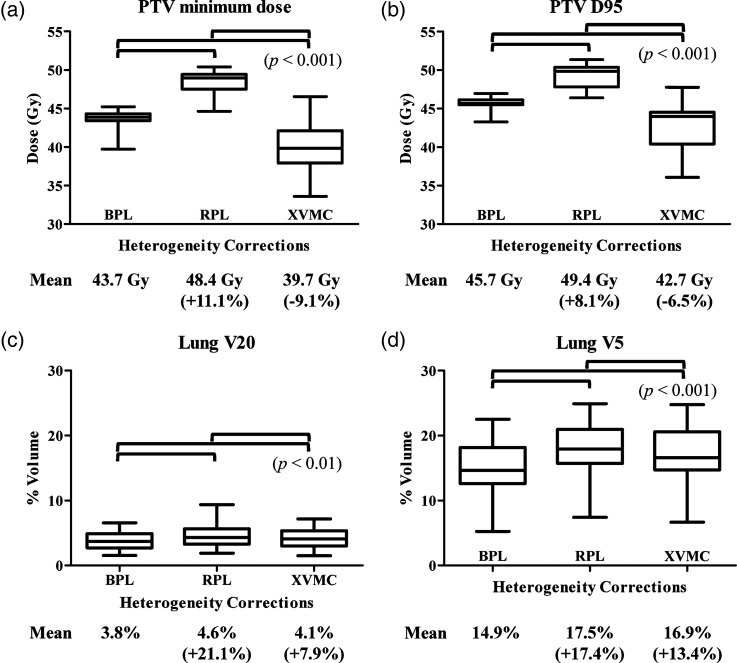
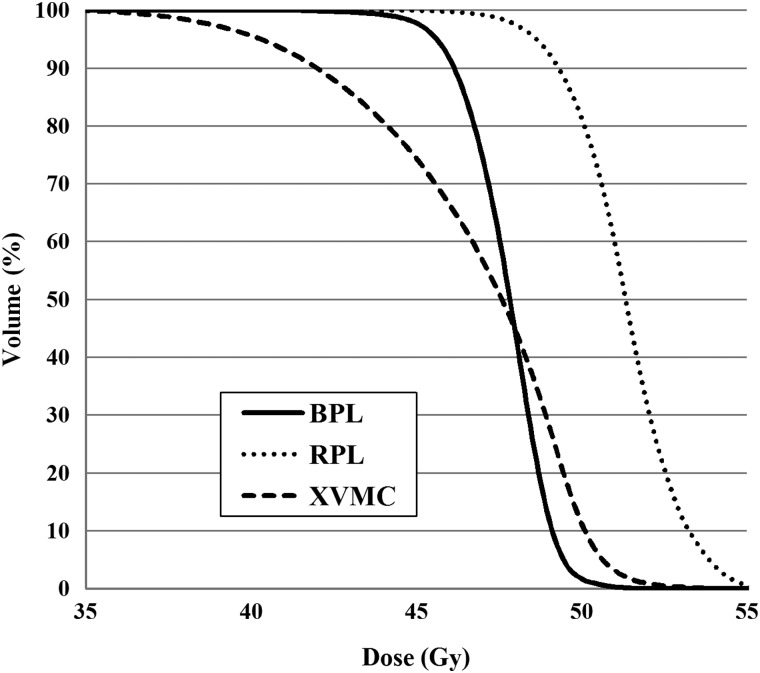
Table 2 shows the dose–volumetric parameters of the PTVs when 48 Gy was prescribed at the isocenter, and Table 3 shows the corresponding parameters when the plans were recalculated with RPL and XVMC using the same monitor units as in BPL. The mean values of the minimum dose and D95 for the PTV were 43.7 Gy and 45.7 Gy, respectively, when 48 Gy was prescribed at the isocenter using BPL (Table 2). When the doses were recalculated with RPL and XVMC under the same monitor units as in BPL, these values were 48.4 Gy and 49.4 Gy for RPL, and 39.7 Gy and 42.7 Gy for XVMC, respectively (Table 3). Box plots of these values are shown in Fig 1a and b. The doses at the periphery of the PTV (minimum dose and D95) were significantly lower with XVMC than with BPL under the same monitor units (P < 0.001). The mean value of the minimum dose of the PTV was 9.1% lower with XVMC than with BPL, and that of D95 was 6.5% lower with XVMC than with BPL. Averaged dose–volume histograms of the PTV using BPL, RPL and XVMC indicated a reduction of the dose at the periphery of the PTV with XVMC compared with BPL and RPL (Fig. 2).
Table 2.
Dose-volumetric parameters when 48 Gy was prescribed at the isocenter
| Group | IC dose [Gy] | ITV |
PTV |
Lungs |
|||||||
|---|---|---|---|---|---|---|---|---|---|---|---|
| D95 [Gy] | Min dose [Gy] | Max dose [Gy] | D95 [Gy] | Min dose [Gy] | Max dose [Gy] | HI | Mean dose [Gy] | V20 [%] | V5 [%] | ||
| BPL | 48.0 ± 0.0 | 46.8 ± 0.8 | 46.0 ± 1.1 | 49.8 ± 0.7 | 45.7 ± 0.8 | 43.7 ± 1.2 | 49.9 ± 0.8 | 1.1 ± 0.0 | 2.9 ± 0.8 | 3.8 ± 1.4 | 14.9 ±4.5 |
| RPL | 48.0 ± 0.0 | 47.8 ± 0.9 | 47.3 ± 1.2 | 51.2 ± 1.2 | 47.4 ± 1.0 | 46.4 ± 1.3 | 51.4 ± 1.4 | 1.1 ± 0.1 | 3.3 ± 0.8 | 4.2 ± 1.6 | 17.2 ± 4.6 |
| XVMC | 48.0 ± 0.0 | 44.5 ± 2.4 | 42.7 ± 2.8 | 50.1 ± 1.1 | 42.1 ± 3.2 | 39.2 ± 3.2 | 50.4 ± 1.1 | 1.3 ± 0.1 | 3.3 ± 0.8 | 4.0 ± 1.5 | 16.8 ± 4.7 |
Data are shown as means ± SD. IC = isocenter, ITV = internal target volume, PTV = planning target volume, D95 = the dose to cover 95% of the volume, Min dose = Minimum dose, Max dose = Maximum dose, HI = homogeneity index, V20Gy and V5Gy = the percentage of the volume receiving more than 20 Gy and 5 Gy, BPL = the Batho power-law correction, RPL = the radiological path length algorithm, XVMC = the X-ray Voxel Monte Carlo algorithm.
Table 3.
Dose-volumetric parameters when plans were recalculated with RPL and XVMC using the same monitor units of BPL in Table 2
| Group | IC dose [Gy] | ITV |
PTV |
Lungs |
|||||||
|---|---|---|---|---|---|---|---|---|---|---|---|
| D95 [Gy] | Min dose [Gy] | Max dose [Gy] | D95[Gy] | Min dose [Gy] | Max dose [Gy] | HI | Mean dose [Gy] | V20 [%] | V5 [%] | ||
| RPL | 50.1 ± 0.8 | 49.8 ± 1.2 | 49.3 ± 1.5 | 53.4 ± 1.3 | 49.4 ± 1.4 | 48.4 ± 1.7 | 53.6 ± 1.4 | 1.1 ± 0.1 | 3.5 ± 0.8 | 4.6 ± 1.8 | 17.5 ±4.7 |
| XVMC | 48.7 ± 0.6 | 45.1 ± 2.4 | 43.3 ± 2.9 | 50.7 ± 1.1 | 42.7 ± 3.3 | 39.7 ±3.3 | 51.1 ±1.2 | 1.3 ± 0.1 | 3.3 ± 0.8 | 4.1 ± 1.5 | 16.9 ± 4.8 |
Data are shown as means ± SD. IC = isocenter, ITV = internal target volume, PTV = planning target volume, D95 = the dose to cover 95% of the volume, Min dose = Minimum dose, Max dose = Maximum dose, HI = homogeneity index, V20Gy and V5Gy = the percentage of the volume receiving more than 20 Gy and 5 Gy, BPL = the Batho power-law correction, RPL = the radiological path length algorithm, XVMC = the X-ray Voxel Monte Carlo algorithm.
Fig. 1.
Box plots of the minimum dose (a), D95 (b) for the PTV and V20 (c), V5 (d) for the normal lung, when 48 Gy was prescribed at the isocenter using BPL.
With RPL and XVMC, the doses were recalculated under the same monitor units as in BPL. The figures in parentheses indicate the percentages of the mean doses in RPL and XVMC relative to those in BPL. BPL = the Batho power-law correction, RPL = the radiological path length algorithm, XVMC = the X-ray Voxel Monte Carlo algorithm.
Fig. 2.
Averaged dose–volume histogram of the PTV using BPL, RPL and XVMC in all plans. BPL = the Batho power-law correction, RPL = the radiological path length algorithm, XVMC = the X-ray Voxel Monte Carlo algorithm.
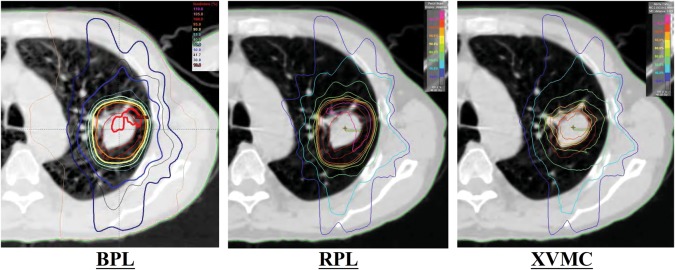
Figure 3 shows an example of dose distribution in which the difference in minimum dose for the PTV was the largest between BPL and XVMC.
Fig. 3.
An example of dose distribution in which the difference of the minimum dose for the PTV was the largest between BPL and XVMC. A dose of 48 Gy was prescribed at the isocenter using BPL, and the doses were recalculated with RPL and XVMC under the same monitor units as in BPL. BPL = the Batho power-law correction, RPL = the radiological path length algorithm, XVMC = the X-ray Voxel Monte Carlo algorithm.
The mean normal lung doses of V20 and V5 were 3.8% and 14.9%, respectively, when 48 Gy was prescribed at the isocenter using BPL (Table 2). After recalculation with RPL and XVMC using the same monitor units as in BPL, these values were 4.6% and 17.5% for RPL, and 4.1% and 16.9% for XVMC, respectively (Table 3). Figure 1c and d show box plots of these values. The mean V20 and V5 of the normal lungs were significantly higher with XVMC than with BPL (P < 0.01), but the absolute differences were small.
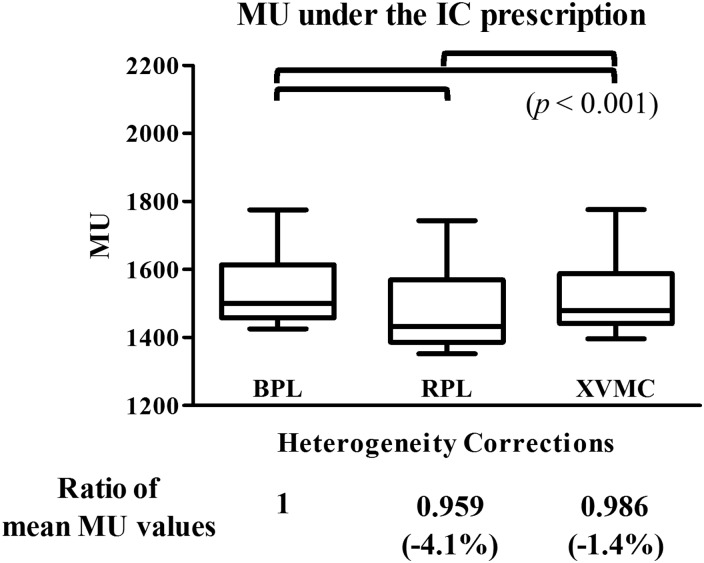
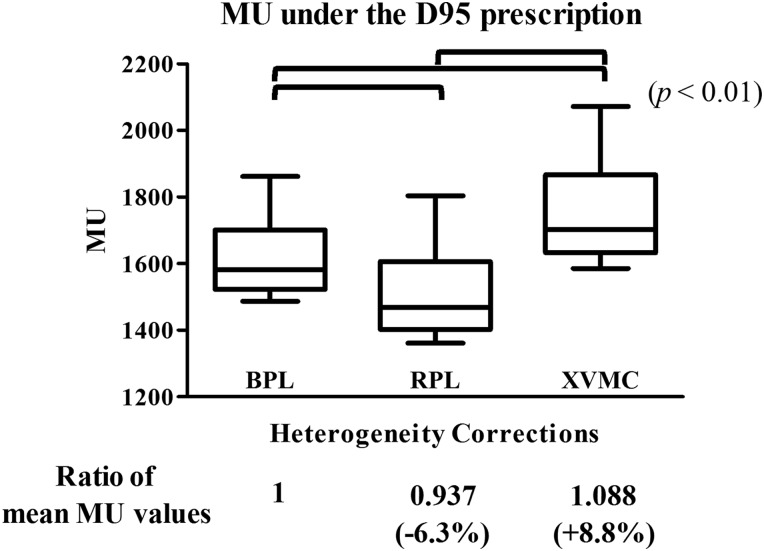
The plans were also recalculated with two methods of dose prescription, that is, IC prescription and D95 prescription. The values of monitor units under these dose prescription methods are shown in Table 4. The ratios of the mean monitor unit values were 1, 0.959 and 0.986 with IC prescription using BPL, RPL and XVMC, respectively; the differences were significant (P < 0.001) (Fig. 4). Under D95 prescription using BPL, RPL and XVMC, the ratios of mean monitor unit values were 1, 0.937 and 1.088, respectively; these were also significantly different from each other (P < 0.01) (Fig. 5). These outcomes indicated that the application of XVMC under D95 prescription results in an increase of the actually delivered dose by an average of 8.8% (range –3.2–26.7%) compared with BPL. These results also indicated that in comparison with RPL, the application of XVMC under D95 prescription resulted in an increase in actually delivered dose by an average of 16.1% (range 0.5–36.6%).
Table 4.
Values of monitor units using two methods of dose prescription; IC prescription and D95 prescription
| Group | 48 Gy @ IC | 48 Gy @ PTV D95 |
|---|---|---|
| BPL | 1540 ± 111 | 1619 ± 124 |
| RPL | 1477 ± 120 | 1517 ± 139 |
| XVMC | 1519 ± 112 | 1761 ± 156 |
Data are shown as means ± SD. IC = isocenter, PTV = planning target volume, D95 = the dose to cover 95% of the volume, BPL = the Batho power-law correction, RPL = the radiological path length algorithm, XVMC = the X-ray Voxel Monte Carlo algorithm.
Fig. 4.
Box plots of absolute values of monitor units using BPL, RPL, XVMC when 48 Gy was prescribed at the isocenter. The figures in parentheses indicate the percentages of the mean values of monitor units in RPL and XVMC to those in BPL. BPL = the Batho power-law correction, RPL = the radiological path length algorithm, XVMC = the X-ray Voxel Monte Carlo algorithm, MU = monitor units.
Fig. 5.
Box plots of absolute values of monitor units using BPL, RPL, XVMC when 48 Gy was prescribed to cover 95% of the PTV.
The symbols are the same as in Fig. 4.
DISCUSSION
At present, a wide variety of prescription doses and heterogeneity corrections are used for dose calculation of lung SBRT among different institutions. For example, the prescription dose is 48 Gy in 12-Gy fractions at the isocenter in the JCOG 0403 protocol [20], while 60 Gy in 20-Gy per fraction with D95 prescription is used in the RTOG 0236 protocol [19]. With respect to heterogeneity correction, a wide variety of algorithms equivalent to the Clarkson algorithm are allowed in the JCOG 0403 protocol [21], while no heterogeneity correction is applied in the RTOG 0236 protocol [19]. Therefore, comparing the actual delivered doses among these trials is difficult. The progression of treatment planning systems in dose calculation and heterogeneity correction has made clear differences among the plans using a variety of heterogeneity correction algorithms, and it has therefore been difficult to compare outcomes among different institutions. Prior to the start of the JCOG 0403 phase II trial, it had already been reported that the dose calculation algorithm was the most significant factor responsible for inter-institutional variations in planning for SBRT for lung cancer [20].
The lungs are histologically heterogeneous organs composed of large amounts of air and soft tissues. Therefore, different heterogeneity corrections can cause changes in the dose distributions in treatment planning systems. In the report of Task Group No. 65 of the Radiation Therapy Committee of the American Association of Physicists in Medicine, inhomogeneity correction algorithms were categorized according to the level of anatomy sampled for scatter calculation and the inclusion or exclusion of electron transport [22]. BPL performs heterogeneity correction using the tissue/air ratio or tissue maximum ratio [22, 23]. In addition, this type of correction does not take into account changes in lateral electron transport [24]. In convolution–superposition types of correction, changes in the lateral transport are modeled in an approximate manner, and several studies have shown these algorithms to be more accurate for heterogeneous dose calculations [14, 21, 25].
With the Monte Carlo algorithm, virtually every photon history is calculated for a sufficiently large number of primary photons and, consequently, the calculated dose is expected to be the most accurate. Krieger and Sauer concluded that the pencil-beam algorithm was not suitable to predict the dose in heterogeneous volumes with sufficient accuracy and showed that the Monte Carlo algorithm were very close to the measurements, even in low-density volumes [26]. Thus, the Monte Carlo algorithm can be seen as the current gold standard for heterogeneous dose calculation [25, 26]. In particular, with the XVMC algorithm, several variance reduction techniques are used to improve the speed of the calculation, and the XVMC algorithm has also been validated by comparison with measurements [27, 28]. Dobler et al. demonstrated the accuracy of the XVMC algorithm relative to the pencil-beam and collapsed-cone algorithms in radiation therapy of small lung lesions [29]. The Monte Carlo algorithm predicted the dose the most accurately with maximal differences of –8% and –3%, respectively, compared with the film, while the pencil-beam algorithm overestimated the dose by up to 15% compared with the measurements.
The results of the present study indicate that different heterogeneity corrections have a marked impact on the dose distributions around the targets. Comparing the plans with the same monitor units, D95 and the minimum dose were significantly lower in XVMC than in BPL (Tables 2 and 3), which supports the results of previous studies [14–18]. In addition, we also confirmed that under IC prescription, the differences in monitor units between BPL and XVMC were small (–1.4%). Thus, under IC prescription, treatment plans made with XVMC are consistent with those made with BPL. Therefore, we switched the heterogeneity correction algorithm from BPL to XVMC under IC prescription. On the other hand, careful attention should be paid when applying XVMC using D95 prescription because it can result in escalating the delivered dose by approximately 9% on an average.
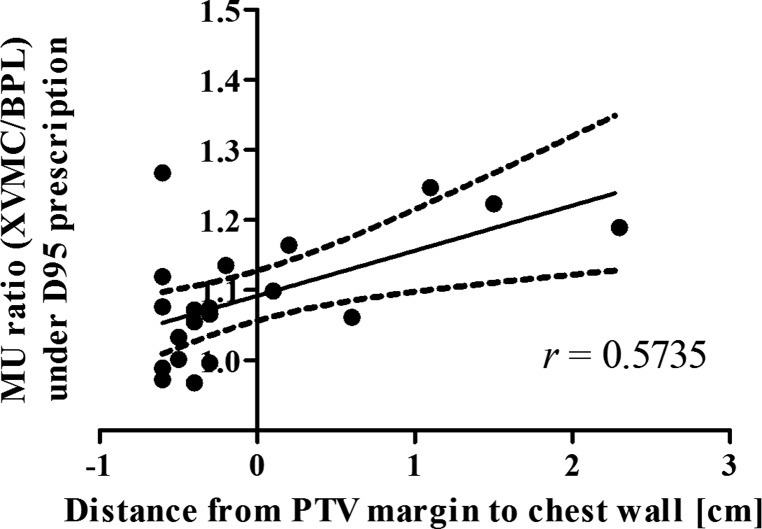
To determine in what case the application of XVMC to heterogeneity correction under D95 prescription markedly increases the monitor unit values in comparison with BPL, we examined the correlations between the rates of increase in monitor units (XVMC/BPL) and various parameters, such as the volume of the ITV, the volume of the PTV, the diameter of the ITV, the CT value of the ITV and the distance from the PTV to the chest wall. With the exception of the distance from the PTV to the chest wall, none of the parameters showed significant correlations with the rates of increase in monitor units. Figure 6 shows that the distances from the PTV margin to the chest wall on the CT slice including the IC were significantly correlated with the rates of increase in monitor units (Pearson's correlation coefficient r = 0.5735, n = 20, P = 0.0082). These observations indicated that the dose at the periphery of the PTV is likely to decrease because the PTV margin is covered with air in the PTVs distant from the chest wall, while in the PTVs near the chest wall, the dose at the periphery of the PTV is less likely to decrease because the PTV margin is close to or overlaps with soft tissues.
Fig. 6.
Linear regression between the MU ratio (XVMC/BPL) under D95 prescription and the distance from chest wall to the PTV margin (Pearson's correlation coefficient r = 0.5735, n = 20, P = 0.0082).
Negative values of the distance mean overlapped distances between the PTV margin and the chest wall. BPL = the Batho power-law correction, RPL = the radiological path length algorithm, XVMC = the X-ray Voxel Monte Carlo algorithm, MU = monitor units.
The present study had the limitation that recalculated plans were not optimal. We did not reoptimize the plans to eliminate the impacts of other factors on dose distributions and evaluate the differences in the heterogeneity correction algorithms themselves. Therefore, the dose distributions may still be improved following reoptimization of the beam angle weights or couch angles.
CONCLUSIONS
Heterogeneity corrections can have significant impacts on dose distributions of SBRT for lung tumors. Care should be taken regarding the impacts of different heterogeneity correction algorithms and dose prescription methods.
In particular, the application of XVMC under D95 prescription can cause an increase in potential dose by an average of approximately 9%. Therefore, the appropriateness of switching the heterogeneity correction algorithm from BPL or RPL to XVMC under D95 prescription should be validated carefully from a clinical viewpoint.
FUNDING
This work was partially supported by Grants-in-Aid for Scientific Research from the Ministry of Education, Culture, Sports, Science and Technology, Japan (20229009).
CONFLICT OF INTEREST
The iPlan Monte Carlo dose calculation engine applied in the present study was provided by BrainLAB AG (Feldkirchen, Germany) under a collaborative research agreement between Kyoto University and BrainLAB AG.
REFERENCES
- 1.Ricardi U, Filippi AR, Guarneri A, et al. Stereotactic body radiation therapy for early stage non-small cell lung cancer: results of a prospective trial. Lung Cancer. 2010;68(1):72–7. doi: 10.1016/j.lungcan.2009.05.007. [DOI] [PubMed] [Google Scholar]
- 2.Palma D, Visser O, Lagerwaard FJ, et al. Impact of introducing stereotactic lung radiotherapy for elderly patients with stage I non-small-cell lung cancer: a population-based time-trend analysis. J Clin Oncol. 2010;28:5153–9. doi: 10.1200/JCO.2010.30.0731. [DOI] [PubMed] [Google Scholar]
- 3.Onishi H, Shirato H, Nagata Y, et al. Hypofractionated stereotactic radiotherapy (HypoFXSRT) for stage I non-small cell lung cancer: updated results of 257 patients in a Japanese multi-institutional study. J Thorac Oncol. 2007;2(7 Suppl 3):S94–100. doi: 10.1097/JTO.0b013e318074de34. [DOI] [PubMed] [Google Scholar]
- 4.Timmerman R, Papiez L, McGarry R, et al. Extracranial stereotactic radioablation: results of a phase I study in medically inoperable stage I non-small cell lung cancer. Chest. 2003;124:1946–55. doi: 10.1378/chest.124.5.1946. [DOI] [PubMed] [Google Scholar]
- 5.Lagerwaard FJ, Haasbeek CJ, Smit EF, et al. Outcomes of risk-adapted fractionated stereotactic radiotherapy for stage I non-small-cell lung cancer. Int J Radiat Oncol Biol Phys. 2008;70:685–92. doi: 10.1016/j.ijrobp.2007.10.053. [DOI] [PubMed] [Google Scholar]
- 6.Nagata Y, Takayama K, Matsuo Y, et al. Clinical outcomes of a phase I/II study of 48 Gy of stereotactic body radiotherapy in 4 fractions for primary lung cancer using a stereotactic body frame. Int J Radiat Oncol Biol Phys. 2005;63:1427–31. doi: 10.1016/j.ijrobp.2005.05.034. [DOI] [PubMed] [Google Scholar]
- 7.Uematsu M, Shioda A, Suda A, et al. Computed tomography-guided frameless stereotactic radiotherapy for stage I non-small cell lung cancer: a 5-year experience. Int J Radiat Oncol Biol Phys. 2001;51:666–70. doi: 10.1016/s0360-3016(01)01703-5. [DOI] [PubMed] [Google Scholar]
- 8.Onimaru R, Shirato H, Shimizu S, et al. Tolerance of organs at risk in small-volume, hypofractionated, image-guided radiotherapy for primary and metastatic lung cancers. Int J Radiat Oncol Biol Phys. 2003;56:126–35. doi: 10.1016/s0360-3016(03)00095-6. [DOI] [PubMed] [Google Scholar]
- 9.Hof H, Muenter M, Oetzel D, et al. Stereotactic single-dose radiotherapy (radiosurgery) of early stage nonsmall-cell lung cancer NSCLC) Cancer. 2007;110:148–55. doi: 10.1002/cncr.22763. [DOI] [PubMed] [Google Scholar]
- 10.Wulf J, Haedinger U, Oppitz U, et al. Stereotactic radiotherapy for primary lung cancer and pulmonary metastases: a noninvasive treatment approach in medically inoperable patients. Int J Radiat Oncol Biol Phys. 2004;60:186–96. doi: 10.1016/j.ijrobp.2004.02.060. [DOI] [PubMed] [Google Scholar]
- 11.Zimmermann FB, Geinitz H, Schill S, et al. Stereotactic hypofractionated radiotherapy in stage I (T1-2 N0 M0) non-small-cell lung cancer (NSCLC) Acta Oncol. 2006;45:796–801. doi: 10.1080/02841860600913210. [DOI] [PubMed] [Google Scholar]
- 12.Timmerman R, Paulus R, Galvin J, et al. Stereotactic body radiation therapy for inoperable early stage lung cancer. JAMA. 2010;303:1070–6. doi: 10.1001/jama.2010.261. [DOI] [PMC free article] [PubMed] [Google Scholar]
- 13.Nagata Y, Hiraoka M, Shibata T, et al. A phase II trial of stereotactic body radiation therapy for operable T1N0M0 non-small cell lung cancer: Japan Clinical Oncology Group (JCOG0403) Int J Radiat Oncol Biol Phys. 2010;78:S27–8. doi: 10.1016/j.ijrobp.2015.07.2278. [DOI] [PubMed] [Google Scholar]
- 14.Lax I, Panettieri V, Wennberg B, et al. Dose distributions in SBRT of lung tumors: comparison between two different treatment planning algorithms and Monte-Carlo simulation including breathing motions. Acta Oncol. 2006;45:978–88. doi: 10.1080/02841860600900050. [DOI] [PubMed] [Google Scholar]
- 15.Ding GX, Duggan DM, Lu B, et al. Impact of inhomogeneity corrections on dose coverage in the treatment of lung cancer using stereotactic body radiation therapy. Med Phys. 2007;34:2985–94. doi: 10.1118/1.2745923. [DOI] [PubMed] [Google Scholar]
- 16.Traberg Hansen A, Petersen JB, Hoyer M, et al. Comparison of two dose calculation methods applied to extracranial stereotactic radiotherapy treatment planning. Radiother Oncol. 2005;77:96–8. doi: 10.1016/j.radonc.2005.04.018. [DOI] [PubMed] [Google Scholar]
- 17.Panettieri V, Wennberg B, Gagliardi G, et al. SBRT of lung tumours: Monte Carlo simulation with PENELOPE of dose distributions including respiratory motion and comparison with different treatment planning systems. Phys Med Biol. 2007;52:4265–81. doi: 10.1088/0031-9155/52/14/016. [DOI] [PubMed] [Google Scholar]
- 18.Haedinger U, Krieger T, Flentje M, et al. Influence of calculation model on dose distribution in stereotactic radiotherapy for pulmonary targets. Int J Radiat Oncol Biol Phys. 2005;61:239–49. doi: 10.1016/j.ijrobp.2004.03.028. [DOI] [PubMed] [Google Scholar]
- 19.Timmerman R, Michalski J, Galvin J, et al. 2006 RTOG 0236: A phase II trial of stereotactic body radiation therapy (SBRT) in the treatment of patients with medically inoperable stage I/II non-small cell lung cancer. RTOG. 2006 Available from: http://www.rtog.org/ClinicalTrials/ProtocolTable/StudyDetails.aspx?action=openFile&FileID=4612. (3 July 2012, date last accessed) [Google Scholar]
- 20.Matsuo Y, Takayama K, Nagata Y, et al. Interinstitutional variations in planning for stereotactic body radiation therapy for lung cancer. Int J Radiat Oncol Biol Phys. 2007;68:416–25. doi: 10.1016/j.ijrobp.2006.12.012. [DOI] [PubMed] [Google Scholar]
- 21.Nishio T, Kunieda E, Shirato H, et al. Dosimetric verification in participating institutions in a stereotactic body radiotherapy trial for stage I non-small cell lung cancer: Japan clinical oncology group trial (JCOG0403) Phys Med Biol. 2006;51:5409–17. doi: 10.1088/0031-9155/51/21/002. [DOI] [PubMed] [Google Scholar]
- 22.Task Group No. Tissue Inhomogeneity Corrections for Megavoltage Photon Beams. Madison, WI: Medical Physics Publishing; 2004. 65, the Radiation Therapy Committee of the American Association of Physicists in Medicine. [Google Scholar]
- 23.Wong JW, Purdy JA. On methods of inhomogeneity corrections for photon transport. Med Phys. 1990;17:807–14. doi: 10.1118/1.596555. [DOI] [PubMed] [Google Scholar]
- 24.Knoos T, Wieslander E, Cozzi L, et al. Comparison of dose calculation algorithms for treatment planning in external photon beam therapy for clinical situations. Phys Med Biol. 2006;51:5785–807. doi: 10.1088/0031-9155/51/22/005. [DOI] [PubMed] [Google Scholar]
- 25.Schuring D, Hurkmans CW. Developing and evaluating stereotactic lung RT trials: what we should know about the influence of inhomogeneity corrections on dose. Radiat Oncol. 2008;3:21. doi: 10.1186/1748-717X-3-21. [DOI] [PMC free article] [PubMed] [Google Scholar]
- 26.Krieger T, Sauer OA. Monte Carlo- versus pencil-beam-/collapsed-cone-dose calculation in a heterogeneous multi-layer phantom. Phys Med Biol. 2005;50:859–68. doi: 10.1088/0031-9155/50/5/010. [DOI] [PubMed] [Google Scholar]
- 27.Fippel M. Fast Monte Carlo dose calculation for photon beams based on the VMC electron algorithm. Med Phys. 1999;26:1466–75. doi: 10.1118/1.598676. [DOI] [PubMed] [Google Scholar]
- 28.Fippel M, Kawrakow I, Friedrich K. Electron beam dose calculations with the VMC algorithm and the verification data of the NCI working group. Phys Med Biol. 1997;42:501–20. doi: 10.1088/0031-9155/42/3/005. [DOI] [PubMed] [Google Scholar]
- 29.Dobler B, Walter C, Knopf A, et al. Optimization of extracranial stereotactic radiation therapy of small lung lesions using accurate dose calculation algorithms. Radiat Oncol. 2006;1:45. doi: 10.1186/1748-717X-1-45. [DOI] [PMC free article] [PubMed] [Google Scholar]


