Abstract
We investigated an electronic portal image device (EPID)-based method to see whether it provides effective and accurate relative dose measurement at abutment leaves in terms of positional errors of the multi-leaf collimator (MLC) leaf position. A Siemens ONCOR machine was used. For the garden fence test, a rectangular field (0.2 × 20 cm) was sequentially irradiated 11 times at 2-cm intervals. Deviations from planned leaf positions were calculated. For the nongap test, relative doses at the MLC abutment region were evaluated by sequential irradiation of a rectangular field (2 × 20 cm) 10 times with a MLC separation of 2 cm without a leaf gap. The integral signal in a region of interest was set to position A (between leaves) and B (neighbor of A). A pixel value at position B was used as background and the pixel ratio (A/B × 100) was calculated. Both tests were performed at four gantry angles (0, 90, 180 and 270°) four times over 1 month. For the nongap test the difference in pixel ratio between the first and last period was calculated. Regarding results, average deviations from planned positions with the garden fence test were within 0.5 mm at all gantry angles, and at gantry angles of 90 and 270° tended to decrease gradually over the month. For the nongap test, pixel ratio tended to increase gradually in all leaves, leading to a decrease in relative doses at abutment regions. This phenomenon was affected by both gravity arising from the gantry angle, and the hardware-associated contraction of field size with this type of machine.
Keywords: MLC, IMRT, EPID, garden fence test, calibration
INTRODUCTION
Because treatment fields consist of multiple segments generated from optimization procedures and the multi-leaf collimator (MLC) leaf positions control steep dose gradient, quality assurance for MLC plays an important role in treatment planning and dose delivery in intensity-modulated radiation therapy (IMRT). Variation between the planned and actual leaf positions can lead to incorrect dose distributions [1–3]. For segmental MLC, the over- or underlapping of abutting field segments leads to hot or cold spots in the abutment regions of approximately 13% mm−1 and 17% mm−1 of the average dose for the abutting segments for 6- and 18-MV photon beams, respectively [4].
Several methods for quality assurance (QA) of MLC position in IMRT have been proposed. The garden fence test is traditionally used to verify the actual versus planned MLC stop position [5, 6]. Although this method is generally performed with radiographic film, it is time-consuming and analysis is costly. The same tests have recently been performed with electronic portal image devices (EPIDs) [7–10]. These devices facilitate the confirmation of leaf position accuracy with high precision, namely 0.4 mm per pixel of physical detector size, and at any gantry angle, even 0°. The garden fence test is accordingly performed at our department with an EPID at gantry angles of 0, 90, 180, and 270° to account for leaf positional error due to the gravity effect. Since therapeutic procedures regularly require the delivery of MLC-defined fields to patients at a wide range of gantry angles, the accuracy of these QC checks at other gantry angles has been investigated. In addition to the gravity effect, leaf positional error also affects the dose error between abutment leaves, particularly in step-and-shoot IMRT [1]. Treatment planning systems do not account for leaf positional error, however, and it is therefore not accounted for in dose calculation. Rather, dose delivery is critically dependent on the performance of MLC leaf position accuracy and on ensuring that the planned dose distribution can be achieved safely and accurately.
The publications of AAPM task groups (TG) 50 and 142 provide an excellent review of MLC design and QA issues [11, 12]. The TG-50 report provides a test for determining errors in leaf positioning that is extremely sensitive to relative position errors, but does not quantify the amount of error, identify the offending leaf or demonstrate the absolute position of the leaves with respect to the central axis of the collimator. In contrast, the TG-142 report does provide a test for leaf positioning error, but does not allow checking of the dose error generated by an incorrect leaf stop positioning error for neighboring leaves. Moreover, the relative dose effect at the MLC abutment region has not been quantitatively investigated, to our knowledge at least.
Here, we used an EPID to develop a technique to efficiently measure the absolute position of each MLC leaf from the central axis of the collimator over the range of leaf positions utilized in IMRT. Additionally, we developed a simple QA procedure to determine as the relative pixel intensity error between abutment leaves produced by an incorrect leaf position compared with the expected leaf position, and then used this technique to determine a suitable period for MLC leaf calibration using the long-term reproducibility of leaf position. The reproducibility of leaf positions was tested in the long term as a function of gantry angle.
MATERIALS AND METHODS
MLC and EPID
Exposures were done with a Siemens ONCOR Impression plus linear accelerator (Siemens Medical Systems, Concord, CA, USA). This system utilizes an MLC designed with 82 pairs of leaves, consisting of two leaves that project to 0.5-cm width at 100 cm from the source (leaves #1 and #41) and 39 leaves which project to a 1-cm width (leaves #2–40). The double-focused MLC design was initially described by Das et al. [13]. The leaves can travel across the beam central axis for a maximum distance of 10 cm.
A Siemens OPTIVUE 1000 EPID (Siemens Medical Systems) was used to acquire portal images. The detector has 1024 × 1024 pixels with a size of 0.40 mm. Overlaying the sensitive layer of the EPID is a 3-mm copper plate to remove low energy photons, followed by a scintillating layer of phosphor to transform incoming x-rays to visible photons, and then a pixel array implanted on the amorphous-Si panel to capture visible photons and convert them to electric charges. The charge signals are then read out and digitized by a 16-bit analogue to digital converter. Source to imager distance (SID) is changeable between 110 cm and 160 cm.
Repeated extension/retraction of the EPID
Use of the EPID to measure leaf position was tested by examining the repeatability of EPID extension and retraction. The cross wire plate, which is named XRETIC and matched to the mechanical isocenter, was inserted into a shadow tray, and exposure of one monitor unit with a field size of 20 cm × 20 cm was done 10 times, as shown in Fig. 1. Coincidence of mechanical isocenter and radiation beam center is <1 mm.
Fig. 1.
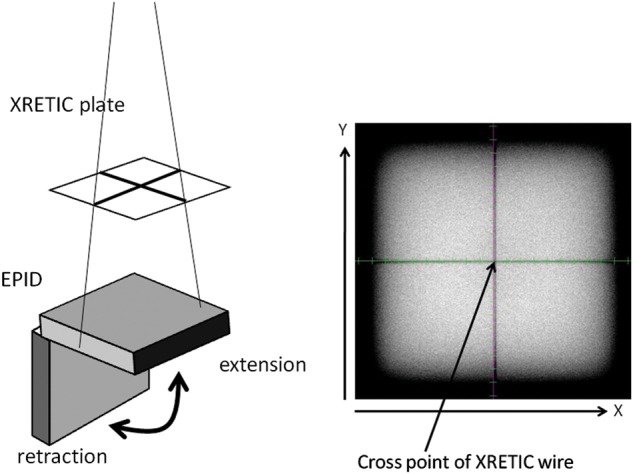
Retraction and extension of the EPID. Axes in color show the physical center (row: 511, column: 511) of the portal image.
At every exposure the EPID was set without a change in field size; that is, each exposure was done without motion of the MLC. An SID of 150 cm and gantry angle of 0° were used. Because the physical center of the EPID (row: 511, column: 511) was not exactly matched to the cross point of the XRETIC plate, the shift data, which consist of the rotational and translational offset, were measured by matching the physical center of the EPID with the projected image of the XRETIC wire. Minimum resolution for this analysis was 1 pixel and 0.1°, which was the same as the minimum resolution of collimator rotation for translation and rotation, respectively. Calculated pixel size was 0.27 mm at the isocenter given that the physical pixel size at a SID of 150 cm was 0.40 mm.
Determination of EPID sag correction factors
When measurement is done at various gantry angles, EPID sag should be identified to allow for correction of both rotational offset and translational offset so that the center of the XRETIC plate can be matched with the isocenter. After the XRETIC plate was inserted into a shadow tray, exposure with a 20 cm × 20 cm X-ray field by one monitor unit was done at the gantry angles of 0, 90, 180 and 270°. The shift value needed for translation and rotation was then calculated manually.
Garden fence test
A slit field of 2 mm width by 20 cm height was made and the field center was swept from –10 cm to +10 cm at intervals of 2 cm; that is, irradiation with one monitor unit was continuously done 11 times with no extension or retraction of the EPID. This irradiation protocol was known as the garden fence test, which detects the MLC leaf position errors [14–18]. All portal images were taken at an SID of 150 cm using a 6-MV photon beam. A composite image was made as the sum of the 11 images with our in-house software. Figure 2 shows the composite image and coordinate system for this study. This is an inverted image, which means the irradiated region is white and the unirradiated region is black.
Fig. 2.
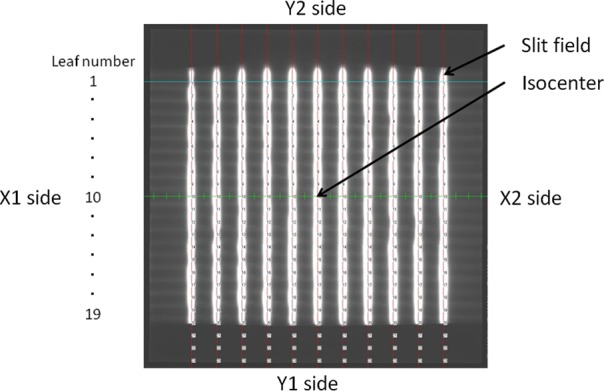
Composite image for the garden fence test. Slit field in white is an irradiated region, and region in black is not irradiated.
The coordinate system was defined as follows: the origin was set to the isocenter after EPID sag correction. The X-axis was directed from the X1 jaw-MLC to the X2 jaw-MLC and the Y-axis from the Y2 jaw to the Y1 jaw. For each MLC leaf the center position of the field width that the distance between 50% of the peak intensity for the pixel intensity profile (i.e. the center of full-width half-maximum) was calculated. This used the MLC edge detection method proposed by Bayouth et al.. [19]. Although the visual inspection is basically performed in the garden fence test with or without MLC leaf position error, in this study the MLC leaf position error was defined as the distance between the calculated position and the nominal planned position. A positive deviation value meant that the error was toward the X2 side from the planned position, whereas a negative value meant that the error was toward the X1 side. These procedures were done at the four gantry angles of 0, 90, 180 and 270°.
Nongap test
A rectangular field of 2 cm × 20 cm was produced and sequentially irradiated onto the EPID at a 2-cm interval without a leaf gap 10 times, as if a 20 cm × 20 cm open field was created. As with the garden fence test, all EPID images were taken at an SID of 150 cm using a 6-MV photon beam. For each image, 10 images were acquired in our in-house software and a composite image was created. Figure 3 showed a sample image at gantry angle 0° for this test.
Fig. 3.
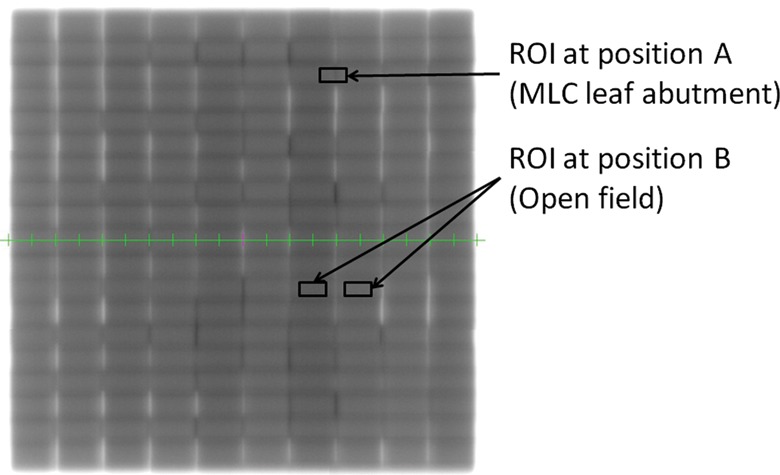
Composite image for the nongap test. The size of the region of interest (ROI) was a 10-mm width and 5-mm height.
The integral signal in the small region of interest (ROI), which had a size of 10 mm × 5 mm, was set to position A (MLC leaf abutment: gap) and B (its neighbor: open field). Once the ROI was set in the left up corner on the composite image for either position A or B, the other ROIs were automatically defined based on the interval of leaf abutment gap of 2 cm and lead width of 1 cm. For each region, mean pixel value within the ROI was calculated at region A and B. For region B, the mean pixel value from the two regions was calculated and used, namely both sides of the gap region, in order to remove radiation field variations. A pixel value at position B was used as background intensity. The EPID image pixel values at position A were divided by an open field image at position B to reduce potential variations in beam output and symmetry and minimize the effect of local EPID response variations. The ratio of pixel value (A/B × 100) at each MLC abutment position was used to determine underdose, overdose and flattened dose regions, with a pixel ratio at position A of >100 assumed to indicate underdosing in the leaf gap, and of <100 to indicate overdosing. The multiplied factor of 100 was used to gain the value of pixel ratio. These procedures were done at gantry angles of 0, 90, 180 and 270°, respectively.
Reproducibility of the garden fence test and nongap test
To determine the change in leaf position and the relative dose intensity effect by the deviation of each leaf position, the garden fence test and nongap test were performed for a period of 1 month without MLC leaf calibration. Each test was performed four times over this period. EPID sag error was also measured and used for correction of the tests to evaluate the beam axis coordinate. With regard to the nongap test, the change in pixel ratio at each MLC abutment position (X = –8, –6, –4, –2, 0, 2, 4, 6, 8) was measured. The pixel ratio of the last data point at each abutment position was compared with that of the first data point using the paired t-test. Statistical significance was set at the 5% level.
RESULTS
Repeated extension/retraction of the EPID
Measurements were obtained by recording the pixel coordinates of the cross point of the XRETIC plate on the EPID image. Figure 1 shows the pixel coordinates of the cross point in both the X and Y axes. Standard deviations of the shift correction data over 10 measurements in the X and Y axes were 0.00 mm and 0.00 mm, respectively with the measurement uncertainty of 0.14 mm because the minimum pixel resolution for analysis was 0.27 mm. Maximum deviation was 0.00 mm in both axes despite repeated extension and retraction of the EPID without change in MLC leaf position. These findings indicate that the EPID could be used for the analysis of MLC leaf position.
Determination of EPID sag correction factors
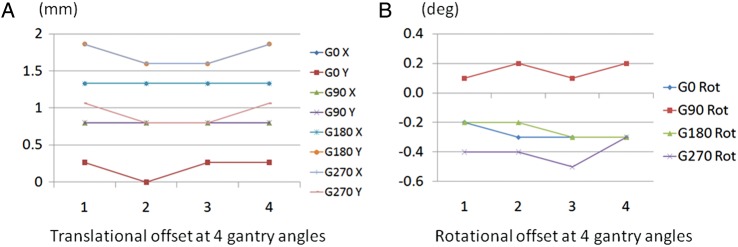
Measurements were obtained by recording the pixel coordinates of the cross point of the XRETIC plate on the EPID image at four gantry angles. Figure 4 shows the change in translational offset in millimeters and rotational offset in degrees for the cross wire at the four gantry angles on weekly measurement for 1 month.
Fig. 4.
Translational offset and rotational offset for four gantry angles over 1 month.
The X axis is measured in weeks. (A) Translational offset in mm for both X and Y axes at four gantry angles of 0, 90, 180 and 270°. (B) Rotational offset in degree at four gantry angles of 0, 90, 180 and 270°.
At gantry 0, standard deviations (SDs) of the translational offset for the X and Y axes and rotational offset were 0.00 mm, 0.13 mm and 0.05°, respectively. Although there was no deviation for the translational offset at a gantry angle of 90°, 0.06° of SD was seen for rotational offset. At gantry angle 180°, SDs of translational offset were 0.00 mm and 0.15 mm for the X and Y axes, and 0.06° for rotational offset, respectively. At gantry angle 270°, the SDs of translational offset were 0.15 mm and 0.15 mm for the X and Y axes, and 0.08° for rotational offset, respectively. Although some translational and rotational shift was seen at all gantry angles, these were relatively small correction factors, and when the garden fence test and nongap test were performed, these factors were used to evaluate the results relative to the beam central axis. EPID sag was reproducible over time and the correction factors would require only occasional checking.
Garden fence test
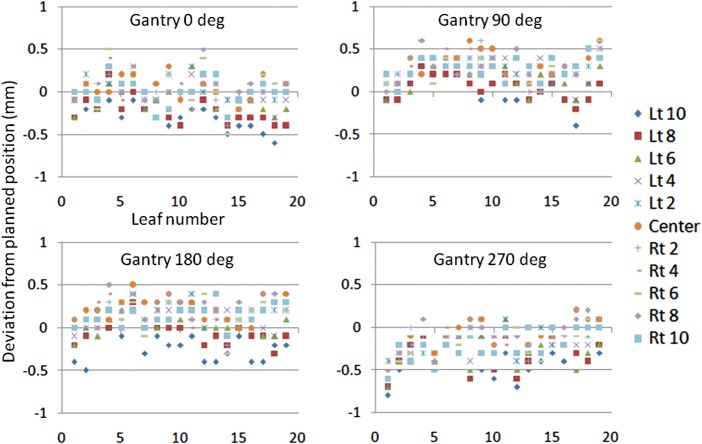
Figure 5 shows deviations from the planned position at all four gantry angles when the center of the slit field ranged from –10 cm to 10 cm with an interval of 2 cm.
Fig. 5.
Deviation from the planned position for four gantry angles at each MLC slit location. The X axis shows leaf number. The Y axis shows deviation from planned position in millimeters. Each symbol shows the MLC abutment location (left 10 cm to right 10 cm with 2-cm interval).
For each angle, deviation from the planned nominal MLC location was <1 mm, and thus within the tolerance level of SMLC advocated by Palta and others [20]. Average deviations calculated from each error of all leaf positions for the gantry angles of 0, 90, 180 and 270° were –0.04 mm, 0.24 mm, 0.11 mm and –0.20 mm, respectively. Compared with gantry angle 0° (–0.04 mm), orientation with gantry angle 90° (0.24 mm) and 270° (–0.20 mm) was toward the positive for gantry angle 90° and toward the negative for gantry angle 270°. Although these results were identical with the gravity effect (P < 0.01), the amount of deviation at gantry angle 180° was markedly small (0.11 mm), the difference was nevertheless significant (P < 0.01). Figure 6 shows average deviations from the planned MLC location for every gantry angle on testing once per week over 1 month. The data at the initial week was the same as that of Fig. 5. Although results for the second and subsequent measurements showed significant differences in the degree of deviation except for the data of the second week at gantry angles 180 and 270°, these were not based on the influence of gravity; that is, it was not possible to identify patterns of gravity-induced movement of MLC leaf positions toward the floor.
Fig. 6.
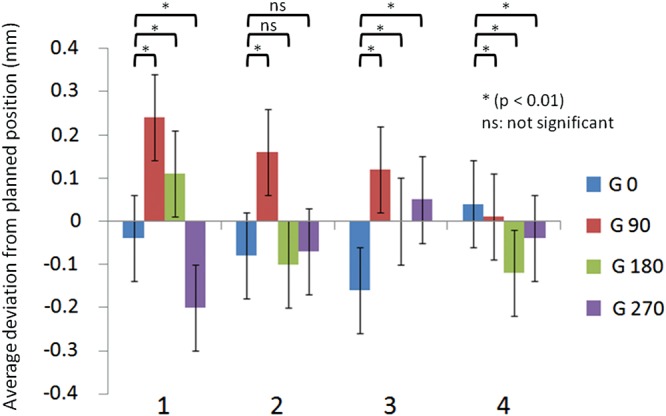
Average deviations from the planned position at four gantry angles over 1 month.
The X axis is measured in weeks. The Y axis shows average deviation from planned position in mm at four gantry angles of 0, 90, 180, 270°. Error bars present one standard deviation. Paired t-test comparisons between gantry angle 0° and the other angles are shown (P < 0.01: significant difference, ns: not significant).
Using the same combination of MLC and EPID for analysis as in the present study, Parent et al. [21] reported that measurements at gantry angles of 90 and 270° showed no significant effect of gravity. For gantry angle 90°, a tendency for the error from a planned MLC location to gradually decrease was evident from the first to the fourth time. A similar tendency was seen for gantry angle 270°. We suspect that this tendency was due to the narrowing orientation of the MLC along the central beam axis over this month.
Nongap test
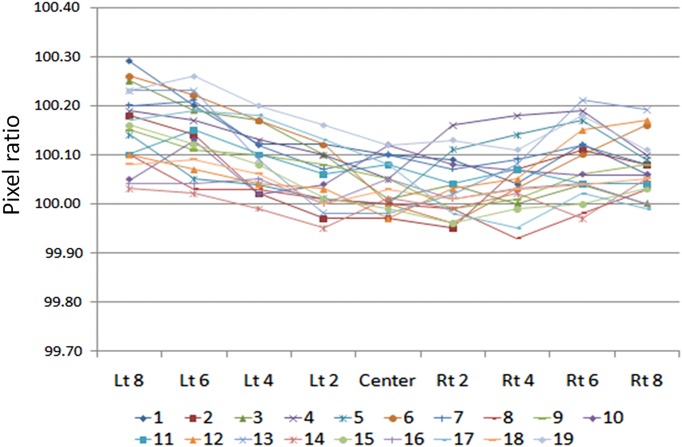
Figure 3 shows the nongap image of measurement at a gantry angle of 0°. The MLC abutment region in white was relatively underdosed compared with the open field area, whereas this region in black was relatively overdosed. There were many underdose regions compared with overdose regions. Figure 7 shows the quantitative data of the pixel ratio at each MLC abutment position. The value of pixel ratio at each MLC abutment region was not the same, most of them were over 100.
Fig. 7.
Pixel ratio at the MLC abutment position for 19 leaves. The X axis shows the MLC abutment position (left 8 cm to right 8 cm with 2-cm interval) and the Y axis shows the pixel ratio at the MLC abutment position for 19 leaves.
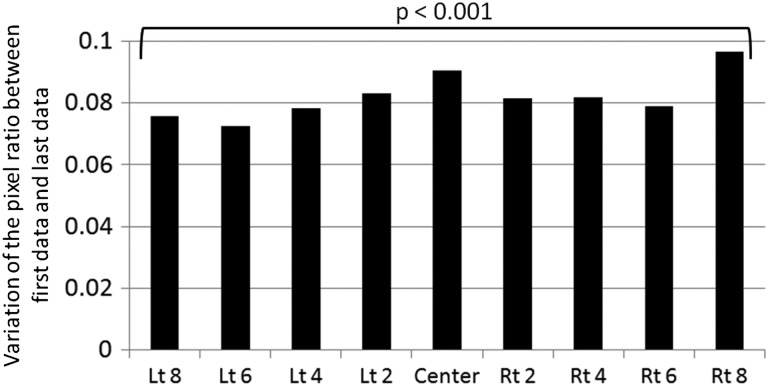
Figure 8 shows a comparison of pixel ratio between the first and last data points measured over 1 month at gantry angle 0°. Average pixel ratio was calculated for all leaves at every MLC abutment position (Lt 8–Center–Rt 8). In every MLC abutment position, the variation in pixel ratio was absolutely positive (the change in color white) and showed an intentional trend toward a decrease in dose (P < 0.001). Figure 9 shows a change of average pixel ratio measured at every MLC abutment position at gantry angle 0° over 1 month. The value of which was gradually changed to positive for every MLC abutment position. It is thought that the MLC locations became progressively narrowed in the orientation of the central beam axis over 1 month, resulting in underdosing in the overlapping parts of the pixel profiles.
Fig. 8.
Change in average pixel ratio between the first and last data points at the MLC abutment position. The X axis shows the MLC abutment position (left 8 cm to right 8 cm with 2-cm interval) and the Y axis shows variation of the pixel ratio between first data and last data. Paired t-test comparisons between first data and last data are shown (P < 0.001: significant difference for every MLC abutment position).
Fig. 9.
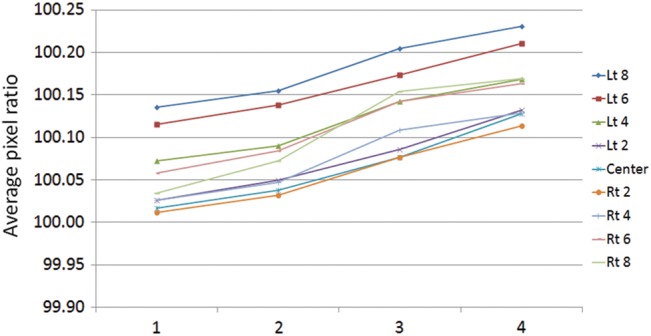
Change in average pixel ratio at the MLC abutment position over 1 month. The X axis is measured in weeks. The Y axis shows average pixel ratio at the MLC abutment position (left 8 cm to right 8 cm with 2-cm interval).
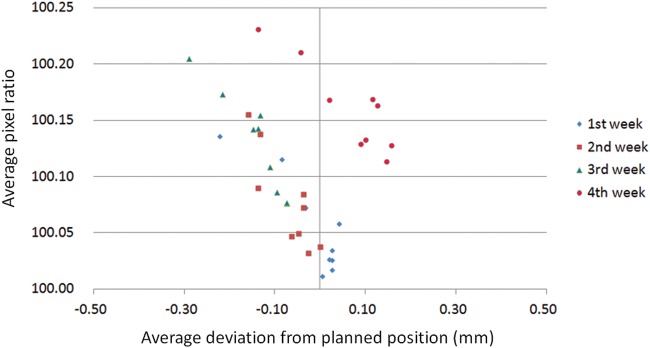
Figure 10 shows a correlation between the average pixel ratios measured at every MLC abutment position at gantry angle 0° and the average deviation from planned position at the same MLC slit location over one month. The data of average pixel ratios are the same as the result of Fig. 9. The data of average deviation from planned position are the same as the result of Fig. 6. Although the value of average pixel ratio was gradually changed positive for every MLC abutment position that mentioned previously in Fig. 9, the average deviations from planned position were distributed between the ranges of –0.30 mm to 0.30 mm.
Fig. 10.
Average pixel ratio at every gap or slit location against the average deviation from planned position over 1 month. The X axis shows average deviation from planned position in millimeter and the Y axis shows average pixel ratio. Each symbol shows the average pixel ratio at every gap location (left 8 cm to right 8 cm with 2-cm interval) over 1 month.
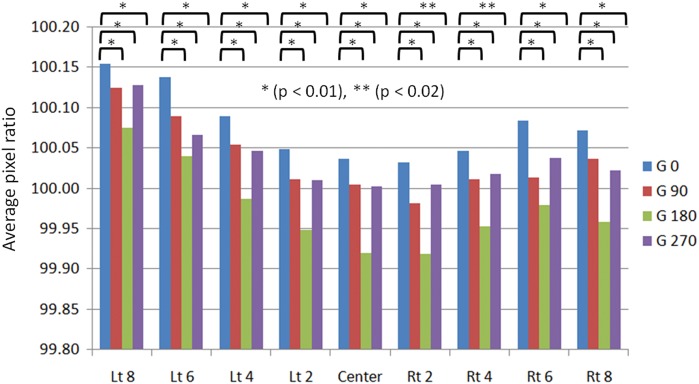
Figure 11 shows the results of the nongap test, in particular the gantry angle dependency of the initial data obtainedin thet first week. The average pixel value of the abutment section in each MLC location (Lt 8–Center–Rt 8) is shown: in every MLC location, the average pixel ratio is clearly lower (the change in color black) at the other gantry angles than at gantry 0°. This variation was larger at gantry angle 180° than at 90 or 270°. The MLC leaves used in this investigation move in an arc trajectory, giving rise to the phenomenon that the MLC positions spread slightly due to their own weight at gantry angle 180° compared with gantry angle 0°. We consider that this effect explains the increase in overlap in dosage profiles.
Fig. 11.
Average pixel ratio at every gap location as a function of gantry angle. The X axis shows every gap location (left 8 cm to right 8 cm with 2-cm interval). Average pixel ratio was significantly different with a P value < 0.01 (*) or < 0.02 (**) for four gantry angles of 0, 90, 180 and 270°.
DISCUSSION
In this study, we investigated the use of an EPID to conduct quality assurance analysis of MLC leaf position. Palta et al. recommended that the tolerance limit of leaf position for segmental MLC should be 1 mm, and this restriction should be made smaller than the 1 pixel size of a computed tomography (CT) image [20]. The CT protocol used in our department is set to a pixel size of 0.98 mm with a field of view of 50 cm for 512 × 512 matrixes. Chang et al. also used an EPID with the pixel size of 0.78 mm for verification of leaf position. They mentioned that the garden fence pattern with a slit size of 1 mm can be faithfully reproduced even with a pixel size of 0.78 mm and the accuracy of the QA procedure was not compromised [18]. On this basis, it was judged that the resolution of 0.27 mm/pixel used in this study was small enough for analysis. LoSasso et al.'s [22] assessment of leaf precision using alternating dynamic and static fields showed that leaf precision was about 0.25 mm, based on a qualitative assessment of radiographic exposures of overlapping fields. This value was close to that we used here using an EPID. Even if the accuracy of MLC leaf position was within the tolerance limit, the dose between MLC abutment leaves was not always stable because of the change of leaf position error shown in Fig. 6. Therefore the nongap test should be performed continuously to check the change of pixel intensities at the MLC abutment region as shown in Fig. 9. Indeed the average deviation from planned position ranged between –0.30 mm and 0.30 mm, which were within the tolerance limit, the average pixel ratios were gradually changed to positive values over 1 month as shown in Fig. 10. Even the deviation of leaf position was small, it was possible to confirm pixel ratio sensitively. That is it is insufficient to only perform the garden fence test for the accuracy of MLC leaf positions, and it should also be added that the nongap test should be performed continuously. Since the nongap test uses EPID images, it is easy to perform and possible to evaluate quantitatively with objectivity. Although the pixel intensity was not necessarily identical with the dose, it might be possible that the pixel intensity profile used in the nongap test was substituted for a relative evaluation of overdosing or underdosing generated in the MLC abutment region. In case of the decision as to ROI position in the nongap test, we manually set the ROI at the same position only in the left top corner on the composite image as precisely as possible for every analysis. Even if the ROI position was by a few pixels, the value of the pixel ratio was not drastically changed: 0.03% as a maximum because the ROI has a band of 10 mm × 5 mm.
Figure 12 shows the radiation field size measured daily for both 10 cm × 10 cm and 20 cm × 20 cm fields at energy levels of 6- and 10-MV X-ray over about 3 months.
Fig. 12.
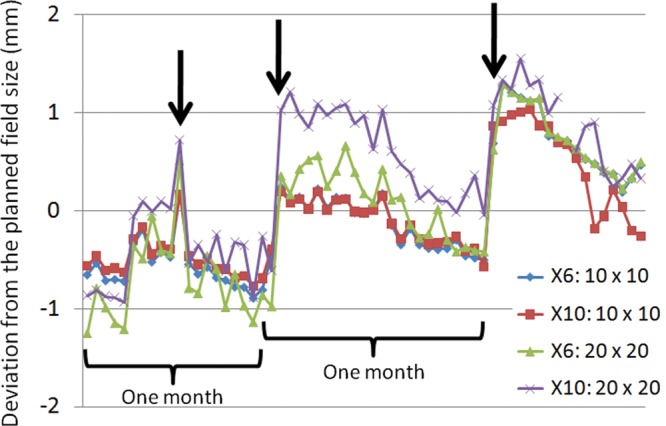
Deviations from the planned field size of 10 cm × 10 cm and 20 cm × 20 cm over 3 months. The X axis shows the time of measurement. Each symbol shows deviation from the planned field size in mm for energy levels of of 6 and 10 MV, field size of 10 cm × 10 cm and 20 cm × 20 cm, respectively. Arrows indicate MLC calibration periods.
The vertical axis indicates deviation from the planned field size in millimeters while the arrows indicate when MLC calibration was performed, namely calibration of exposure field size. Every field size showed a tendency to gradually narrow by as much as 1 mm over 1 month. The MLC used in this study is controlled by a potentiometer and an encoder to recognize leaf positions. The potentiometer has an absolute current value and the encoder has a relative value. This linac machine is also equipped with a feature that stops the MLC leaves moving toward the isocenter once the field size changes according to the manufacturer's hardware control system. If the linac system is turned off at the end of the work day and turned on again the following morning, the encoder is initialized. Following initialization, while the absolute current value for the potentiometer of each MLC leaf does not change, the MLC leaf position is moved toward the closing field via integration of the on/off switching procedure of the system. As a result of this phenomenon, periodical MLC calibration should be performed to adjust the discrepancy between the radiation field size and the value recognized by the detector, namely the potentiometer. We established a field size at the time of calibration of 0.5–1.0 mm wider than the planned field size, as shown in Fig. 12. This explains the tendency in the results of Figs 8 and 9 toward a gradual decrease in relative dose intensity at the abutment regions in the nongap test for about 1 month. The MLC calibration procedure is based on manual control, in which the light field created by the MLC leaf position is fitted by the operator to four positions (–10, 0, 10, 20 cm) using millimeter graph paper [23], and variation in this calibration may accordingly be operator-dependent. The garden fence and nongap tests should therefore be performed immediately after MLC calibration to check the results of the manual calibration setting.
In this work we present a fast and accurate method for computing individual MLC leaf positions and relative dose intensities at the MLC abutment region for in-air portal images. Using the XRETIC plate and an EPID, it was possible to analyze MLC leaf position at a resolution of 0.27 mm with the measurement uncertainty of 0.14 mm, and to evaluate relative dose intensity quantitatively at MLC abutment positions. These findings should be of interest in step-and-shoot IMRT. We also characterized the MLC leaves for this type of machine. Namely, MLC leaf positions were gradually contracted with repeated system on/off switching. We therefore confirmed the dosimetric impact of nongap testing and the change in MLC leaf positions. These tests provides dosimetric verification of MLC collimation based on individual leaf position, and have application in patient pretreatment QA of MLC fields and general MLC QA, as well as in checking MLC calibration variation.
REFERENCES
- 1.Luo W, Li J, Price RA, Jr, et al. Monte Carlo based IMRT dose verification using mlc log files and R/V outputs. Med Phys. 2006;33:2557–64. doi: 10.1118/1.2208916. [DOI] [PubMed] [Google Scholar]
- 2.Woo MK, Nico A. Impact of multileaf collimator leaf positioning accuracy on intensity modulation radiation therapy quality assurance ion chamber measurements. Med Phys. 2005;32:1440–5. doi: 10.1118/1.1901843. [DOI] [PubMed] [Google Scholar]
- 3.Mu G, Ludlum E, Xia P. Impact of MLC leaf position errors on simple and complex IMRT plans for head and neck cancer. Phys Med Biol. 2008;53:77–88. doi: 10.1088/0031-9155/53/1/005. [DOI] [PubMed] [Google Scholar]
- 4.Low DA, Sohn JW, Klein EE, et al. Characterization of a commercial multileaf collimator used for intensity modulated radiation therapy. Med Phys. 2001;28:752–6. doi: 10.1118/1.1367863. [DOI] [PubMed] [Google Scholar]
- 5.Sastre-Padro MA, van der Heide U, Welleweerd H. An accurate calibration method of the multileaf collimator valid for conformal and intensity modulated radiation treatments. Phys Med Biol. 2004;49:2631–43. doi: 10.1088/0031-9155/49/12/011. [DOI] [PubMed] [Google Scholar]
- 6.Sastre-Padro M, Welleweerd J, Malinen E, et al. Consequences of leaf calibration errors on IMRT delivery. Phys Med Biol. 2007;52:1147–1156. doi: 10.1088/0031-9155/52/4/019. [DOI] [PubMed] [Google Scholar]
- 7.Vieira SC, Dirkx MLP, Pasma KL, et al. Fast and accurate leaf verification for dynamic multileaf collimation using an electronic portal imaging device. Med Phys. 2002;29:2034–40. doi: 10.1118/1.1501141. [DOI] [PubMed] [Google Scholar]
- 8.Yang Y, Xing L. Quantitative measurements of MLC leaf displacements using an electronic portal image device. Phys Med Biol. 2004;49:1521–33. doi: 10.1088/0031-9155/49/8/010. [DOI] [PubMed] [Google Scholar]
- 9.Budgell GJ, Zhang Q, Trouncer RJ, et al. Improving IMRT quality control efficiency using an amorphous silicon electronic portal imager. Med Phys. 2005;32:3267–78. doi: 10.1118/1.2074227. [DOI] [PubMed] [Google Scholar]
- 10.Mamalui-Hunter M, Li H, Low DA. MLC quality assurance using EPID: a fitting technique with subpixel precision. Med Phys. 2008;35:2347–55. doi: 10.1118/1.2919560. [DOI] [PubMed] [Google Scholar]
- 11.Boyer A, Biggs P, Galvin J, et al. Basic applications of multileaf collimators. Report of the AAPM Radiation Therapy Committee Task Group No. 50. Madison: Medical Physics Publishing. 2001 [Google Scholar]
- 12.Klein EE, Hanley J, Bayouth J, et al. Task group 142 report: quality assurance of medical accelerators. Med Phys. 2009;36:4197–212. doi: 10.1118/1.3190392. [DOI] [PubMed] [Google Scholar]
- 13.Das IJ, Desobry GE, McNeeley SW, et al. Beam characteristics of a retrofitted double-focused multileaf collimator. Med Phys. 1998;25:1676–84. doi: 10.1118/1.598348. [DOI] [PubMed] [Google Scholar]
- 14.Chui CS, Spirou S, LoSasso T. Testing of dynamic multileaf collimation. Med Phys. 1996;23:635–41. doi: 10.1118/1.597699. [DOI] [PubMed] [Google Scholar]
- 15.Bhardwaj AK, Kehwar TS, Chakarvarti SK, et al. Dosimetric and qualitative analysis of kinetic properties of millennium 80 multileaf collimator system for dynamic intensity modulated radiotherapy treatments. J Cancer Res Ther. 2007;3:23–8. doi: 10.4103/0973-1482.31967. [DOI] [PubMed] [Google Scholar]
- 16.Venencia CD, Besa P. Commissioning and quality assurance for intensity-modulated radiotherapy with dynamic multileaf collimator: experience of the Pontificia Universidad Catolica de Chile. J Appl Clin Med Phys. 2004;5:37–54. doi: 10.1120/jacmp.v5i3.1982. [DOI] [PMC free article] [PubMed] [Google Scholar]
- 17.Mamalui-Hunter M, Li H, Low DA. MLC quality assurance using EPID: A fitting technique with subpixel precision. Med Phys. 2008;35:2347–55. doi: 10.1118/1.2919560. [DOI] [PubMed] [Google Scholar]
- 18.Chang J, Obcemea CH, Sillanpaa J, et al. Use of EPID for leaf position accuracy QA of dynamic multi-leaf collimator (DMLC) treatment. Med Phys. 2004;31:2091–6. doi: 10.1118/1.1760187. [DOI] [PubMed] [Google Scholar]
- 19.Bayouth JE, Wendt D, Morrill SM. MLC quality assurance techniques for IMRT application. Med Phys. 2003;30:743–50. doi: 10.1118/1.1564091. [DOI] [PubMed] [Google Scholar]
- 20.Palta JR, Mackie TR. Intensity-modulated radiation therapy: the state of the art. Madison: Medical Physics Publishing. 2003 [Google Scholar]
- 21.Parent L, Seco J, Evans PM, et al. Evaluation of two methods of predicting MLC leaf positions using EPID measurements. Med Phys. 2006;33:3174–82. doi: 10.1118/1.2335490. [DOI] [PubMed] [Google Scholar]
- 22.LoSasso T, Chui CS, Ling CC. Physical and dosimetric aspects of a multileaf collimation system used in the dynamic mode for implementing intensity modulated radiotherapy. Med Phys. 1998;25:1919–27. doi: 10.1118/1.598381. [DOI] [PubMed] [Google Scholar]
- 23.Siemens Medical Systems, OPTIFOCUS 82 leaf MLC Tuneup Component ONCOR/PRIMUS,” 7337731G [Google Scholar]


