Abstract
Our institute has constructed a new treatment facility for carbon ion scanning beam therapy. The first clinical trials were successfully completed at the end of November 2011. To evaluate patient setup accuracy, positional errors between the reference Computed Tomography (CT) scan and final patient setup images were calculated using 2D-3D registration software. Eleven patients with tumors of the head and neck, prostate and pelvis receiving carbon ion scanning beam treatment participated. The patient setup process takes orthogonal X-ray flat panel detector (FPD) images and the therapists adjust the patient table position in six degrees of freedom to register the reference position by manual or auto- (or both) registration functions. We calculated residual positional errors with the 2D-3D auto-registration function using the final patient setup orthogonal FPD images and treatment planning CT data. Residual error averaged over all patients in each fraction decreased from the initial to the last treatment fraction [1.09 mm/0.76° (averaged in the 1st and 2nd fractions) to 0.77 mm/0.61° (averaged in the 15th and 16th fractions)]. 2D-3D registration calculation time was 8.0 s on average throughout the treatment course. Residual errors in translation and rotation averaged over all patients as a function of date decreased with the passage of time (1.6 mm/1.2° in May 2011 to 0.4 mm/0.2° in December 2011). This retrospective residual positional error analysis shows that the accuracy of patient setup during the first clinical trials of carbon ion beam scanning therapy was good and improved with increasing therapist experience.
Keywords: Radiotherapy, patient setup, 2D-3D registration, interfractional change
INTRODUCTION
Recently, particle therapy has received considerable attention worldwide, and currently there are 14 particle centers (carbon ion and proton beams) under construction in Japan alone. Our carbon ion beam therapy center was constructed in 1994, and more than 5500 cancer patients have been treated by carbon ion beams with the passive irradiation technique in the existing treatment building [1–2]. In 2011, we constructed a new treatment facility for carbon ion beam scanning treatment as an extension of the existing treatment building [3–5, 11]. The higher dose conformation of particle beams to photon beams is well known, and scanning irradiation techniques are sensitive to organ motion and interfractional patient positional variation [6–8]. To achieve good patient positional accuracy, the new treatment facility is equipped with a robotic arm treatment bed with six degrees of freedom and an orthogonal high spatial resolution X-ray flat panel detector system. It is also equipped with 2D-3D registration software to improve treatment workflow.
The first clinical trials without respiratory gating were started in the second quarter of 2011 and successfully completed in December 2011, despite disruption by the powerful Tohoku earthquake, which occurred on 11 March 2011. Apart from one therapist, all medical staff have particle therapy experience and have worked in the particle therapy division in our center. As part of our ongoing introduction of the center, it is necessary to retrospectively survey patient setup accuracy and provide feedback for future treatment.
Here, we retrospectively evaluated the residual errors between the treatment position and the treatment planning computed tomography (CT) in patients treated in the new treatment facility.
MATERIALS AND METHODS
Treatment protocol
A total of 11 patients with tumors of the head and neck (H&N) (five cases), prostate (three cases) and pelvis (three cases) receiving carbon ion scanning beam treatment participated in the first clinical trials at our center and were enrolled in the present study. The patients gave informed consent to participate in the study, which was approved by the Institutional Review Board (IRB) of our institute.
The number of treatment fractions was 12 for a single pelvic case (Patient no. 5) and 16 for the other 11 cases. We used two or three beam angles by using both horizontal and vertical ports and rotating the treatment couch by 180° (IEC definition: θ rotation) to irradiate from the patient's left side. The treatment beam was irradiated from a single beam angle per day. For some H&N patients, the treatment bed was rotated along the φ axis (defined in IEC [9]) at less than ±10° to irradiate from an oblique angle. To improve the positional reproducibility of the patients, they were fixed by immobilization with a shell device, which covers the patient and is affixed with tape to the bottom of the table. These immobilization devices were made of a low-temperature thermoplastic (Shellfitter; Keraray Co., Ltd, Osaka, Japan) and hydraulic urethane resin (Moldcare, Alcare, Tokyo, Japan).
Eight patients (Patient nos 1–8) were treated before our scheduled summer maintenance term, which is of approximately 1 month's duration.
Data acquisition
All patients underwent treatment planning CT imaging in helical mode, and prostate and pelvic cases additionally under breath-holding at exhalation. Scan conditions were based on clinical conditions, and had a tube voltage of 120 kV, pitch factor of 11 for head cases and 15 for other cases, and slice collimation of 16 × 2.0 mm. For reconstruction parameters, pixel size for the H&N and other cases was 0.625 mm and 1.074 mm, respectively. Slice thickness was limited to 2.0 mm owing to the slice collimation of 2.0 mm.
In the treatment stage, orthogonal flat panel detector (FPD) images were acquired for patient positional verification (Canon, CXDI-55C, Tokyo, Japan) with an imaging area size of 35 × 43 cm and pixel pitch of 0.16 mm. Radiation dose from the X-ray tube is increased with increasing X-ray image acquisition, but we did not limit the number of X-ray images acquired in order to improve the treatment accuracy. The room configuration is as follows. Both FPDs are installed at the front of the respective irradiation ports within the port cover, and the vertical X-ray tube is set under the floor (Fig. 1). The horizontal X-ray tube is set at the opposite side of the horizontal FPD and moved down when it is used. The distance from the room isocenter (ISO) and the source-image receptor distance (SID) are 155 cm and 213 cm, respectively.
Fig. 1.
Front view of the treatment room and installation of X-ray imaging devices [orthogonal X-ray tubes and flat panel detectors (FPDs)]
After the patient entered the treatment room and was transferred to the ISO automatically by the selective compliance assembly robot arm (SCARA)-type robotic arm treatment bed, orthogonal FPD images were acquired and imported into the patient setup software. Therapists started the 2D-3D auto registration function and/or manual registration and obtained the corrected treatment bed position (three translations and three rotations). They then manipulated the robotic arm bed to the corrected treatment bed position. Orthogonal FPD images were again acquired and these FPD images and the reference FPD images were compared by visual inspection. If necessary, therapists adjusted patient position manually after the 2D-3D auto-registration, this process is strongly dependent on the therapist's skill. These processes were repeated until the therapists and oncologists were satisfied with the patient positional accuracy compared with the reference images, which were acquired in the simulation stage. In the first clinical trials, two therapists, one with more than 20 years' experience in the particle therapy field in our center and the second with no experience in particle therapy, performed the patient setup process. Positional accuracy of the robotic arm treatment bed was within a sphere of 0.5-mm diameter.
Evaluation method
To calculate residual positional error (three translations: Δx, Δy and Δz and three rotations: Δψ, Δφ and Δθ, defined in IEC [9]; ψ, φ and θ were rotation along the x, y and z axis, respectively) retrospectively, the 2D-3D auto registration software was used by importing the final patient setup orthogonal FPD images through the treatment course and the treatment planning CT data sets. This auto-registration software was developed in our center and the same software used in the treatment process [10]. The algorithm registers digital reconstructed radiography (DRR) images projected by the 3DCT data to the acquired horizontal/vertical FPD images and derives six degrees of freedom positional error values. Since image quality of DRR such as spatial resolution is inferior to those acquired using FPD, the auto-registration software calculates DRR in fine calculation grid steps and applied image processing to improve image quality [11–12]. The registration metrics are a combination of the normalized mutual information [13] and gradient differences [14]. Calculation ROIs were set on the respective orthogonal FPD images and these ROIs were recorded to the DICOM-RT tag (overlay plane module) of the final patient setup images to check the residual error retrospectively. We imported the calculation ROI, recorded the DICOM-RT tag and calculated residual errors. The calculation accuracy of this software is to within 0.3 mm and 0.3°, however, these are dependent on the patient.
Translational and rotational residual errors for respective treatment fractions were expressed as target registration error (TRE) and angular error (AE), calculated using the following equations:
Where k is the treatment fraction number. Computation time of the 2D-3D auto registration was also measured during the retrospective analysis only.
When comparison between the registered images by visual inspection was not acceptable level after calculating using the 2D-3D auto registration software, we changed the calculation parameters and recalculated the residual errors.
RESULTS
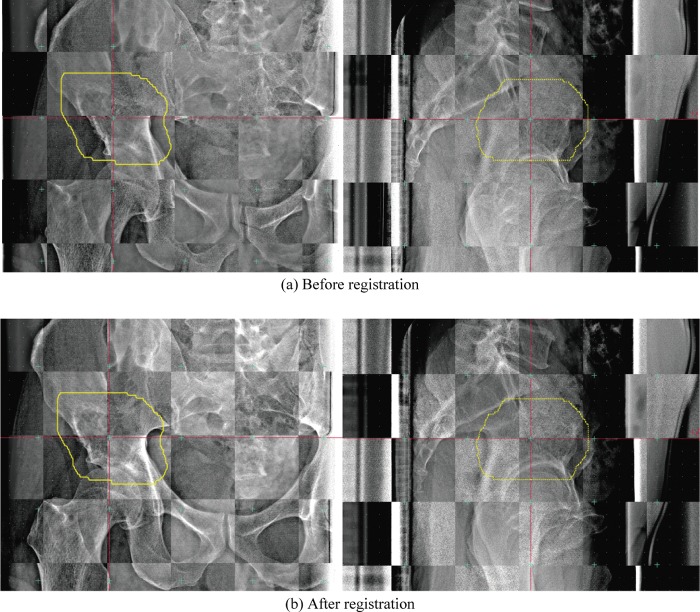
Figure 2 shows the checkerboard composite of the reference FPD images, and before/after registration at the 11th treatment fraction for the first case of B&S sarcoma (Patient 5). Bone structures before registration in the checkerboard composite images show a zigzag structure in both the horizontal and vertical images (Fig. 2a). These structures are substantially smoothed after registration in the checkerboard composite images (Fig. 2b). Residual errors in this case were minor [TRE11th = 0.66 mm (Δx –0.51 mm, Δy 0.33 mm, Δz –0.25 mm), AE11th = 0.05° (Δψ 0.04°, Δφ –0.01°, Δθ 0.02°)]. Since the treatment region was located at the superior aspect of the head of the femur, 2D-3D registration calculation ROIs did not include the femoral bone. The left and right femoral bone positions were not exactly the same.
Fig. 2.
Checkerboard composite pelvic reference images of (a) FPD images before registration and (b) FPD images after registration (i.e. final patient setup images) (pt. no. 5, 11th treatment fraction). Yellow line shows planning target volume (PTV).
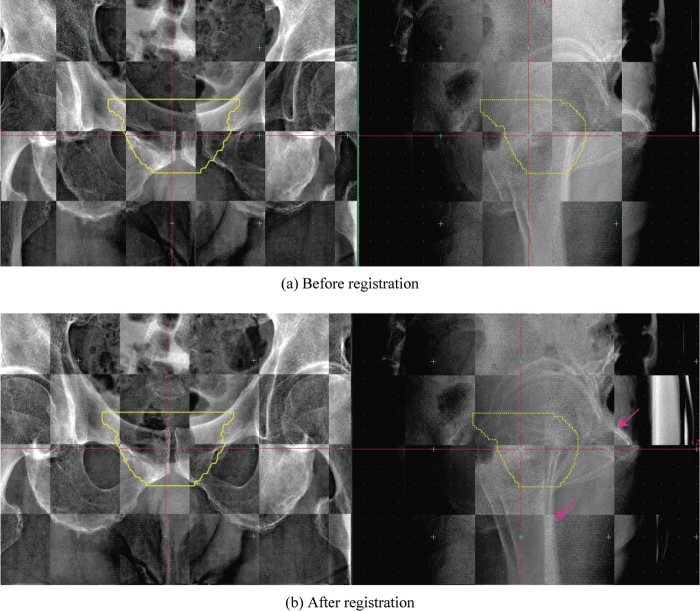
For the second case, involving the prostate (Patient 1, fifth treatment fraction), residual errors were TRE5th = 3.65 mm (Δx –0.72 mm, Δy: –0.5 mm, Δz: –3.54 mm) and AE5th = 0.39° (Δψ 0°, Δφ 0.13°, Δθ 0.37°). This case was subject to a large translation positional error. In the vertical registered image (Fig. 3b), bone structures in the post-registration FPD images were continuous. Since the treatment region was the prostate, the registration calculation ROI included femoral bone in the horizontal image. As a result, the pubic bone position was not registered well.
Fig. 3.
Checkerboard composite prostate reference images of (a) FPD images before registration and (b) FPD images after registration (ie. final patient setup images) (pt. no. 1, 5th treatment fraction).
Yellow line shows planning target volume (PTV).
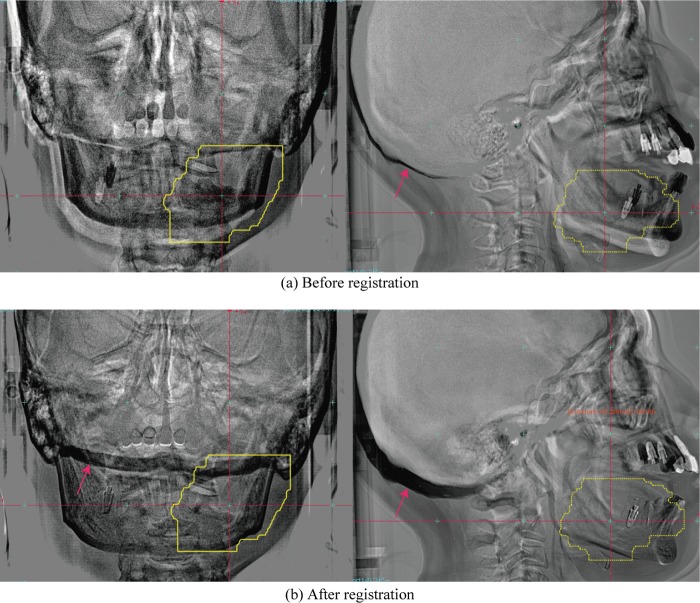
Another case in which the target was located in the lower jaw (Patient 2, second treatment fraction) was subject to a large rotational error (Fig. 4). In this case, the image subtraction display provides a clearer understanding of the positional differences between the reference and FPD images acquired in the treatment room than the checkerboard display. The residual errors were TRE2nd = 1.98 mm (Δx –0.51 mm, Δy –1.35 mm, Δz –1.35 mm), AE2nd = 3.83° (Δψ –3.79°, Δφ –0.53°, Δθ 0.10°). Although this patient had a bite block device to improve upper and lower jaw positional reproducibility, assuming the same jaw position during the patient setup process proved difficult. Skull base positions in the reference FPD images and FPD images acquired in the treatment room before registration were therefore very close, but differed after registration of the lower jaw region due to the difficulties with lower jaw positional reproducibility. Since therapists set the calculation ROI to include the skull base bone in the vertical images (red arrow in Fig. 4b, left column), the 2D-3D registration software tried to adjust both the lower jaw and skull base bone. As a result, the lower front tooth positions included a large ψ rotational error (–3.79°).
Fig. 4.
Subtracted head images, the reference FPD images minus (a) FPD images before registration, (b) FPD images after registration (i.e. the final patient setup image) (pt. no. 2, 2nd treatment fraction). Yellow line shows planning target volume (PTV). The red arrows show the skull base bone position.
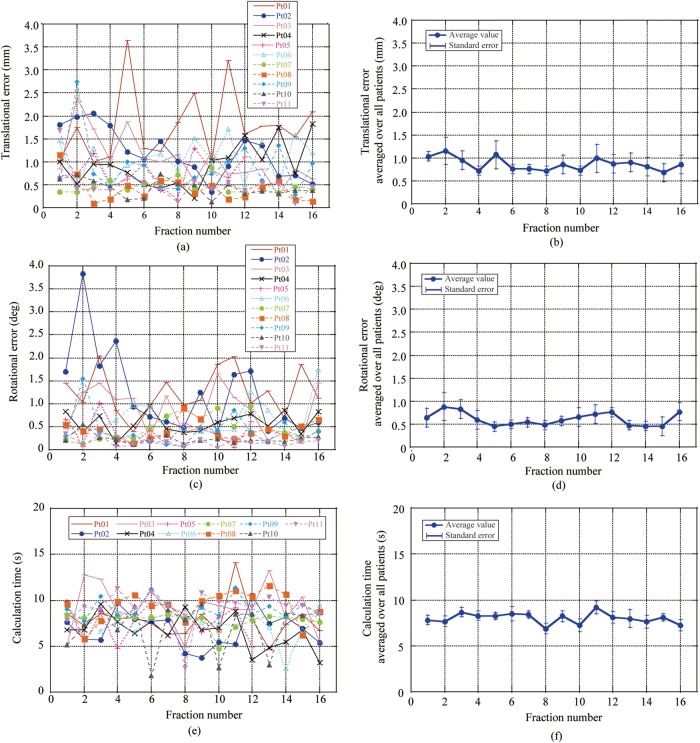
Residual errors for each patient and those averaged over all patients are shown in Fig. 5a–d. Translational errors for Patient 1 were increased in fractions 5, 9 and 11 due to the different positions of both the left and right femoral bones between the reference and final patient setup images. Both translational and rotational errors in Patient 2 were relatively large in early treatment fractions, but decreased with subsequent fractions as he acquired experience of the treatment. Residual errors averaged over all patients as a function of treatment fraction decreased from the start (1.09 mm/0.76°; averaged values in first and second treatment fractions) to the last treatment fraction (0.77 mm/0.61°; averaged values in 15th and 16th treatment fractions) (Fig. 5b and d). 2D-3D registration calculation time averaged 8.0 s throughout the treatment course, and was not dependent on treatment site or treatment fraction number (Fig. 5e and f).
Fig. 5.
Results for positional errors in each patient as a function of fraction number for (a) translational error for each patient, (b) translational error averaged over all patients, (c) rotational error for each patient,(d) rotational error averaged over all patients, (e) results for calculation time for each patient and (f) time averaged over all patients
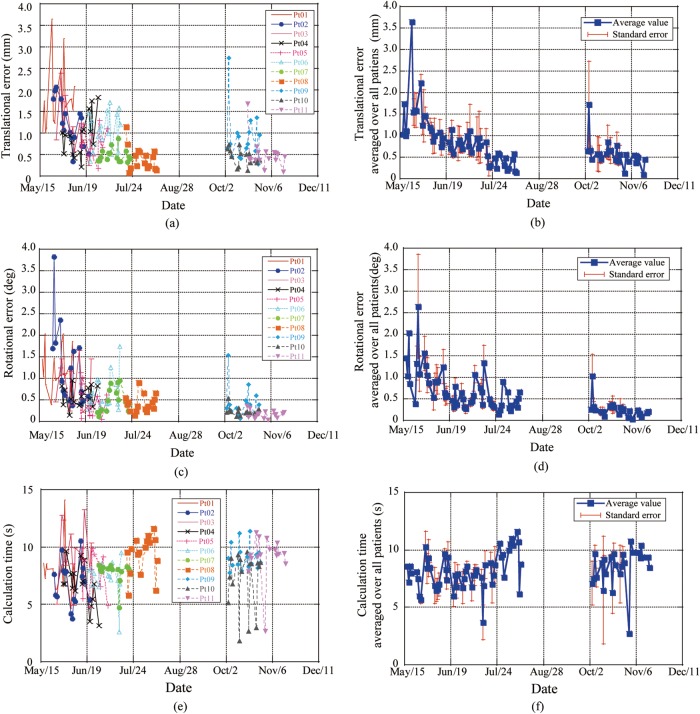
Residual errors for each patient and those averaged over all patients as a function of date are shown in Fig. 6a–d. Since all 11 patients were not treated during the same term, the number of patients was not the same during specific terms. Residual errors in the translation and rotation averaged over all patients decreased with the progression of treatment dates (TRE = 1.6 mm, AE = 1.2° in May 2011 to TRE = 0.4 mm, AE = 0.2° in December 2011). Since we had a scheduled semiannual treatment machine maintenance term (approximately 1 month) in the summer and treatment was restarted for three patients (Patients 9–11), residual positional errors around this term showed a small increment. Computation time was not dependent on treatment date (Fig. 6e and f).
Fig. 6.
Results for residual positional error for each patient as a function of date for (a) translational error for each patient, (b) translational error averaged over all patients, (c) rotational error for each patient, (d) rotational error averaged over all patients, (e) results for calculation time for each patient and (f) time averaged over all patients
Residual errors averaged over all patients through the treatment course were TRE = 0.87 mm ± 0.41 mm and AE = 0.61° ± 0.36°. 2D-3D registration calculation time was 8.0 s ± 1.0 s. The details are listed in Table 1.
Table 1.
Patient setup error results for all patients
| Pt. no. | Treatment site | No fraction | Target registration errror TRE (mm) |
Angular error:AE(deg) |
Calc. time (s) |
|||||||||
|---|---|---|---|---|---|---|---|---|---|---|---|---|---|---|
| Mean | S.D. | Max | Min | Mean | S.D. | Max | Min | Mean | S.D. | Max | Min | |||
| 1 | Prostate | 16 | 1.78 | 0.77 | 3.65 | 1.00 | 1.25 | 0.49 | 2.04 | 0.39 | 7.8 | 2.0 | 14.1 | 4.7 |
| 2 | H&N | 16 | 1.20 | 0.53 | 2.06 | 0.34 | 1.22 | 0.93 | 3.83 | 0.37 | 6.8 | 1.9 | 10.5 | 3.8 |
| 3 | Pelvis | 16 | 1.06 | 0.54 | 2.39 | 0.25 | 0.84 | 0.51 | 1.65 | 0.14 | 9.1 | 2.6 | 13.2 | 4.9 |
| 4 | H&N | 16 | 0.93 | 0.47 | 1.83 | 0.21 | 0.59 | 0.23 | 0.95 | 0.05 | 6.7 | 1.8 | 9.6 | 3.2 |
| 5 | Pelvis | 12 | 0.76 | 0.32 | 1.29 | 0.18 | 0.39 | 0.29 | 1.02 | 0.27 | 7.8 | 1.9 | 9.9 | 4.8 |
| 6 | Pelvis | 16 | 1.07 | 0.43 | 1.71 | 0.34 | 0/65 | 0.41 | 1.74 | 0.12 | 7.4 | 1.5 | 9.5 | 2.6 |
| 7 | H&N | 16 | 0.48 | 0.15 | 0.87 | 0.33 | 0.48 | 0.27 | 0.95 | 0.14 | 7.8 | 0.9 | 8.4 | 4.7 |
| 8 | H&N | 16 | 0.42 | 0.28 | 1.15 | 0.09 | 0.42 | 0.20 | 0.91 | 0.07 | 9.4 | 1.7 | 11.6 | 5.8 |
| 9 | Prostate | 16 | 0.89 | 0.58 | 2.74 | 0.28 | 0.42 | 0.36 | 1.54 | 0.11 | 9.1 | 1.1 | 11.4 | 7.7 |
| 10 | H&N | 16 | 0.43 | 0.18 | 0.73 | 0.13 | 0.23 | 0.10 | 0.54 | 0.04 | 7.1 | 2.6 | 9.6 | 1.8 |
| 11 | Prostate | 16 | 0.50 | 0.35 | 1.68 | 0.10 | 0.17 | 0.09 | 0.35 | 0.04 | 9.2 | 1.9 | 11.3 | 2.7 |
| Total | 0.87 | 0.41 | 3.65 | 0.09 | 0.61 | 0.36 | 3.83 | 0.04 | 8.0 | 1.0 | 14.1 | 1.8 | ||
Abbreviations: Pt.no. = patient number, S.D. = standard deviation, Max = maximum, Min = minimum, Calc. time = calculation time, H&N = head and neck.
DISCUSSION
We retrospectively quantified residual positional errors occurring in the first clinical trials of our new carbon ion scanning beam therapy center. Residual errors averaged over all patients throughout the treatment course were TRE = 0.87 mm ± 0.41 mm and AE = 0.61° ± 0.36°. These improved to TRE = 0.4 mm and AE = 0.2° with accumulating therapist experience over 5 months. Considering that positional accuracy of the robotic arm treatment bed is within 0.5 mm, these results for residual error are highly accurate. After moving the treatment bed to the corrected bed position using the 2D-3D registration software, therapists sometimes adjusted the treatment bed position manually under their own observation. This manual adjustment was necessitated due to interfractional changes between treatment and CT acquisition process and/or due to positional change between the 2D-3D auto registration calculation and acquired FPD images after moving the patient couch to the corrected position, for example, due to swallowing. In this study, we evaluated the residual error based on the assumption that the ‘CT data is correct’ because the CT data is used in the treatment planning; that is, the treatment beam is irradiated to the patient position in the planning CT data. Even though the residual error derived from the retrospective calculation using the 2D-3D auto-registration software is due to inter/intrafractional changes, this error could have an effect on the treatment accuracy.
Commercially available auto-registration software displayed the acquired FPD image in the treatment room and the reference DRR images, which the therapists compared by observation to confirm the patient setup position [15]. Most particle centers have yet to install 2D-3D registration software, however. The difference in patient setup processes between photon and particle therapy is that therapists do a final check of the setup accuracy in particle therapy by comparing the acquired FPD images in the treatment room and the reference FPD images, but use the reference DRR images in photon beam therapy.
The 2D-3D registration function adjusts the acquired image in the treatment room to the reference image within the calculation ROI only. Due to the difficulty of defining the calculation ROI optimum position automatically, however, it is often necessary to rely also on the user's anatomical knowledge. In our existing facility, where we use a passive carbon ion beam irradiation technique, we have used a manual registration function (point matching method) using orthogonal X-ray images in the patient setup process for more than 20 years. It took considerable time to master the 2D-3D registration function in the new treatment facility, even though therapists had long experience in the existing facility. Further, another therapist in our facility without therapeutic experience also had no experience of using 2D-3D registration. In this clinical trial, we treated only 11 patients during the approximately 5-month trial period, with a maximum of three patients treated per day and a total of approximately 170 fractions. These treatment numbers are much smaller than those in the existing facility, where 20 patients/room/day are routinely treated. Residual errors were nevertheless improved by their experience with the 2D-3D registration function in the short term.
Patient setup accuracy and time for manual registration is dependent on therapist skill and experience, and manual registration may therefore take a longer time to gain proficiency. For newly hired therapists or therapists with no experience of this therapy, the patient setup process is easily and quickly conducted with acceptable positional accuracy.
The best way to give useful information to the therapist is to show the residual errors in image overlay techniques (subtraction, checkerboard, blend with reference and acquired images in the same direction) and to show the numerical values of the residual positional errors. Using the experience gained in this clinical trial, we are now preparing guidelines for the patient setup process, including how to define the 2D-3D registration calculation ROI in each treatment site to ensure an acceptable level of skill among all therapists.
Another important factor in particle therapy is treatment workflow. Even though a final check for patient setup should be done by the therapists and oncologist, the average computation time of the 2D-3D auto registration function was 8 s. This computation time in this study, however, is superior to that in the treatment process because initial positional differences before performing the 2D-3D registration in this study were smaller than those in the treatment process. Patient positioning workflow is an important factor, however, it is beyond the scope of this study. From our experiences in the first clinical trials, however, the patient setup workflow between acquiring first FPD images and setup completed was 12 min on average, much shorter than the manual registration process 10 min to >30 min). Since therapist experience of the auto-registration function (∼6 months) in the new treatment facility is much shorter than experience of the manual registration function in the existing facility, the patient setup workflow time will become shorter than in these clinical trials as the therapists gain experience. Shortened patient setup time is good for patient comfort and improves treatment room occupation time. As an example, our existing facility treats approximately 20 patients per room per day. If treatment occupation time is shortened to 1 min, total treatment time may be reduced to 20 min [16]. This saved time can be used to treat additional patients. Details of these savings in treatment time are beyond the scope of the present study, however, and are not described here.
In this clinical trial, treatment was done without respiratory gating. Respiration may reduce the reproducibility of anatomical positioning for the thoracic and abdominal regions, and this merits additional investigation. The present experience should nevertheless be useful in respiratory gating treatment.
CONCLUSION
This retrospective patient setup error analysis shows that the accuracy of patient setup during the first clinical trials of carbon ion beam scanning therapy was good, and that accuracy improved with increasing therapist experience. Although only a limited number of patients were evaluated, we consider that our initial analysis and results of this first clinical experience for carbon ion scanning beam treatment will be highly useful to the next treatment step, namely to conferral under the Japanese system to the status of highly advanced medical treatment.
REFERENCES
- 1.Jakel O, Karger CP, Debus J. The future of heavy ion radiotherapy. Med Phys. 2008;35(12):5653–63. doi: 10.1118/1.3002307. [DOI] [PubMed] [Google Scholar]
- 2.Takada E. Carbon ion radiotherapy at NIRS-HIMAC. Nucl Phys A. 2010;834:730c–5c. [Google Scholar]
- 3.Furukawa T, Inaniwa T, Sato S, et al. Performance of the NIRS fast scanning system for heavy-ion radiotherapy. Med Phys. 2010;37(11):5672–82. doi: 10.1118/1.3501313. [DOI] [PubMed] [Google Scholar]
- 4.Minohara S, Fukuda S, Kanematsu N, et al. Recent innovations in carbon-ion radiotherapy. J Radiat Res (Tokyo) 2010;51(4):385–92. doi: 10.1269/jrr.10028. [DOI] [PubMed] [Google Scholar]
- 5.Torikoshi M, Minohara S, Kanematsu N, et al. Irradiation system for HIMAC. J Radiat Res. 2007;48:A15–A25. doi: 10.1269/jrr.48.a15. [DOI] [PubMed] [Google Scholar]
- 6.Bert C, Rietzel E. 4D treatment planning for scanned ion beams. Radiat Oncol. 2007;2:24. doi: 10.1186/1748-717X-2-24. [DOI] [PMC free article] [PubMed] [Google Scholar]
- 7.Inaniwa T, Kanematsu N, Furukawa T, et al. A robust algorithm of intensity modulated proton therapy for critical tissue sparing and target coverage. Phys Med Biol. 2011;56(15):4749–70. doi: 10.1088/0031-9155/56/15/008. [DOI] [PubMed] [Google Scholar]
- 8.Mori S, Lu HM, Wolfgang JA, et al. Effects of interfractional anatomical changes on water-equivalent pathlength in charged-particle radiotherapy of lung cancer. J Radiat Res (Tokyo) 2009;50(6):513–519. doi: 10.1269/jrr.09032. [DOI] [PubMed] [Google Scholar]
- 9.International Electrotechnical Commission. Radiotherapy Equipment – Coordinates, Movements and Scales. 61217. Geneva: International Electrotechnical Commission. 2008 [Google Scholar]
- 10.Mori S, Kumagai M, Matsuzaki Y, et al. :125–131. Multi-dimensional Image Guided Particle Therapy, Proc. NIRS-ETOILE 2nd Joint Symposium 2011 on Carbon Ion Radiotherapy, 2012; NIRS-M-243. [Google Scholar]
- 11.Mori S, Kumagai M, Fukuhara R, et al. GPU-based image registration for fast patient position verification at the new treatment facility of the National Institute of Radiological Sciences. J Appl Clin Med Phys. 2011:125–131. [Google Scholar]
- 12.Mori S, Kobayashi M, Kumagai M, et al. Development of a GPU-based multithreaded software application to calculate digitally reconstructed radiographs for radiotherapy. Radiol Phys Technol. 2009;2(1):40–5. doi: 10.1007/s12194-008-0040-3. [DOI] [PubMed] [Google Scholar]
- 13.Studholme C, Hill DL, Hawkes DJ. An overlap invariant entropy measure of 3D medical image alignment. Pattern Recognition. 1999;32:71–86. [Google Scholar]
- 14.Penney GP, Weese J, Little JA, et al. A comparison of similarity measures for use in 2-D-3-D medical image registration. IEEE Trans Med Imaging. 1998;17(4):586–95. doi: 10.1109/42.730403. [DOI] [PubMed] [Google Scholar]
- 15.Chang Z, Wang Z, Ma J, et al. 6D image guidance for spinal non-invasive stereotactic body radiation therapy: Comparison between ExacTrac X-ray 6D with kilo-voltage cone-beam CT. Radiother Oncol. 2010;95(1):116–21. doi: 10.1016/j.radonc.2009.12.036. [DOI] [PubMed] [Google Scholar]
- 16.Smith AR. Vision 20/20: proton therapy. Med Phys. 2009;36(2):556–68. doi: 10.1118/1.3058485. [DOI] [PubMed] [Google Scholar]


