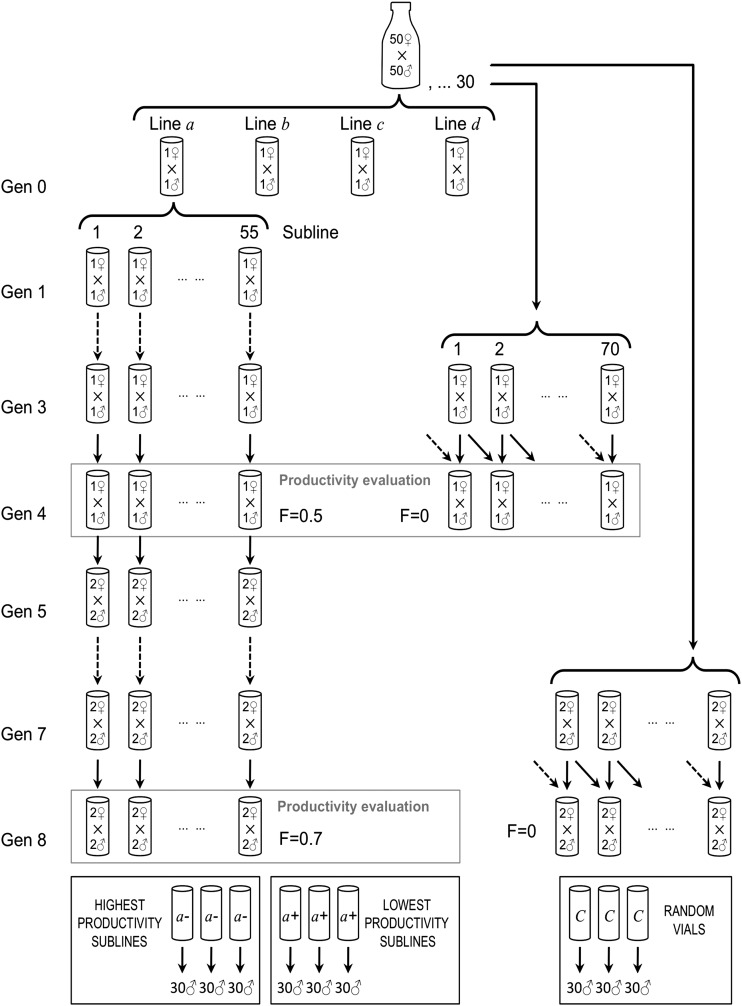
Figure 2 .
Experimental design to produce four sets of sublines with the highest inbreeding depression (lowest productivity, sublines labeled with +) and sublines with the lowest inbreeding depression (highest productivity, sublines labeled with –). Expression analysis was carried out for these sublines’ sets as well as for an outbred control obtained from the base population.

