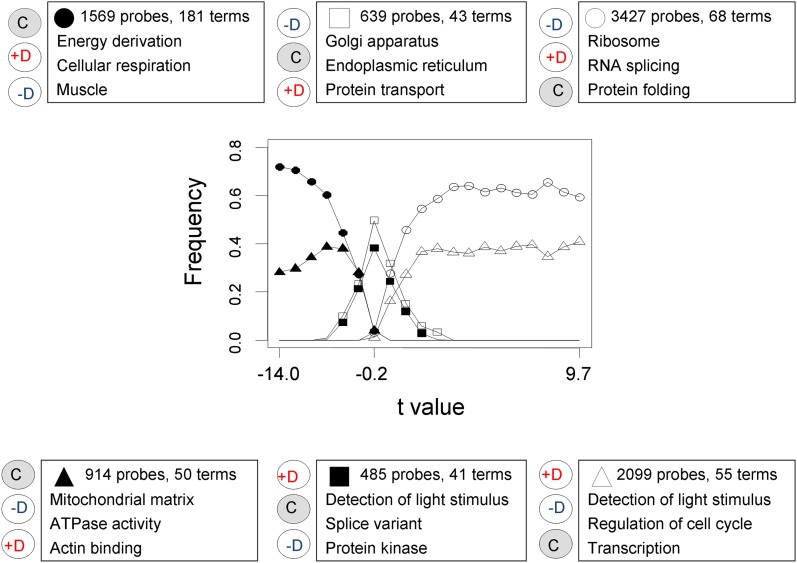
Figure 8 .
Relative frequencies of probe sets in each gene-expression profile of Figure 5. We ranked the 9133 expressed probe sets according to their Student’s t-value in the inbreds vs. control test, and divided the rank in 20 tiers of size 456 (except the last one, of size 469). Thus, the right-hand part of the figure indicates probes upregulated with inbreeding, and those in the left-hand side are probes downregulated with inbreeding. We show the frequencies of the different expression profiles in each tier. The most relevant functional terms enriching the genes in each profile are shown, giving preference to those most informative, significant, and nonredundant.

