Abstract
How non-echolocating deep diving marine predators locate their prey while foraging remains mostly unknown. Female southern elephant seals (SES) (Mirounga leonina) have vision adapted to low intensity light with a peak sensitivity at 485 nm. This matches the wavelength of bioluminescence produced by a large range of marine organisms including myctophid fish, SES’s main prey. In this study, we investigated whether bioluminescence provides an accurate estimate of prey occurrence for SES. To do so, four SES were satellite-tracked during their post-breeding foraging trip and were equipped with Time-Depth-Recorders that also recorded light levels every two seconds. A total of 3386 dives were processed through a light-treatment model that detected light events higher than ambient level, i.e. bioluminescence events. The number of bioluminescence events was related to an index of foraging intensity for SES dives deep enough to avoid the influence of natural ambient light. The occurrence of bioluminescence was found to be negatively related to depth both at night and day. Foraging intensity was also positively related to bioluminescence both during day and night. This result suggests that bioluminescence likely provides SES with valuable indications of prey occurrence and might be a key element in predator-prey interactions in deep-dark marine environments.
Introduction
Understanding the dynamic relationship between prey and predators is a key topic in ecology [1]. In many natural cases, prey are clustered in patches [2] with no clear boundaries. These patches can only be defined as areas where the local resource density is higher than the mean overall resource density [3], [4]. In these continuous, yet patchy environments, such as marine environments for instance, efficient predators are likely to focus their search effort to areas of high density of prey [4]–[6].
Numerous studies have investigated the foraging behaviour of marine predators (such as birds and mammals) in relation to physical (e.g. temperature) and biological (e.g. phytoplankton) parameters used as indirect indicators of prey distribution [7]–[9]. However, only few studies looked at the relationships between foraging behaviour of diving predators and direct indices of the presence of prey (e.g. videos) [10], [11].
Marine predators can cue in on signals emitted by prey to estimate the local densities or quality of prey. They rely on their sensory systems such as olfaction [12], [13], echolocation [14] or, in most of the cases, vision [15], [16] to detect these signals. Unlike odontocetes, pinnipeds do not echolocate to find their prey [17]. This raises the question of how deep-diving pinnipeds manage to locate their prey in the deep dark ocean. Previous studies have shown that some pinnipeds that feed at night or during deep dives, such as elephant seals, have a vision adapted to low light intensity characterized by a sensitivity peak at 485 nm ( = λ max). This corresponds to the blue light produced by bioluminescent marine organisms and could suggest a vision-based predation [18]–[20].
Southern elephant seals (Mirounga leonina) (SES hereafter) are the largest of pinnipeds. They spend around 10 months at sea and come back ashore only to breed in October, or to molt in January. When foraging at sea, SESs dive continuously, sometimes deeper than 1500m [21]. They forage over broad distances [21], [22].
Both Fatty Acid and stable isotopes analyses suggest that myctophids (or lantern fish) are the main prey of both adult females [23] and juvenile males [24]. Stomach content analyses of female elephant seals from King George Island and Heard Island [25], [26] also reveal that the most common myctophids species in their diet were Gymnoscopelus nicholsi, Electrona Antarctica and E. calsbergi. These 3 species also happen to be the 3-most abundant myctophids within the Southern Ocean [27].
Myctophids have a large number of photophores (light-producing organs) located in ventrolateral rows of their body and head, which gives them the capacity to be bioluminescent. Bioluminescence emitted by myctophids can be of two sorts and serve different purposes: bright and fast flashes are used for communication (i.e. intra-specific and sex identification) or to startle potential predators, while glow emissions are used to mask the fish silhouette from predators underneath (counter-illumination) [28]–[30]. Previous work showed that SESs have large eyes with a capacity for a wide range of pupillary dilation [19] and rapid adjustments to the darkness [20]. Their retina contains a deep-sea rhodopsin with a maximum sensitivity (ability to react to a stimulus) at 485 nm [18] matching the λmax of the visual pigments of their myctophid prey (Gymoscopelus nicholsi: λmax = 489 nm, Electrona antarctica: λmax = 488 nm, E. carlsbergi: λmax = 485 nm) [31].
The objective of this study was to assess whether the number of bioluminescence events detected during deep dives provides an accurate qualitative index of the visited foraging areas. We focused on the Kerguelen SES population. We investigated the foraging activity of females SES at depth in relation to the amount of in situ bioluminescence detected during a dive by a highly sensitive light sensor. Due to limited sample size and to avoid confounding factors such as the effects of foraging habitat features (i.e two third of SES females foraging in Polar frontal zone vs one third in Antarctic waters) [24], [32], the analyses were restricted to female SES foraging within the polar frontal zone.
Methods
Ethics Statement
Our study on elephant seals was approved and authorized by the ethics committee of the French Polar Institute (Institut Paul Emile Victor – IPEV) in May 2008. This Institute does not provide any permit number or approval ID, however animals were handled and cared for in total accordance with the guidelines and recommendations of this committee (dirpol@ipev.fr).
Deployment of Devices and Data Collected
The foraging ecology of Southern elephant seals in Kerguelen has been investigated since 2003 when annual deployments of CTD-SRLDs started (Argos-linked conductivity–temperature–depth-Satellite Relayed Data Logger/Sea Mammal Research Unit –SMRU-, University of St Andrews Scotland). In 2009 however, we deployed new devices that also included a fluorescence sensor, combined with MK9 -Time Depth Recorders (Wildlife Computers, Washington, USA). We thus recorded fine scale diving behaviors of five SES females in addition to high resolution measures (every 2 sec) of temperature and light during their entire post-breeding foraging trip.
The light sensor (Hamamatsu S2387 series photodiode) was used with a 470–590 nm filter. This light sensor was able to measure changes in light under very low light conditions: its detection capacity ranged from 10 to 250 in raw values, corresponding to a range of 10−11–10−1 W.cm−2.
Animals were captured with a canvas head-bag and anesthetized using a 1∶1 combination of Tiletamine and Zolazepam (Zoletil 100) injected intravenously [33], [34]. MK9 were first attached to the CTDs, and then both CTDs and MK9 tags were glued on the seal’s head using quick-setting epoxy (Araldite AW 2101). CTDs were oriented towards the head of the animal, while MK9 were oriented backwards so that light sensors were turned towards the backside of the animals.
SES from Kerguelen that feed within the Polar Frontal Zone can forage within two distinct oceanographic domains: 1) the pelagic zone (i.e; deeper than 1000 meter) encompassed between the subantartic and the Polar Front, and 2) the benthic zone over the continental plateau, where diving depths are restricted by the local bathymetry (i.e. shallower than 1000 m). In this study, we only focused on animals that foraged within the pelagic domain.
Diving Behaviour and Characterization of Foraging
We considered seals diving only for depths of 15 m or more, otherwise they were at the surface. This threshold was chosen to avoid wrongly selecting dives due to subsurface movements of animals. Dives were then divided into three distinct phases using a vertical speed criterion. Descent and ascent phases were defined as movements with a vertical speed greater than 0.4 m.s−1 from or toward the surface. The bottom phase was defined as a period between the descent and the ascent phases with a vertical speed lower than 0.4 m.s−1 [35], during which, SES could travel upward, downward or horizontally.
We used two factors to define the foraging intensity of each dive [35]: the ascent rate of a dive and the descent rate of the following one. These two factors are known to influence foraging success in a large number of marine predators [36]–[39], (C.Guinet, unpublished data on SES). We combined these variables using a Principal Component Analysis (PCA) to obtain an unique index to the foraging intensity. Principal component 1 (The first axis) explained 78.9% of the total variance and was used as an index of foraging intensity per dive in our analyses.
Detection of Bioluminescence Events
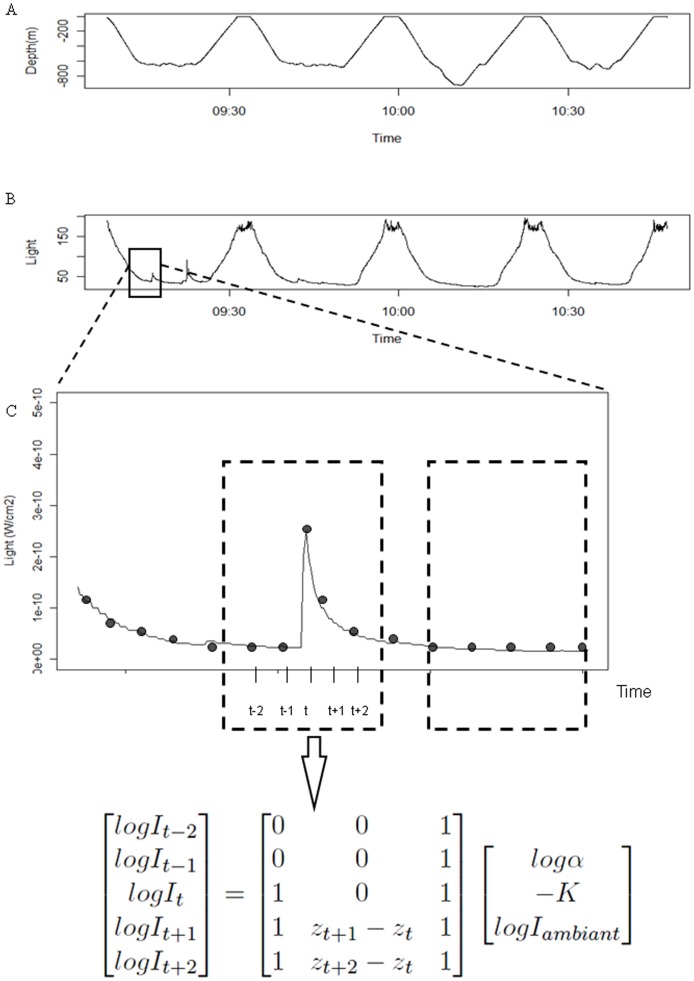
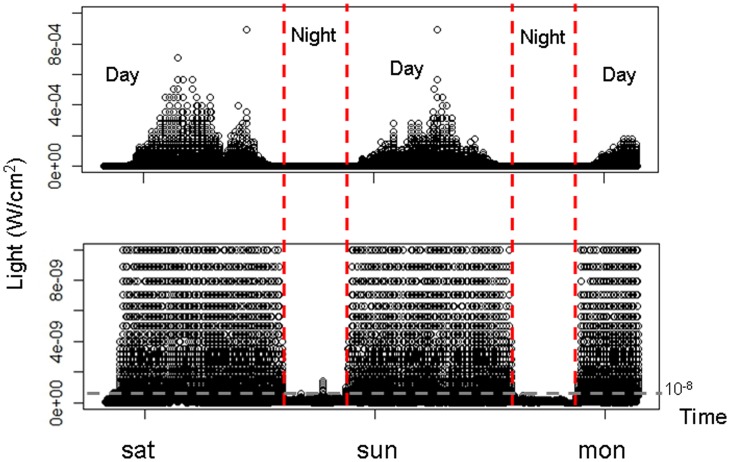
Typically, light levels measured with a sensor show a typical nycthemeral cycle with variations driven by the sun or the moon. In an oceanic environment, the influence of the sun or the moon on recorded light values is strongly dependent on depth (Figure 1A and B). The environment light (i.e. ambient light) reaches nearly constant low values at depths of 550 m during the day and 250 m at night. Therefore, any sudden increase in the ambient light level at depths deeper than these limits corresponds to the occurrence of a bioluminescent event around the SES. We consequently kept bioluminescent events only at depths deeper than the ones aforementioned for analysis. To fit the international metric system, the raw values measured by the sensors were converted into W.cm−2 using the following equation provided by the manufacturer (Wildlife Computers):  where Vt = light value from the sensor and It = light value converted in W.cm−2. Night periods were defined by surface light levels lower than 10−8 W.cm−2 and day periods by a surface light higher than 10−8 W.cm−2 (Figure 2).
Figure 1. Detection of bioluminescence events.
A. An individual time-depth profile zoomed on four consecutive dives. B. Light values associated with dives. C. The method used to detect bioluminescence events. Each point is associated to a light value (I), a depth value (Z) and a time (t). A restricted window (dashed lines) was moved point by point along the light profile. Within a window, the central point corresponded to the I(t) light value. Iambient corresponded to the expected light level when there is no bioluminescence event and was calculated using the two first light values within the window. α(t) corresponded to the ratio between the Iambient and the I(t) light values. The Kt corresponded to the coefficient associated with the decrease of the light following an event.
Figure 2. Separating of day and night periods.
These graphs show light profile during 2 complete days and the beginning to a third. The dotted grey line represents the day and night separation threshold. For a dive, if the surface light is higher than this threshold (10−8 W.cm−2), the dive is considered as a day dive and if the surface light is lower than this threshold, the dive is considered as night dive. The dotted red vertical lines represent the separation between day and night period.
Bioluminescent events were characterized by an abrupt increase followed by a progressive decrease in light levels (Figure 1C). Bioluminescence events were mainly detected and characterized from the abrupt increase phase, rather than from the entire signal (increase and decrease phases). However, the decrease phase was still useful for parameter calculations (see below). A system of running windows over 10 sec (5 data points) with an increment of 2 s (i.e. 1 data point) was used to determine the beginning and the end of bioluminescence events, the end being here the point of highest light intensity (the decreasing phase is omitted) (Figure 1C). The mid-point of the 5-point running window was named time t, with the previous two times t-1 and t-2 and the following two t+1 and t+2respectively. Light data were log transformed for analysis to buffer the wide range of recorded values (10−11 to 10−1 W.cm−2).Three parameters characterized the central point t:
The ambient light, I ambient
A fast increase in light, αt
A slower decrease in light, K.
These 3 parameters were estimated using the qr.solve function of the package base in R as follows:
 |
with It and Iambient in W.cm−2, K in m−1 and Z the depth at time t in m. (Figure 1.)
αt can be estimated from the matrix as follows:
.
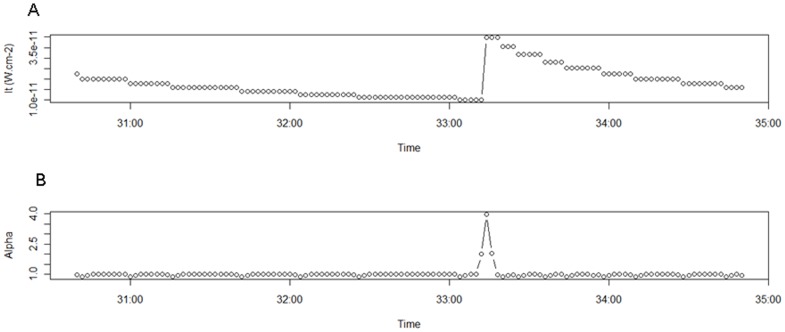
Bioluminescence events started when αt was higher than 1 and lasted as long as it remained above this threshold (Figure 3). Once bioluminescence events were detected, we selected only the significant ones, i.e.events for which the ratio between maximum light into the event and ambient light at the beginning point of the event was higher than 1.26 (sensor resolution). The others were discarded as sensor noise and not included in the analysis. Event intensity was then calculated as the difference between the maximum light and ambient light at the beginning point of the event.
Figure 3. Light profile of a bioluminescence events and the α(t) profile.
A. The light profile of one bioluminescence event. B. The α(t) profile of this bioluminescence event. α(t) is greater 1 during the increasing light phase of a bioluminescence event.
Statistical Analysis
Bioluminescence within the water column
The water column was divided into 100 m-deep layers: six of them at night (from 250–350 to 850–950 m) and 4 of them for the daylight period (from 550–650 to 950–1050 m every 100 m). The relationship between the total number of bioluminescence events per unit of time spent within a depth layer, the depth layer, and the time of the day (day or night) was determined with linear regressions (‘stat’ package in R.2.10.1).
Bioluminescence and foraging intensity
As foraging is usually related to the bottom phase of a dive [40]–[44], only bioluminescence events at the bottom phase of dives were kept in the analyses. The bottom time and the depth of a dive are known to be linked to foraging activity [35]. Both variables were found here to be correlated to the number of bioluminescence events met during dives. In order to account for this, the index of foraging intensity of dives was investigated in relation to the bottom time, the depth and the number of bioluminescence events of dives using generalized linear mixed models at night and day separately (nlme package in R 2.10.1) [45]. Individuals were included as random factors and we accounted for the temporal correlation in our data using an autoregressive variance-covariance matrix (corAR1). The complete GLMMs were built as such:
Indexes of foraging intensity ∼ Bottom time + Depth + Number of bioluminescence event + Bottom Time:Depth + Bottom Time:Number of bioluminescence event + Depth: Number of bioluminescence event, random = ∼ 1|ID, correlation = corAR1 ().
The best models for night and day were selected using stepwise likelihood ratio tests [46].
Bioluminescence and predator movements into the bottom phase
We also investigated the relationship between SES directional movements and bioluminescence. To determine whether bioluminescence events were more likely to be encountered in one direction than another, we analyzed the links between the number of bioluminescence events encountered by SES (and corrected by time), and the direction they followed (i. e. upward, downward and horizontal) using a Wilcoxon test.
Results
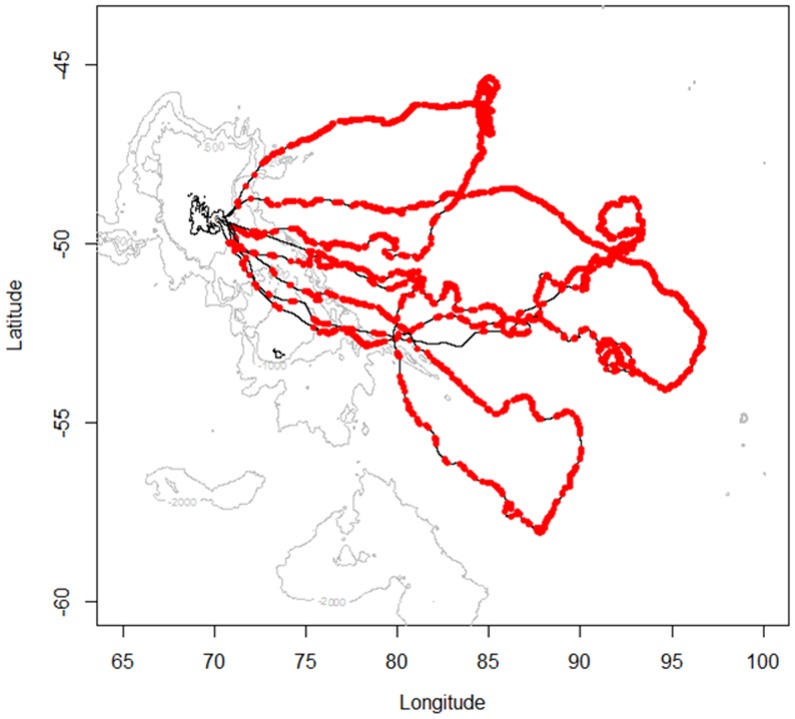
Figure 4 shows the horizontal tracks of the four studied southern elephant seals. These 4 individuals spent on average 65±1 days in oceanic waters for a total foraging trip duration of 75±11 days. Each seal performed on average 71±3 dives per day and 5078±400 dives over the entire foraging trip, 4593±1033 of which in pelagic waters. Bioluminescence events were detectable all along their tracks in the horizontal dimension (Figure 4) and in the vertical dimension (Figure 1A). According to the PCA analysis, indexes of high foraging intensity were characterised by a high ascent rate of the dive and a high descent rate of the following one. On the other hand, indexes of low foraging intensity were characterized by low descent and ascent rates.
Figure 4. Post-breeding foraging trips of 4 female southern elephant seals.
These females were equipped in October 2009 (solid black lines). Isobaths of 500 m, 1000 m and 2000 m deep are illustrated in light grey. Kerguelen island contour is depicted in black line. Red dots correspond to points into dives including at least one significant bioluminescence event (s).
Bioluminescence within the Water Column
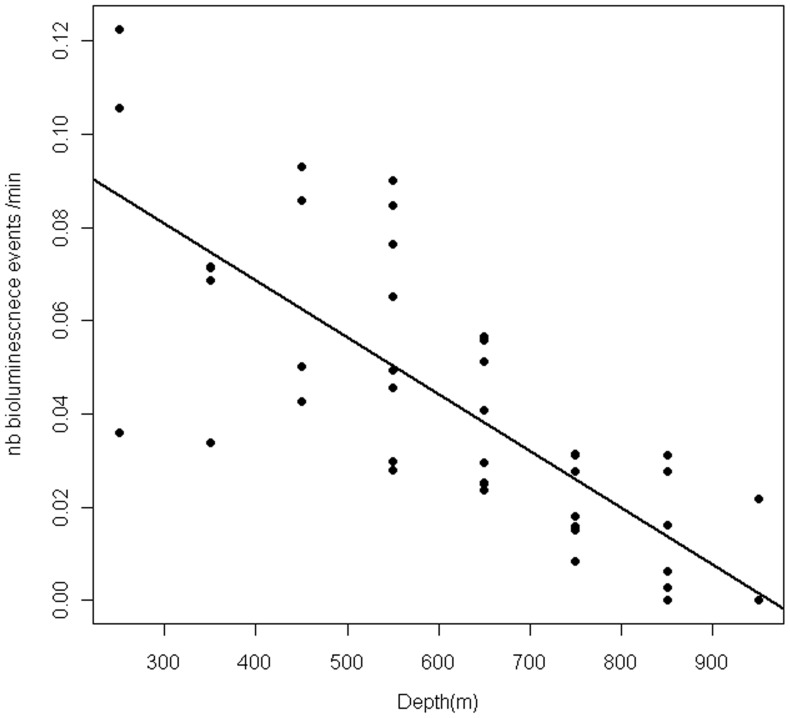
A mean of 1234±407 (n = 4) bioluminescence events were detected in the pelagic phase of a foraging trip. The number of detected bioluminescence events decreased with depth similarly both during day and night (Estimate −0.0003479, t-value = −2.964, p-value = 0.00480). We detected an outlier data point exercising a large leverage effect at night time, however the relationship remained significant after removing this point (Figure 5) (Estimate −1.218e-04; t-value = −8.653 p-value<0.001).
Figure 5. Bioluminescence into the water mass.
The graph represents the distribution of the bioluminescence events according to the depth. The number of events was corrected by the time spent by all the individuals in each depth category. The black line shows the linear regression between the number of bioluminescence events per minute and depth.
Bioluminescence and Foraging Intensity
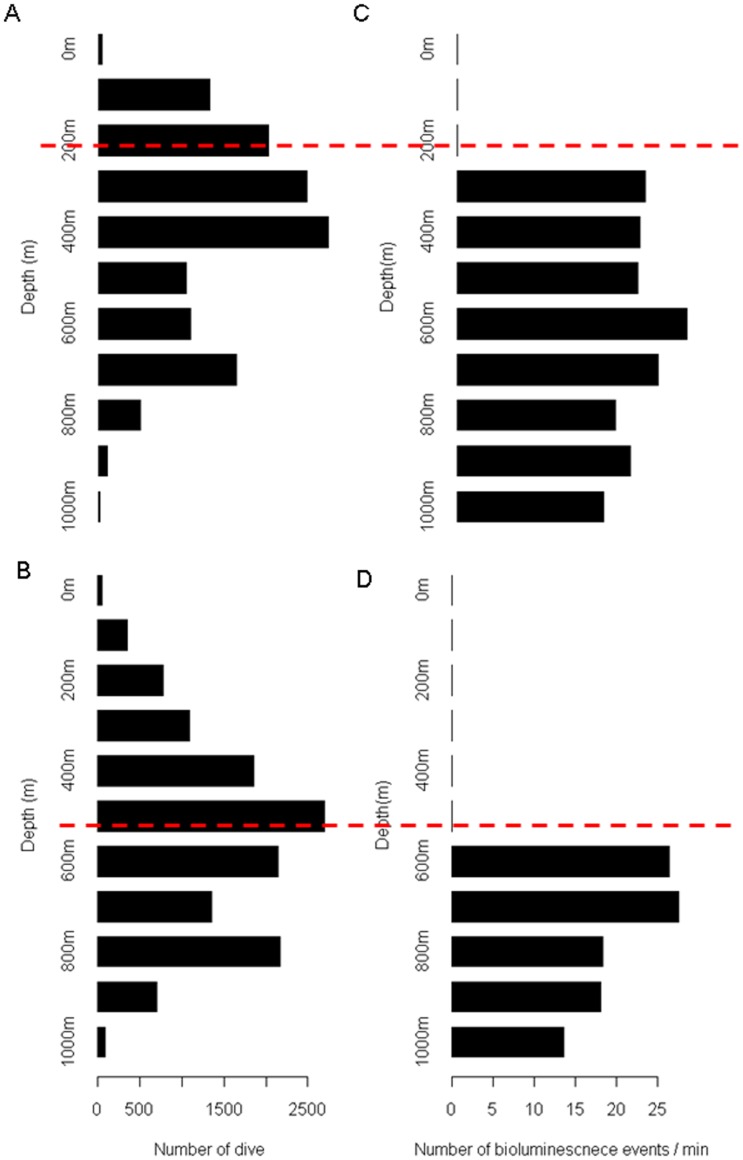
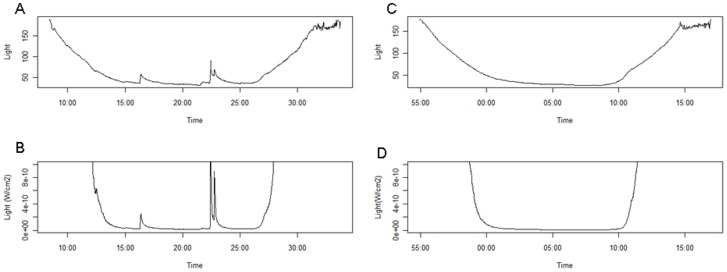
Animals generally dove up to 400 m deep at night and up to 800 m deep during the day. These values corresponded to depths where most of the bioluminescence events were located (Figure 6). On average, each seal performed 4593±1033 dives (n = 4) in pelagic water. Among all pelagic dives performed, a mean 2256±548 dives exceeded the depth threshold set for the detection of bioluminescent events and among them bioluminescence events were detected in 847±246 dives. Therefore a total of 3386 dives were analyzed. The best models in the night and day period showed that the foraging intensity of dives was positively influenced by the number of bioluminescence events met in dives (Figure 7 and Table 1).
Figure 6. Dive depth and the depth of bioluminescence events.
A–B. Histogram of the dives depth at night (A) and during the day (B). C–D. Histogram of the depth of bioluminescence event per minute at night (C) and during the day (D). Events were only detected at night below a threshold of 250 m and during the day below a threshold of 500 m (shown by a dashed red line).
Figure 7. Bioluminescence and foraging intensity.
A–B. A light profile (raw values = A; W/cm2 = B) for a dive with many bioluminescence events and a high foraging index, controlling for depth and bottom time. C–D. A light profile (raw values = C; W/cm2 = D) for a dive without bioluminescence events and a low foraging index, controlling for depth and bottom time.
Table 1. Bioluminescence and index of foraging intensity.
| Night | Day | |||
| Parameters | Estimate | P-value | Estimate | P-value |
| Bottom Time | 1,10E-03 | <0.001 | −8,32E-05 | 0.016 |
| Depth | 2,23E-03 | <0.001 | – | |
| Nb of bioluminescence event | 4,81E-02 | <0.001 | 1,10E-01 | <0.001 |
| Bottom Time:Depth | −1,70E-06 | <0.001 | – | |
| Bottom Time : Nb of bioluminescence event | – | −1,31E-04 | <0.001 | |
| Depth : Nb of bioluminescence event | – | – | ||
Bioluminescence and Predator Movement into the Bottom Phase
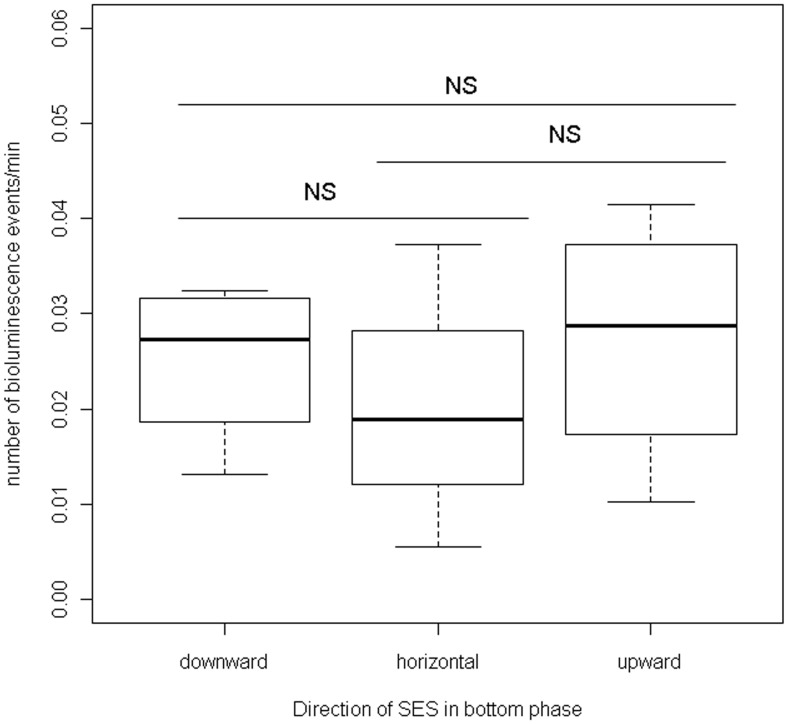
Number of bioluminescence events corrected by time were similar in the downward, horizontal and upward directions (W = 10, p-value = 0.69; W = 11, p-value = 0.49, and W = 6, p-value = 0.69 for comparisons between downward vs horizontal; upward vs horizontal, and upward vs downward respectively) (Figure 8).
Figure 8. Bioluminescence and predator movement into the bottom phase.
This graph represents the number of bioluminescence events encountered in the bottom phase of the dive in a downward, horizontal or upward movement.
Discussion
Bioluminescence emitted by organisms is a widely-spread phenomenon in marine environment. Our study is one of the first to investigate the relationship between a deep-diving predator and some bioluminescent organisms (in a 470–590 nm range) [47]. Although we do not provide any direct evidence of bioluminescence events, the range of light recorded (470–590 nm, i.e. mainly blue light) included in the marine bioluminescence spectrum (400 to 720 nm). In addition, the depths selected for analyses (i.e. while SES were deep diving and when bioluminescence events could not be detected due to surface light) confirm that the light pulses were most likely bioluminescence events [48]–[50].
This study revealed that bioluminescence in a 470–590 nm range is abundant throughout the polar frontal zone. Numerous taxa such as jelly fishes, crustaceans, squids and fishes can emit bioluminescence in the measured range of wavelength [30], [51] which encompassed SES prey as Mycthophids as well as all the lower trophic levels than myctophids such as krill and dinoflagellates species. Even though we could not relate bioluminescence events to specific SES prey for certain, most bioluminescence event intensities recorded ranged from 0.15 10−11 to 0.11 10−6 W.cm−2. As this window encompasses the emission patterns of the main prey of elephant seals, the Myctophids, (i.e. Myctophids photophores: 10−7 W.cm2), [30], it is reasonable to assume that at least one part of bioluminescence events detected were emitted by these prey species. It is even more likely given the large myctophid biomass found in the Southern Ocean south of the 40thS parallel (from 70 to 200 million t) [52]–[54].
Our results show that there is a relationship between this bioluminescence and SES foraging activity as foraging intensity index of seals was positively related to the number of bioluminescence events detected in dive, for both day and night. This suggests that bioluminescence could provide qualitative information of the visited area even though further work is needed to relate bioluminescence to specific oceanographic features. Considering the large possible source of bioluminescence, its occurrence should not be considered as an absolute indicator of SES prey but rather as an index of biological richness of the habitat used by SES. Previous studies have shown, for instance, that species from lower trophic levels have the ability, by producing bioluminescence, to make their predators vulnerable to the attack from higher order predators [30]. Therefore, we argue that SES might also use bioluminescence produced by the lower trophic levels of its own prey (which can be bioluminescent or not) to assess foraging quality of an area.
It is important to note that, seals were also found to exhibit high index of foraging activity in absence of bioluminescence events. It is coherent with the fact that the diet of elephant seals is also composed of non-bioluminescent species [55]–[57]. Thus, while this study focused on the possible role of visual-clues on the foraging behavior of SES females, it is obvious that other sensory systems likely play an important role in prey location. For instance, captive experiments on phocid seals have shown that these animals also use their vibrissaes to detect and locate the vibratory fields produced by fish swimming movements [58]. Highly-developed auditory capacities of elephant seals may also play an important role in locating their prey [59], [60].
Some bioluminescence events may be directly related to the foraging activity of SES, since such events are known to represent a response to an approaching predator such as elephant seals (a light defense) [30]. To avoid predators, some animals use deception or confusion. One deep-sea shrimp is known to spit out bioluminescent slurry to distract attackers [30]. Vampire squids release cloud of bioluminescence to confuse or repel a predator while escaping [61]. Flashlight fish also use the bioluminescent patches under their eyes to help them flee from predators by flashing them off and on while swimming in different directions [30], [62]. Future studies should investigate in greater detail if elephant seals change their tri-dimensional movement patterns in response to these bioluminescence events (i.e. a prey occurrence cues) or prior to the occurrence of these events (i.e. events as a response to an approaching predator).
Our results showed that the number of bioluminescence events decreased with depth both during the day and the night. This trend could be explained by the natural common decrease of biomass with depth [63]. However, contrary to what was expected with the main prey of elephant seals, such as myctophids that display a daily vertical migration pattern, no significant nycthemeral migration was observed. This can be due to the large number of bioluminescent species with different daily ecology and behaviors potentially detected. Our results did not show that seals affected their directionality (downward, horizontal or upward) when approaching a bioluminescence event. This suggests that SES do not use a preferential strategy when faced with bioluminescence, which is consistent with the fact that bioluminescence events can be easily detected from every angle in the total darkness at depth.
It is important to note, however, that light sensors were turned towards the back side of the seals, its detection angle were limited, and measured light only every 2 seconds on a wavelength range limited (470–590 nm). We also only detected bright and fast flashes (related to communication or anti-predatory reaction) rather than glows (counter–illumination behavior). This means that not all bioluminescence events visible to seals were detected and used in our study.
Nevertheless, this study provides important information on the horizontal and vertical distribution of bioluminescent organisms in a 470–590 nm range within the polar frontal zone of the Southern Ocean. It also brings new knowledge and an important baseline regarding the predator-prey interactions through visual cues at depth in the marine environment. While this study it provides essential information, further investigations would be needed to quantitatively relate foraging behavior of elephant seals to bioluminescence. To do so, light sensors with a narrower range of wavelength detection should be paired with accelerometers. This would allow detecting attempt of prey capture at fine scale [64], [65] as well as fine scale SES movement.
Acknowledgments
The authors would like to thank the members of the 59th and the 60th research mission at Kerguelen Island, Jean-Baptiste Pons, Nory El Ksabi, Mathieu Authier and the IPEV logistical staff for their work in the field. Special thanks go also to Pascal Monestiez (INRA Avignon), Kevin Le Rest and David Pinaud (CEBC CNRS) for their helpful advice at the different stages of the manuscript. Finally authors also thank Tiphaine Jeanniard Du Dot and Samantha Patrick for the English support.
Funding Statement
This study is part of the national research program (no. 109, H. Weimerskirch and the observatory Mammifères Explorateurs du Milieu Océanique, MEMO SOERE CTD 02) supported by the French Polar Institute (Institut Paul Emile Victor, IPEV) and the Territoire des Terres Australes et Antarctiques Françaises (TAAF). This work was carried out in the framework of IPSOS-SEAL (ANR VMC 07), TOPP-PATCHES and CNES-TOSCA programs. This work is supported by the Total Foundation. The funders had no role in study design, data collection and analysis, decision to publish, or preparation of the manuscript.
References
- 1. Berryman AA (1992) Origins and evolution of predator-prey theory. Ecology 73: 1530–1535. [Google Scholar]
- 2. Fauchald P (1999) Foraging in a Hierarchical Patch System. The American Naturalist 153: 603–613. [Google Scholar]
- 3.Pielou EC (1969) An Introduction to Mathematical Ecology. John Wiley & Sons, New York.
- 4. Cézilly F, Benhamou S (1996) Les stratégies optimales d'approvisonnement. Revue d'Ecologie (Terre Vie) 51: 43–86. [Google Scholar]
- 5. Oaten A (1977) Optimal foraging in patches: a case for stochasticity. Theoretical Population Biology 12: 263–285. [DOI] [PubMed] [Google Scholar]
- 6. McNamara JM (1982) Optimal patch use in a stochastic environment. Theoretical Population Biology 21: 269–288. [Google Scholar]
- 7. Lea M A, Dubroca L (2003) Fine-scale linkages between diving behaviour of Antarctic fur seals and oceanographic features in the southern Indian Ocean. ICES Journal of Marine Science 60: 1–13. [Google Scholar]
- 8. Cotté C (2007) Movements of foraging king penguins through marine mesoscale eddies. Proceedings of the Royal Society B 274: 2385–2391. [DOI] [PMC free article] [PubMed] [Google Scholar]
- 9. Bailleul F, Cotté C, Guinet C (2010b.) Mesoscale eddies as foraging areas of a deep-diving predator, the southern elephant seal. Marine Ecology Progress Series 408: 251–264. [Google Scholar]
- 10. Bowen WD, Tully D, Boness DJ, Bulheier BM, Marshall GJ (2002) Prey-dependent foraging tactics and prey profitability in a marine mammal. Marine Ecology-Process Series 244: 235–245. [Google Scholar]
- 11. Hooker SK, Boyd IL, Jessopp M, Cox O, Blackwell J, et al. (2002) Monitoring the prey-field of marine predators: combining digital imaging with datalogging tags. Mar Mamm Sci 18: 680–697. [Google Scholar]
- 12. Culik B, Hennicke J, Martin T (2000) Humboldt penguins outmanoeuvring el Niño. The Journal of Experimental Biology 203: 2311–2322. [DOI] [PubMed] [Google Scholar]
- 13. Culik B (2001) Finding food in the open ocean: foraging strategies in Humboldt penguins. Zoology 104: 327–338. [DOI] [PubMed] [Google Scholar]
- 14. Watwood SL, Miller PJO, Johnson M, Madsen PT, Tyack PL (2006) Deep-diving foraging behaviour of sperm whales (Physeter macrocephalus). Journal of Animal Ecology 75: 814–825. [DOI] [PubMed] [Google Scholar]
- 15. White CR, Day N, Butlser PJ, Martin GR (2007) Vision and Foraging in Cormorants: More like Herons than Hawks? PlosOne 2: e639 (DOI: 10.1371/journal.pone.0000639).. [DOI] [PMC free article] [PubMed] [Google Scholar]
- 16. Martin GR (1999) Eye structure and foraging in King Penguins Aptenodytes patagonicus. . Ibis 141: 444–450. [Google Scholar]
- 17. Schusterman RJ, Kastak D, Levenson DH, Reichmuth CJ, Southall BL (2000) Why pinnipeds don’t echolocate. J. Acoust. Soc. Am. 107: 2256–2264. [DOI] [PubMed] [Google Scholar]
- 18. Lythgoe JN, Dartnall HJA (1970) A deep Sea “Rhodopsin” in a Mammal. Nature 227: 955–956. [DOI] [PubMed] [Google Scholar]
- 19. Levenson DH, Schusterman RJ (1997) Pupillometry in seals and sea lions: ecological implication. Can J Zool 75: 2050–2057. [Google Scholar]
- 20. Levenson DH, Schusterman RJ (1999) Dark adaptation and visual sensitivity in shallow and deep diving pinnipeds. Mar Mam Sci 15: 1303–1313. [Google Scholar]
- 21. McConnell BJ, Chambers C, Fedak MA (1992) Foraging ecology of southern elephant seals in relation to the bathymetry and productivity of the Southern Ocean. Antarctic Science 4: 393–398. [Google Scholar]
- 22. Biuw M (2007) Variations in behavior and condition of a Southern Ocean top predator in relation to in situ oceanographic conditions. Proceedings of the National Academy of Science 104: 13705–13710. [DOI] [PMC free article] [PubMed] [Google Scholar]
- 23. Cherel Y, Ducatez S, Fontaine C, Richard P, Guinet C (2008) You are what you eat: stable isotopes document the trophic position and feeding habits of southern elephant seals. Mar. Ecol. Prog. Ser. 370: 239–247. [Google Scholar]
- 24. Bailleul F, Authier M, Ducatez S, Roquet F, Charrassin J-B, et al. (2010a.) Looking at the unseen: combining bio–logging and stable isotopes to reveal a shift in the ecological niche of a deep–diving predator. Ecography 33: 709–719. [Google Scholar]
- 25. Slip DJ (1995) The diet of southern elephant seals (Mirounga leonina) from Heard Island. Canadian Journal of Zoology 73: 1519–1528. [Google Scholar]
- 26. Daneri GA, Carlini AR (2002) Fish prey of southern elephant seals, Mirounga leonina, at King George Island. Polar Biol 25: 739–743. [Google Scholar]
- 27. Pakhomov EA, Perissinotto R, McQuaid CD (1994) Comparative structure of the macrozooplankton/micronekton communities of the Subtropical and Antarctic Polar fronts. Mar Ecol Prog Ser. 111: 155–169. [Google Scholar]
- 28. Young RE, Mencher FM (1980) Bioluminescence in mesopelagic squids: Diel color change during counterillumination Science. 208: 1286–88. [DOI] [PubMed] [Google Scholar]
- 29. Herring PJ, Widder EA, Haddock SHD (1992) Correlation of bioluminescence emissions with ventral photophores in the mesopelagic squid Abralia veranyi (Cephalopoda: Enoploteuthidae) Mar. Biol. 112: 293–98. [Google Scholar]
- 30. Haddock SHD, Moline MA, Case JF (2010) Bioluminescence in the Sea Annual Review of Marine Science. 2: 443–493. [DOI] [PubMed] [Google Scholar]
- 31. Turner JR, White EM, Collins MA, Partridge JC, Douglas RH (2009) Vision in lanternfish (Myctophidae): adaptations for viewing bioluminescence in the deep-sea Deep-Sea Research I. 56: 1003–1017. [Google Scholar]
- 32. Authier M, Martin C, Ponchon A, Steelandt S, Bentaleb I, et al. (2011) Breaking the Sticks: a Hierarchical Change-Point Model for Estimating Ontogenetic Shifts with Stable Isotope Data. Methods in Ecology and Evolution 3: 281–290. [Google Scholar]
- 33. McMahon CR, Burton HR, McLean S, Slip DJ, Bester MN (2000) Field immobilisation of southern elephant seals with intavenous tiletamine and zolazepam. Veterinary Record 146: 251–254. [DOI] [PubMed] [Google Scholar]
- 34. Field IC, Bradshaw CJA, McMahon CR, Harrington J, Burton HR (2002) Effects of age, size and condition of elephant seals (Mirounga leonina) on their intravenous anaesthesia with tiletamine and zolazepam. Veterinary Records 151: 235–240. [DOI] [PubMed] [Google Scholar]
- 35. Dragon AC, Bar-Hen A, Monestiez P, Guinet C (2012) Horizontal Area-Restricted-Search and Vertical Diving Movements to Predict Foraging Success in a Marine Top-Predator. Marine Ecology Progress Series 447: 243–257. [Google Scholar]
- 36. Thompson D, Hiby AR, Fedak MA (1993) How fast should I swim? Behavioural implications of diving physiology. Symposia of the Zoological Society of London 66: 349–368. [Google Scholar]
- 37. Ropert-Coudert Y, Kato A, Baudat J, Bost CA, Le Maho Y, et al. (2001) Time/depth usage of Adelie penguins: an approach based on dive angles. Polar Biol 24: 467–470. [Google Scholar]
- 38. Ropert-Coudert Y, Kato A, Wilson RP, Cannell B (2006) Foraging strategies and prey encounter rate of free-ranging Little Penguins. Marine Biology 149: 139–148. [Google Scholar]
- 39.Viviant M (2011) Optimisation du comportement d’acquisition des ressources au cours de la plongée : Cas de l’otarie a fourrure antarctique. Université Pierre et Marie Currie PhD thesis.
- 40. Wilson RP, Steinfurth A, Ropert-Coudert Y, Kato A, Kurita M (2002) Lip-reading in remote subjects: an attempt to quantify and separate ingestion, breathing and vocalisation in free-living animals using penguins as a model. Marine Biology 140: 17–27. [Google Scholar]
- 41. Watanabe Y, Mitani Y, Sato K, Cameron MF, Naito Y (2003) Dive depths of Weddell seals in relation to vertical prey distribution as estimated by image data. Marine Ecology Progress Series 252: 283–288. [Google Scholar]
- 42. Austin D, Bowen WD, McMillan JI, Boness DJ (2006) Stomach temperature telemetry reveals temporal patterns of foraging success in a free-ranging marine mammal.Journal of Animal Ecology. 75: 408–420. [DOI] [PubMed] [Google Scholar]
- 43. Fossette S, Gaspar P, Handrich Y, Le Maho Y, Georges JY (2008) Dive and beak movement patterns in leatherback turtles Dermochelys coriacea during internesting intervals in French Guiana. Journal of Animal Ecology 77: 236–246. [DOI] [PubMed] [Google Scholar]
- 44. Kuhn CE, Crocker DE, Tremblay Y, Costa DP (2009) Time to eat: measurements of feeding behaviour in a large marine predator, the northern elephant seal Mirounga angustirostris. Journal of Animal Ecology 78: 513–523. [DOI] [PubMed] [Google Scholar]
- 45.R Development Core Team (2010) R: a language and environment for statistical computing. R Foundation for Statistical Computing, Vienna, Austria. ISBN 3-900051-07-0. Available: http://www.R-project.org. Accessed June 2010.
- 46.Zuur AF, Ieno EN, Walker NJ, Saveliev AA, Smith GM (2009) Mixed Effects Models and Extensions in Ecology with R. Springer, New-York. R.
- 47. Campagna C, Dignani J, Blackwell SB, Marin MR (2001) Detecting bioluminescence with an irradiance time-depth recorder deployed on Southern elephant seals. Marine Mammal Science 17: 402–414. [Google Scholar]
- 48. Mackie GO (1991) Propagation of bioluminescence in Euphysa-Japonica hydromedusae (Tubulariidae). Hydrobiologia 216: 581–588. [Google Scholar]
- 49. Dewael Y, Mallafet J (2002) Luminescence in ophiuroids (Echinodermata) does not share a common nervous control in all species. The journal of Experimental Biology 205: 799–806. [DOI] [PubMed] [Google Scholar]
- 50. Mackie GO (2004) Epithelial conduction: recent findings, old questions and where do we go from here? Hydrobiologia 530: 73–90. [Google Scholar]
- 51. Widder EA (2010) Bioluminescence in the Ocean: Origins of Biological, Chemical, and Ecological Diversity. Science 328: 704–708. [DOI] [PubMed] [Google Scholar]
- 52.Lubimova TG, Shust KV, Popkov VV (1987) Specific features in the ecology of Southern Ocean mesopelagic fish of the family myctophidae. Biological resources of the Arctic and Antarctic Nauka Press, Moscow, p 320–337.
- 53. Tseitlin VB (1982) Evaluation of biomass and production of mcsopelagic fish in the World Ocean. Rep Soviet Union Acad Scl 264: 1018–1021. [Google Scholar]
- 54. Lancraft TM, Torres JJ, Hopkins TL (1989) Micronekton and macrozooplankton in the open waters near Antarctic ice edge zones. Polar Biol 9: 225–233. [Google Scholar]
- 55. Rodhouse PG, Arnbom TR, Fedak MA, Yeatman J, Murray AWA (1992) Cephalopod prey of the southern elephant seal, Mirounga leonina L. Can J Zool. 70: 1007–1015. [Google Scholar]
- 56. Slip DJ (1995) The diet of southern elephant seals (Mirounga leonina) from Heard Island. Canadian Journal of Zoology 73: 1519–1528. [Google Scholar]
- 57. Bost CA (2002) Zorn T, Le Maho Y, Duhamel G (2002) Feeding of diving predators and diel vertical migration of prey: King penguin ‘diet versus trawl sampling at Kerguelen islands. Marine Ecology Progress Series 227: 51–62. [Google Scholar]
- 58. Schulte-Pelkum N, Wieskotten S, Hanke W, Dehnhardt G, Mauck B (2007) Tracking of biogenic hydrodynamic trails in harbour seals (Phoca vitulina). The Journal of Experimental Biology 210: 781–787. [DOI] [PubMed] [Google Scholar]
- 59. Kastak D, Schusterman RJ (1998) Low-frequency amphibious hearing in pinnipeds: Methods, measurements, noise, and ecology. Acoustical Society of America 103: 2216–2228. [DOI] [PubMed] [Google Scholar]
- 60. Kastak D, Schusterman RJ (1998) In-air and underwater hearing sensitivity of a northern elephant seal (Mirounga angustirostris). Can. J. Zool. 77: 1751–1758. [Google Scholar]
- 61. Robison BH, Reisenbichler KR, Hunt JC, Haddock SHD (2003) Light production by the arm tips of the deep-sea cephalopod Vampyroteuthis infernalis. Biol. Bull. 205: 102–109. [DOI] [PubMed] [Google Scholar]
- 62. Morin JG, Harrington A, Nealson K, Krieger N, Baldwin TO, et al. (1975) Light for all reasons: Versatility in the behavioral repertoire of the flashlight fish. Science 190: 74–76. [Google Scholar]
- 63. Williams A, Koslow JA (1999) Species composition, biomass and vertical distribution of micronekton over the mid-slope region off southern Tasmania, Australia. Marine Biology 130: 259–276. [Google Scholar]
- 64. Suzuki I, Naito Y, Folkow LP, Miyazaki N, Blix AS (2009) Validation of a device for accurate timing of feeding events in marine animals. Polar Biol 32: 667–671. [Google Scholar]
- 65. Viviant M, Trites A, Rosen D, Monestiez P, Guinet C (2010) A new method to detect prey catch attempt in pinnipeds using accelerometers. Polar Biol 33: 713–719. [Google Scholar]


