

Abstract
Discovery and validation of plasma biomarkers are quite challenging due to the high complexity and wide dynamic range of the plasma proteome. Current plasma protein profiling strategies usually use major protein immunodepletion and nanoLC-MS/MS as the first and final analytical steps, respectively, but additional fractionation is needed to detect and quantify low-abundant disease biomarkers. In this study, the performance of 1-D SDS-PAGE, peptide isoelectrofocusing, and peptide high pH reverse-phase chromatography for fractionation of immunodepleted human plasma were systematically compared by evaluating protein coverage, peptide resolution, and capacity to detect known low-abundant proteins. Trade-offs between increasing the number of fractions to improve proteome coverage and resulting decreases in throughput also were assessed. High pH reverse-phase HPLC exhibited the highest peptide resolution and yielded the best depth of analysis with detection of the largest number of known low-abundant proteins for a given level of fractionation. Another advantage of using high pH reverse-phase fractionation rather than 1-D SDS gels is that all fractionation steps except for abundant protein depletion occur at the peptide level, making this strategy more compatible with quantitative biomarker validation methods such as stable isotope dilution multiple reaction monitoring.
Keywords: plasma proteome, proteome fractionation, protein profiling, biomarkers, human plasma, biomarker discovery, biomarker validation
Introduction
Protein biomarkers are highly desired for early detection, accurate diagnosis, and prognosis of human diseases such as cancer, as well as for monitoring clinical interventions.1 Human plasma (or serum) is a particularly desirable biological fluid for disease biomarker discovery because blood is routinely collected in the clinic, collection is minimally invasive, and established clinical assays are relatively inexpensive. Proteins and metabolites in the blood are thought to be shed by most cells in the body, and changes in the levels of these proteins and metabolites have been hypothesized to potentially reflect most physical conditions.2, 3 Thus, human plasma is a potential treasure-trove of candidate biomarkers that might indicate the onset and progression of most disease states. However, mass spectrometry (MS)-based proteomics analyses of plasma for disease-associated biomarker discovery and validation is extremely challenging due to plasma’s great complexity and wide dynamic range of plasma protein concentrations that span more than 10 orders of magnitude.2 Specifically, the plasma proteome is dominated by a handful of proteins in the mg/mL range and the 20 most-abundant plasma proteins constitute 99% of the total protein mass in plasma.2 But, most disease biomarkers are predicted to be present at low-abundant levels, particularly proteins such as cancer biomarkers that are relatively specifically associated with the tumor. For example, prostate-specific antigen (PSA), carcinoembryonic antigen (CEA), CA125, and other relatively specific known cancer biomarkers are typically present in serum and plasma in the low ng/mL to pg/mL range.2–4 Hence, low-abundant disease biomarkers are often either masked by the abundant proteins or are below detection limits of MS instruments because the abundant proteins limit the volume of plasma that can be injected and analyzed. Therefore, detection of low-abundant proteins requires fractionation strategies that reduce sample complexity and increase the volume of original plasma that analyzed fractions represent. Of course, protein recoveries must remain high and relatively reproducible.
The strategies most commonly employed are to immunodeplete the major plasma proteins and subject the remaining proteome to additional protein- and/or peptide-level fractionation steps prior to nanoLC-MS/MS.5–8 Sequential separation steps should exploit orthogonal physicochemical properties of proteins or peptides. SDS-PAGE and strong cation exchange (SCX) are highly orthogonal to immunodepletion, and reverse-phase nanoLC-MS/MS and have been widely used for intermediate protein and peptide fractionation, respectively. Recently, peptide OFFGEL electrophoresis and high pH RP-HPLC (hpRP-HPLC) have gained attention and showed good performance in terms of separation efficiency and identifications of protein and peptide.9–17 Binary or higher dimensional comparisons of different fractionation approaches prior to LC-MS/MS have been studied by several research groups using samples with different complexities. Peptide OFFGEL electrophoresis has found to be comparable to online SCX separations using low- or medium-complexity samples,18, 19 and appears to outperform offline SCX20 and SDS-PAGE21 fractionation methods for complex samples. Recently, two independent systematic fractionation comparison studies showed SDS-PAGE was superior to OFFGEL electrophoresis or offline SCX in terms of protein and peptide identifications using honey bee lysates or lung cancer secretomes.22, 23 hpRP-HPLC exploits the same peptide properties (hydrophobicity) as low pH RP-HPLC, thus it seems less orthogonal to low pH RP-HPLC compared with SDS-PAGE, OFFGEL electrophoresis, and SCX. However, it is worth noting that hpRP-HPLC outperformed OFFGEL electrophoresis,19 SCX,19, 24–26 and SDS-PAGE25 based on the total number of proteins identified using low- or medium-complexity samples. Taken together, the above studies indicated that 1-D SDS-PAGE, OFFGEL electrophoresis, and hpRP-HPLC are among the highest performance proteome fractionation methods, as at least several studies showed each of these methods yielded the best depth of analysis in specific studies using low- or medium-complexity samples. However, to our knowledge, a side-by-side comparison of these three fractionation methods using a highly complex sample such as human plasma has not been reported.
We previously used a 3-D plasma/serum fractionation strategy for ectopic pregnancy biomarker discovery and verification that combined immunodepletion of 20 abundant proteins, SDS-PAGE, and LC-MS/MS with label-free peptide quantitation.27–29 SDS-PAGE as the second plasma fractionation step provides reasonably reproducible separations and, importantly, can distinguish molecular weight changes in a given protein that may be clinically important for some biomarkers.28 This same method was used for initial small-scale validation of ectopic pregnancy and ovarian cancer biomarkers using multiple reaction monitoring (MRM) with label-free quantitation. 27–29 However, this 3-D strategy with SDS-PAGE as the middle step is not very compatible with stable isotope dilution MRM quantitation or with other peptide-level, stable-isotope-label-based quantitative strategies. Another limitation of the 3-D MRM analysis using 1-D SDS gels as the middle step is that proteins to be quantitated are usually spread over at least three to four fractions and slight gel-to-gel variations in protein migration further increase the number of gel slices that must be analyzed in order to ensure that the proteins of interest are fully quantitated. This spread of peptides to be quantitated among multiple fractions reduces peptide signal intensity, making the peptide harder to detect and quantify, and reduces sample throughput.
In this study, we systematically compared 1-D SDS-PAGE, OFFGEL electrophoresis and hpRP-HPLC as the middle step in 3-D plasma proteome profiling. One goal was to identify a peptide-based method that could be better integrated with stable isotope dilution MRM assays and would have at least a similar depth of analysis to 1-D SDS PAGE. In addition, a peptide-based fractionation method that might prove to be superior to 1-D SDS PAGE for plasma proteome profiling would provide an alternative 3-D strategy for initial plasma biomarker discovery. We selected peptide OFFGEL electrophoresis and peptide hpRP-HPLC as the best peptide fractionation methods for comparison to 1-D SDS gels based on their high performance on less complex samples, as summarized above. Surprisingly, the results show that hpRP-HPLC of depleted plasma tryptic peptides is more efficient at in-depth analysis than either 1-D SDS gels or peptide OFFGEL electrophoresis.
Materials and Methods
Reagents
LC-MS grade formic acid, 200 proof molecular biology grade ethanol, ammonium bicarbonate (ABC), and N,N-Dimethylacrylamide (DMA) were purchased from Sigma-Aldrich (St. Louis, MO). Sodium dodecyl sulfate (SDS) and Tris were purchased from Bio-Rad (Hercules, CA). Dithiothreitol (DTT) was purchased from GE Healthcare (Piscataway, NJ). HPLC grade acetonitrile was obtained from Thomas Scientific (Swedesboro, NJ). Sequencing grade modified trypsin was purchased from Promega (Madison, WI).
Proteo Prep20 Depletion
The most abundant 20 proteins were depleted from human plasma using a ProteoPrep20 Immunodepletion Column (Sigma-Aldrich) on an AKTA fast performance liquid chromatography system (FPLC; GE Healthcare). Briefly, 100 μL of plasma was diluted to 500 μL with PBS and filtered through a 0.22 μm microcentrifuge filter, injected onto the column, and depleted using the manufacturer’s recommended protocols and buffers. For systematic comparisons of different conditions with an identical sample, the flow-through fractions containing unbound proteins from 800 μL plasma were pooled and divided into eight aliquots, then each aliquot was precipitated with nine volumes of prechilled 200 proof ethanol (−20 °C). Ethanol supernatants were carefully removed, protein pellets were dried to remove residual solvent, and pellets were frozen and stored at −20 °C until further use. A representative gel of the “Top 20” protein depletion is shown in Supplemental Figure 1.
SDS-PAGE/In-Gel Trypsin Digestion
SDS-PAGE and in-gel trypsin digestion were carried out as described previously with minor modifications.8 Briefly, frozen protein pellets from ethanol precipitation of depleted plasma were thawed and resuspended in 50 mM Tris-HCl, 1% SDS, pH 8.5. Samples were reduced with 20 mM DTT for 1 h at 37 °C and alkylated with 60 mM DMA in 50 mM Tris-HCl, pH 8.5 for 1 h at 37 °C. Alkylation was quenched with 50 mM DTT for 15 min at 37 °C. Following in-solution reduction and alkylation, samples were prepared for PAGE by the addition of SDS sample buffer. Sample equivalent to 10 μL original plasma was loaded per lane using 10-well, 12% NuPAGE mini-gels (Invitrogen, Carlsbad, CA) and MES running buffer. Gels were electrophoresed until the tracking dye had migrated 1.0, 2.0, or 4.0 cm, stained with Colloidal Blue (Invitrogen), and a 4-mm-wide strip from the center of each lane was subsequently sliced into 10, 20, or 40 uniform 1-mm slices using a custom razor-blade array. Corresponding slices from three replicate lanes were combined in single wells of a 96-well pierced plate (Biomachines, Inc., Carrboro, NC). Gel slices were digested overnight using 0.02 μg/μL modified trypsin. Following digestion, samples were frozen and stored at −20 °C.
In-Solution Trypsin Digestion
Frozen protein pellets from ethanol precipitation of depleted plasma were thawed briefly and resuspended in 100 mM ammonium biocarbonate, 8 M urea buffer, pH 8.5, reduced with 5.7 mM TCEP for 1 hour at 37 °C and alkylated with 25 mM DMA for 1 hour at 37 °C. Alkylation was quenched with 30 mM cysteine for 15 min at 37 °C. A two-step proteolytic digestion was performed. First, sample was diluted with 25 mM ammonium bicarbonate to 4 M urea, digested with trypsin (enzyme/protein: 1/100) for 4 hours at 37 °C, then diluted with 25 mM ammonium bicarbonate to 2M urea and digested with trypsin (enzyme/protein: 1/50) overnight at 37 °C. Proteolysis was stopped by adding 10% formic acid to a final pH ~3, and the sample was desalted using a Sep-Pak C18 cartridge (Waters Inc., Milford, MA).
Peptide Fractionation Methods
OFFGEL Separation
Thirty microliters of depleted plasma tryptic digests were separated using an Agilent 3100 OFFGEL Fractionator (Agilent, Santa Clara, CA). Both the OFFGEL Low and High Res Kit, pH 3–10 (Agilent) were used. The low-resolution 12-well separations were focused for 20kV h and high-resolution 24-well separations were focused for 50 kV h, with a maximum current of 50 μA and power of 200 mW. Fractions were acidified by adding 10% formic acid to a final pH ~3 and purified by solid phase exchange with UltraMicroSpin columns (The Nest Group, Inc., Southborough, MA). Fractions were dried in a SpeedVac, followed by resuspension of each fraction in 160 μL (for 12-well separations) or 80 μL (for 24-well separations) of 0.1% formic acid.
hpRP-HPLC
Tryptic digests of depleted plasma were injected into a 2.1×250 mm XBridge BEH300 C18 column (Waters) with a 2.1×10 mm XBridge C18 guard column (Waters) connected to an Agilent 1100 HPLC system. Solvent A was 20 mM ammonia, pH 10.7, and solvent B was 20 mM ammonia in 80% acetonitrile; a flow rate of 200 μL/min was used throughout the separation. Sample loading was performed using 3% B for 8 min followed by a linear gradient from 3% to 88% B over 63 min and a 15 min hold at 88% B prior to reequilibration at 3% B. The peptide elution profile was monitored using UV absorbance at 215 nm, and fractions were collected every minute, resulting in 83 initial fractions. These 83 fractions were then pooled into 12, 20, and 40 fractions, as described in Supplemental Table 1, such that most fractions had similar UV absorbance. Pooled fractions were dried in a SpeedVac, followed by resuspension of each fraction in 80 μL (for 15 μL tryptic digests separated into 12 fractions) or 40 μL (for 30 μL tryptic digests separated into 40 fractions) of 0.1% formic acid.
LC-MS/MS
Trypsin digestions were loaded into a UPLC Symmetry trap column (180 μm i.d. × 2 cm packed with 5 μm C18 resin; Waters) with solvent A, which was Milli-Q (Millipore, Billerica, MA) water containing 0.1% formic acid, and separated by nanoRP-HPLC on a BEH C18 nanocapillary analytical column (75 μm i.d. × 25 cm, 3 μm particle size; Waters) interfaced with a LTQ-Orbitrap XL mass spectrometer (Thermo Fisher Scientific, Waltham, MA). Solvent B was 0.1% formic acid in ACN. Peptides were eluted at 200 nL/min using the following gradient conditions: 5 to 28% B over 42 min, 28 to 50% B over 25.5 min, 50 to 80% B over 5 min, and hold at 80% B for 5 min prior to reequilibration at 5% B. To minimize carryover, a 30-min blank with a 2 μL buffer A injection was run between each sample. The mass spectrometer was set to scan m/z from 400 to 2,000. The full MS scan was collected at 60,000 resolution in the Orbitrap in profile mode followed by data-dependent MS/MS scans in the linear trap on the six most abundant ions exceeding a minimum threshold of 1,000. Monoisotopic precursor selection was enabled and charge-state screening was enabled to reject z = 1 ions. Ions subjected to MS/MS were excluded from repeated analysis for 45 s. The volumes of fractions injected were adjusted to consistently inject approximately 0.5 μg or less of tryptic peptides, where peptide concentrations were estimated by assuming quantitative recovery and equal distribution of protein or peptides among all fractions.
Data Processing
MS/MS spectra were extracted and searched using the SEQUEST algorithm in BioWorks (version 3.3, Thermo Fisher Scientific) against the human UniRef 100 protein database (November 2007, the Protein Information Resource at Georgetown University, Washington, DC) combined with a reverse database and a list of common contaminants (trypsin, keratins, etc.). The reverse database was generated by reversing the protein amino acid sequence for each database entry and the entire reversed database was appended in front of the original forward sequences. Database search and results filtering strategies that we previously optimized for complex proteomes such as human tumor secretomes and human serum were used in this study.30 Specifically, MS/MS spectra were searched using partial trypsin specificity with up to two missed cleavages, a 100 ppm precursor mass tolerance, 1 amu fragment ion mass tolerance, static modification of cys (DMA derivative, +99.06840), and variable modifications for methionine oxidation (+15.9949) and asparagine deamidation (+0.9840). Consensus protein lists were generated by DTASelect (version 2.0, licensed from Scripps Research Institute, La Jolla, CA) using the following data filter: full tryptic boundaries, 10 ppm, ΔCn ≥ 0.05. For each proteome, the FDR was estimated from the ratio of the decoy database peptide or protein counts to forward database peptide or protein counts, expressed as a percentage. Peptide counts for FDR calculation were taken directly from the DTASelect results which counted different charge states and variable modifications as separate peptides. Unique peptide or protein counts were obtained using custom software which collapsed different charge states and variable modifications of methionine oxidation and asparagine deamidation of a unique sequence into a single peptide count. The software also limited assignment of each unique peptide sequence to a single protein in the final assembled protein list as previously described.30 As previously shown, this data analysis strategy was superior to older data filtering methods that typically utilized Xcorr values because higher numbers of unique peptides and proteins could be identified while maintaining low FDR.30 As shown in Supplemental Table 2, FDR for all peptides were less than 3% for all datasets using non-redundant peptide counts and FDR for proteins identified by two or more peptides were less than 1%. Because FDR for proteins identified by one or more peptides were much higher (Supplemental Table 2), proteins identified by a single peptide were separately represented in data summaries and were not emphasized when comparing methods. To identify common and unique proteins found by different fractionation methods, protein and peptide data were placed in a relational database (MySQL) and matched using custom software.
Results and Discussion
Prior to directly comparing the different fractionation methods, a series of experiments were performed to optimize separation parameters for the peptide OFFGEL electrophoresis and hpRP-HPLC separations using immunodepleted human plasma (data not shown). The optimized separation strategies developed from these pilot experiments are described in “Materials and Methods” and were used for all subsequent experiments, as described below. The scheme used to systematically compare 1-D SDS PAGE, peptide hpRP-HPLC, and peptide OFFGEL electrophoresis is shown in Figure 1. Replicate aliquots of a single pool of depleted plasma were used for these experiments. In parallel with comparing the methods with each other, the effects of using different numbers of fractions for each method also were assessed, as summarized below.
Figure 1.

Strategy used to systematically compare SDS-PAGE, OFFGEL electrophoresis, and hpRP-HPLC as alternatives for the middle step in a 3-D plasma proteome workflow.
Effects of Gel Separation Distance and Number of Fractions on Depth of Analysis
Our prior studies showed that the optimal loading amount in 1 mm thick mini-gels was the depleted fraction from approximately 10 μL of plasma, because heavier protein loads sometimes caused visible band distortion with resulting decreased resolution. When depleted plasma from normal donors was reconstituted to the original plasma volume, the protein concentration was typically approximately 3 μg/μL, which corresponded to a total protein load per gel lane of approximately 30 μg. In order to independently evaluate the effects of both separation length and number of fractions, replicate depleted plasma samples were electrophoresed for 1.0, 2.0, and 4.0 cm resulting in 10, 20, and 40 1-mm gel slices, respectively. These gel slices were individually digested and then fractions were analyzed by LC-MS/MS, either individually or after pooling adjacent fractions as follows: from the 1-cm gel, five fractions were prepared by pooling digests 1–2, 3–4, etc.; from the 2-cm gel, the 20 fractions were analyzed individually and five fractions were prepared using one third of each digest with pooling of digests 1–4, 5–8, etc.; and from the 4-cm gel, the 40 fractions were analyzed individually and 20 fractions were prepared using one third of each digest with pooling of digests 1–2, 3–4, etc. Loading of tryptic digests onto the LC-MS/MS system was standardized by assuming the 30 μg of total protein per gel lane was evenly divided into the total number of fractions in each experiments and 0.5 μg of tryptic peptides were injected for each fraction or pool of fractions.
The numbers of unique peptides and proteins from each dataset are summarized in Figure 2. As expected, both unique peptide and unique protein numbers increased as the number of fractions analyzed per sample increased. Nearly twice as many proteins were identified in both 20-fraction proteomes compared with the five-fraction proteomes. The further increase in depth of analysis by increasing to 40 fractions resulted in identification of 24% more unique peptides and 35% more unique proteins identified with at least one unique peptide or 28% more unique proteins identified with at least two unique peptides compared with the average from the 20-fraction proteomes. While this increase is substantial, it doubles the required mass spectrometer time, and this moderate increase in depth of analysis may not justify the decreased throughput in some workflows, particularly those where analysis of large numbers of samples is desired. Interestingly, similar numbers of peptides and proteins were identified for the two five-fraction proteomes and the two 20-fraction proteomes. Furthermore, proteomes with identical number of fractions showed a high degree of overlap in proteins identified by two or more peptides (Figure 2C). This indicates that the gel separation distance did not affect the depth of analysis. However, peptide resolution, which was defined as the number of fractions where a peptide was identified, was affected by gel separation distance. As shown in Supplemental Figure 2, for the five-fraction proteomes, the percentage of peptides identified in a single fraction was only 46% for the 1-cm separation, but increased to 64% for the 2-cm separation that was analyzed as five fractions. Similarly, for the 20-fraction datasets, the percentage of peptides identified in a single fraction was only 37% for the 2-cm separation and was 45% for the 4-cm separation.
Figure 2. Comparisons of SDS gel length and number of fractions on depth of plasma proteome analysis.

A) Number of unique peptides identified for depleted plasma separated for differing distances (1, 2, or 4 cm) on 1-D mini-gels. In each case, the entire gel lane to the dye front was cut into 1-mm slices and each slice was separately digested with trypsin. For the 1-cm gel, two adjacent digests were pooled resulting in a total of five fractions. For the 2-cm gel, five fractions were created by pooling four adjacent digests, or 20 individual digests were analyzed. For the 4-cm gel, 20 fractions were created by pooling two adjacent fractions, or 40 individual digests were analyzed. B) The number of unique proteins identified in each proteome. C) Overlap of proteins identified by at least two peptides in the two, five-fraction (left panel) and two, 20-fraction (right panel) proteomes. Overlap was assessed based upon exact matches of database entries and was, therefore, an underestimate of actual overlap of identified proteins.
Taken together, these results suggest that for discovery studies, the gel separation distance is relatively unimportant, whereas the more important factor is the total number of fractions analyzed by LC-MS/MS. In contrast, for MRM assays the gel separation distance should be based upon the desired number of fractions to be analyzed such that each digest represents a single 1-mm-high gel slice. This will maximize the number of peptides detectable in a single fraction, which is more important for MRM assays because having peptides targeted for quantitation in single fractions will maximize peptide signal intensities and may improve throughput.
Peptide OFFGEL Fractionation Using Low- and High-resolution Kits
OFFGEL fractionations of replicate aliquots of the large depleted plasma pool tryptic digests were performed using the manufacturer’s instructions, except without using glycerol in the rehydration buffer or sample buffer. Specifically, 30 μL depleted plasma digest was separated using either a low-resolution kit (12 wells, 12-cm IPG strip) or high-resolution kit (24 wells, 24-cm IPG strip) in duplicate. In order to reduce mass spectrometer analysis time, duplicate fractionations using the 12-well format and one set of 24-well fractions were analyzed by LC-MS/MS. As shown in Figure 3, the 24-fraction experiment identified 5,410 unique peptides, compared to an average of 3,552 unique peptides from the duplicate 12-fraction experiments for an increase of 52% more peptides identified for twice the MS analysis time. At the protein level, the 24-fraction experiment identified 47% more total proteins, i.e., 1,080 proteins compared to an average of 737 proteins from the duplicate 12-fraction experiments. A similar trend was observed when only proteins identified by two or more unique peptides were considered, with 43% more proteins identified in the 24-fraction experiment (596 proteins compared with an average of 417 proteins). Interestingly, Hubner, et al., reported only about 19% more proteins were identified in yeast lysates using the 24-well format compared with the 12-well format OFFGEL system.21 This difference of 19% for yeast lysates compared with our 43% for depleted plasma is probably due to the far wider dynamic range of protein concentrations in plasma compared with yeast lysates. Combining the duplicate 12-fraction proteomes into a single dataset resulted in 479 unique proteins identified by at least two peptides, with 74% of these proteins common to both replicates. This combined dataset was still 20% smaller than the corresponding data from the single 24-fraction analysis, despite representing the same number of total LC-MS/MS runs. Interestingly, 89% of the proteins from the combined 12-fraction proteomes were also identified in the 24-fraction proteome, illustrating good reproducibility across experiments with similar depth of analysis (Figure 3C).
Figure 3. Comparisons of OFFGEL electrophoresis runs using low- and high-resolution separation kits.

A) The number of unique peptides identified in duplicate 12-fraction, low-resolution separation and a 24-fraction, high-resolution run using pH 3–10 IPG strips. B) The number of unique proteins identified in each proteome. C) Overlap of proteins identified by at least two peptides in the three separations. Overlap was assessed based upon exact matches of database entries.
These results show that the 24-well fractionation is clearly advantageous for analysis of depleted plasma proteomes. Unfortunately, one of the limitations of OFFGEL electrophoresis is the lack of flexibility in adjusting the maximum number of fractions that can be achieved. The options are to analyze 12 or 24 fractions, or to reduce the number of fractions by pooling selected fractions after separation. Indeed, strategic pooling of selected fractions probably could moderately increase throughput without reducing depth of coverage, because the complexity of different fractions varies greatly as indicated by the distribution of unique peptides among fractions. The 12- and 24-fraction separations show similar trimodal distributions of peptide complexity (Supplemental Figure 3A, 3B) with two regions of low-complexity fractions. For example, with the more extensive 24-fraction separation, the simplest fractions contain only about 120 identifiable peptides while other fractions have about six times as many identifiable peptides. Despite the limitations described above, an advantage of this method is that peptide resolution is very high, with about 75% and 62% of all peptides identified in a single fraction for the 12- and 24-well separations, respectively, as shown in Supplemental Figure 3C.
Effects of Number of hpRP-HPLC Fractions on Depth of Plasma Proteome Analysis
For the systematic comparison experiment, tryptic digests of depleted plasma were separated on a narrowbore XBridge BEM column using a gradient that was optimized in pilot experiments (Supplemental Figure 4). Neighboring fractions were pooled based on the absorbance elution profiles to yield 12, 20 or 40 fractions, where total absorbance per fraction within each sample set were as similar as possible (Supplemental Tables 1A and 1B). Duplicates of the 12-fraction set and single sets of the 20- and 40-fraction experiments were analyzed by LC-MS/MS. The numbers of unique peptides and proteins identified are shown in Figures 4A and 4B, respectively. There are 30% and 38% more peptides, and 40% and 45% more proteins identified by two or more peptides as the fraction number is increased from 12 to 20 and from 20 to 40 fractions, indicating that increasing the fraction number to at least 40 has a substantial impact on the depth of plasma proteome analysis. The proteins identified by at least two unique peptides in the 40 fraction hpHPLC experiment, which is the largest dataset obtained in these studies, are shown in Supplemental Table 3. Similar to the other fractionation methods, separations and the resulting identified proteomes were reproducible, with about 89% of proteins identified by two or more peptides common to both replicate 12-fraction datasets (Figure 4C). Using UV absorbance at 215 nm to guide fraction pooling worked effectively to achieve similar complexity, as most fractions within an experiment had similar numbers of unique identifiable peptides (Supplemental Figures 5A, 5B, and 5C). Interestingly, similar peptide resolution was achieved at all fractionation levels, as 73%, 75%, and 70% of the peptides were identified in a single fraction for the 12-, 20-, and 40-fraction datasets, respectively (Supplemental Figure 5D). Increasing the number of fractions had little effect on the number of fractions containing a single peptide, thereby demonstrating the high resolution of hpRP-HPLC to separate the peptides in our current experimental conditions.
Figure 4. Comparisons of hpRP-HPLC separations after pooling peptides into differing numbers of fractions.

A) The number of unique peptides identified after pooling separated peptides into 12, 20 or 40 fractions. B) The number of unique proteins identified in each proteome. C) Overlap of proteins identified by at least two peptides in the duplicate 12-fraction analyses. Overlap was assessed based upon exact matches of database entries.
Comparison of 1-D SDS-PAGE, Peptide OFFGEL, and Peptide hpRP-HPLC Fractionation Methods at Different Levels of Fractionation
As discussed above, increasing the number of fractions increased the depth of analysis for each fractionation method with the trade-off of decreased throughput. The critical factor is to find the optimal trade-off between throughput and depth of analysis. Hence, we compared the depth of analysis for the three methods over overlapping ranges of fraction numbers (Figure 5). Regardless of the criteria used to measure depth of analysis, the trends were similar, with hpRP-HPLC consistently yielding the highest numbers of unique peptides and unique proteins, particularly as the total number of fractions per experiment increased. That is, there were relatively small differences between methods when12 fractions were compared, whereas the curves diverged with increasing degree of fractionation (Figure 5). Furthermore, general linear regression models (GLM) were used to test if the different fractionation methods and the number of fractions would affect the number of identified unique peptides and unique proteins. The potential interaction effects between fractionation methods and the number of fractions were examined using a likelihood-ratio test. Based on a regression model with interaction terms we estimated the difference in the average number of identified unique peptides or unique proteins between any two of the three fractionation methods at several given numbers of fractions (Table 1). The results show that hpRP-HPLC yielded significantly higher number of unique peptides and unique proteins than SDS at any given number of fractions. Compared with OFFGEL, hpRP-HPLC identified significantly more unique peptides, but did not identify significantly more unique proteins. However, one limitation of OFFGEL electrophoresis is that it is currently limited to a maximum of 24 fractions, while larger numbers of fractions are readily feasible with hpRP-HPLC. OFFGEL, compared with SDS, identified significantly more unique proteins at any tested number of fractions, but did not significantly identify more unique peptides if fraction number was less than 24. Interestingly, 1-D SDS-PAGE, which was determined to be the most effective proteome fractionation method in two prior studies using cell or tissue lysates, 22, 23 yielded the lowest depth of analysis for fractionation of plasma in this study. For plasma proteome analysis, hpRP-HPLC yielded the greatest depth of analysis, and the advantage of hpRP-HPLC relative to 1-D SDS PAGE was the greatest when larger numbers of fractions were used (Figure 5).
Figure 5. Analysis depth of alternative middle step fractionation methods.

A) Relationship between number of unique peptides identified and number of fractions per proteome for the three methods. B) Number of unique proteins identified by a single peptide. C) Number of unique proteins identified by at least two peptides. Data points for each fractionation method were connected using the smooth curve option in Excel.
Table 1.
General linear regression model indicating estimated differences, 95% confidence intervals and P-values.
| Estimated difference (95% confidence interval) in the number of identified unique peptides
| ||||||
|---|---|---|---|---|---|---|
| Number of fractions | OFFGEL vs. SDS-PAGE | P-value* | hpRP-HPLC vs. SDS-PAGE | P-value | hpRP-HPLC vs. OFFGEL | P-value |
| 12 | −114.6 (−561.8, 332.7) | 0.616 | 967.5 (550.0, 1385.1) | <0.001 | 1082.1 (588.7, 1575.) | <0.001 |
| 20 | 401.9 (−33.6, 837.4) | 0.070 | 1276.2 (925.6, 1626.7) | <0.001 | 874.2 (424.4, 1324.0) | <0.001 |
| 24 | 660.2 (81.7, 1238.6) | 0.025 | 1430.5 (1059.8, 1801.1) | <0.001 | 770.3 (186.4, 1354.2) | 0.010 |
| 40 | N.A.** | 2047.7 (1366.9, 2728.4) | <0.001 | N.A.** | ||
| Estimated difference (95% confidence interval) in the number of identified unique proteins (one peptide)
| ||||||
|---|---|---|---|---|---|---|
| Number of fractions | OFFGEL vs SDS-PAGE | P-value | hpRP-HPLC vs. SDS-PAGE | P-value | hpRP-HPLC vs. OFFGEL | P-value |
| 12 | 93.3 (27.0, 159.6) | 0.006 | 121.6 (59.8, 183.5) | <0.001 | 28.3 (−44.8, 101.4) | 0.448 |
| 20 | 121.0 (56.5, 185.6) | <0.001 | 141.7 (89.8, 193.7) | <0.001 | 20.7 (−45.9, 87.3) | 0.543 |
| 24 | 134.9 (49.2, 220.6) | 0.002 | 151.8 (96.9, 206.7) | <0.001 | 16.9 (−69.6, 103.4) | 0.702 |
| 40 | N.A.** | 192.0 (91.2, 292.9) | <0.001 | N.A.** | ||
| Estimated difference (95% confidence interval) in the number of identified unique proteins (two or more peptides)
| ||||||
|---|---|---|---|---|---|---|
| Number of fractions | OFFGEL vs SDS-PAGE | P-value | hpRP-HPLC vs. SDS-PAGE | P-value | hpRP-HPLC vs. OFFGEL | P-value |
| 12 | 79.1 (23.5, 134.7) | 0.005 | 90.5 (38.6, 142.4) | 0.001 | 11.4 9–49.9, 72.8) | 0.715 |
| 20 | 117.4 (63.2, 171.5) | <0.001 | 143.5 (99.95, 187.1) | <0.001 | 26.2 (−29.8, 82.1) | 0.359 |
| 24 | 136.5 (64.6, 208.4) | <0.001 | 170.1 (124.0, 216.1) | <0.001 | 33.5 (−39.1, 106.1) | 0.365 |
| 40 | N.A.** | 276.2 (191.5, 360.8) | <0.001 | N.A.** | ||
P-value <0.05 was considered as statistical significance.
N.A.
Not analyzed: it is not feasible to fractionation proteome into greater than 24 fractions with current applied OFFGEL instruments.
A more detailed analysis of the three methods at similar throughput levels can be achieved by comparing the protein datasets identified by two or more peptides for the 20–24 fraction experiments. When 20 or 24 fractions (depending upon method) per proteome were used, OFFGEL and hpRP-HPLC yielded 28% and 27% more protein identifications than 1-D SDS-PAGE, respectively. The total number of unique proteins identified by at least one of the three methods at the 20–24 fraction level is 802, and the number of proteins identified by all three methods is 335. Only 8.5% (68) of the proteins were unique to SDS-PAGE, whereas 13.3% (107) and 13.7% (110) were unique to OFFGEL and hpRP-HPLC, respectively, as shown in Figure 6A. Interestingly, when the sample resolution was increased to 40 fractions per proteome, hpRP-HPLC identified 46% more proteins than the 1-D SDS-PAGE method (858 vs. 587), as shown in Figure 6B. The total number of proteins identified by these two methods is 974, with 471 common to both datasets, 12% (116) unique to SDS-PAGE, and 40% (387) unique to hpRP-HPLC. It is not surprising that these diverse fractionation methods would identify somewhat complementary datasets. However, the degree of complementarity is too low to consider using multiple fractionation methods either in tandem or sequentially.
Figure 6. Overlap of protein identifications from the three separation methods.
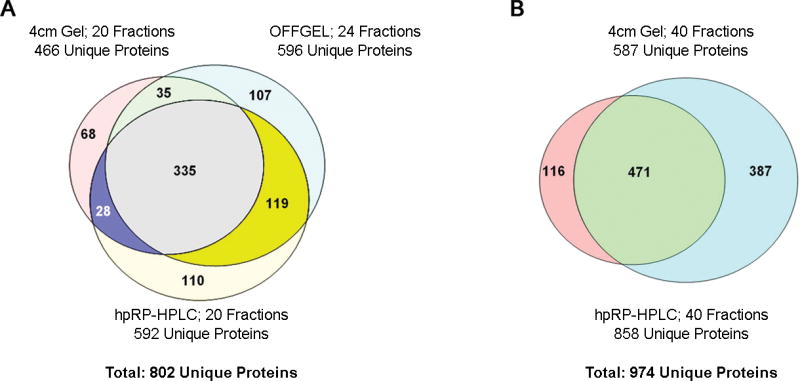
A) Overlap of proteins identified by at least two peptides at the intermediate fractionation level (20–24 fractions) for SDS gels, OFFGEL electrophoresis, and hpRP-HPLC. B) Overlap of proteins identified by at least two peptides at the extensive fractionation level (40 fractions) using SDS gels and hpRP-HPLC. Overlap was assessed based upon exact matches of database entries.
Identification of known low-abundant plasma proteins
Another method of assessing depth of plasma proteome analysis is to determine the number of known low-abundant plasma proteins identified in the different datasets. Hence, these datasets were compared to a list of low-abundant plasma proteins that included 154 proteins with reported concentrations of 100 ng/mL or less. 33, 34 Consistent with the overall protein and unique peptide counts, hpRP-HPLC identified more low-abundant proteins than SDS-PAGE and the OFFGEL method when 20 to 24 fractions were used (Figure 7), and the largest numbers of low-abundant proteins among all datasets were identified in the 40-fraction hpRP-HPLC dataset. When only high confident assignments based on identification by two or more peptides was considered, the 40-fraction hpRP-HPLC dataset identified nearly twice as many low- abundant proteins compared with all other datasets. To further compare identification and peptide coverage of low- abundant proteins across methods, all proteins with reported abundances of 50 ng/ml or less33, 34 that were identified by two or more peptides in at least one of the experiments involving at least 20 fractions based were listed in Supplemental Table 4. The 40 fraction hpRP-HPLC dataset identified 18 of these 21 low-abundant proteins, while the other methods identified 12 or less. In addition, most proteins were identified by the largest number of peptides in the 40 fraction hpRP-HPLC dataset. For example, the lowest-abundant protein detected, interleukin 18 (59 pg/ml) was detected by two peptides in the 40 fraction hpRP-HPLC dataset, by a single peptide in the OFFGEL_24F dataset, and was not detected in any other dataset. The second lowest detected protein, gamma enolase (80 ng/ml) was detected by six and four peptides in the 40 and 20 fraction hpRP-HPLC datasets, respectively, compared with three or less peptides in all other datasets. Not surprisingly, specific proteins were preferentially detected by either the RP-HPLC method or 1-D SDS PAGE method, but it is interesting that OFFGEL never detected a low-abundant protein that was not detected by one of the alternate methods when similar numbers of fractions were compared. Overall, the hpRP-HPLC 40 fraction method provided the highest sensitivity for identification of low abundant plasma proteins with the greatest sequence coverage.
Figure 7. Identification of known low-abundant proteins using alternative middle-step separations in a 3-D plasma proteome analysis scheme.

A low-abundant plasma protein list that includes 154 proteins with reported concentration of 100 ng/mL or less was compared to datasets for each fractionation method by searching protein names against the DTA select files.33, 34 Different charge states and variable modifications of methionine oxidation and asparagine deamidation of a unique sequence were collapsed into a single peptide count.
Comparison of separation efficiency indicated by peptide resolution
For discovery experiments, the most important factors are the numbers of proteins identified, the sequence coverage (1-peptide-hit proteins are more tentative even at stringent overall false discovery rates), and capacity to identify low-abundant proteins, as summarized above. However, for MRM assays, an additional important parameter is the total number of fractions among which a peptide is distributed. When a peptide is spread among multiple fractions, the peptide signal strength will decrease and the total number of fractions that need to be analyzed will probably increase, thereby reducing assay throughput. At the 20- or 24-fraction level, the portion of peptides identified in a single fraction were 75% for hpRP-HPLC, 62% for OFFGEL, and only 45% for 1-D SDS-PAGE (Figure 8). At the 40-fraction level, the proportion of peptides in a single fraction was 70% for hpRP-HPLC and only 34% for 1-D SDS PAGE. Therefore, hpRP-HPLC is clearly the method of choice for MRM assays.
Figure 8. Separation efficiencies for the three fractionation methods.

The pie charts show percentages of peptides identified in one or more fractions in the different proteomes. The number of peptides tabulated here is somewhat larger than the number of unique peptides shown in earlier figures, because peptides containing one or more asparagines and the same peptide sequence with one or more deamidated asparagines were treated as different peptides for the purpose of assessing separation efficiency.
Sample preparation time and costs
Additional factors to consider when considering alternative fractionation methods include costs of consumables and personnel time required to process a set of samples. Consumables costs per plasma or serum sample for the three methods evaluated in this study were estimated to be approximately $8 for hpRP-HPLC, $15 for 1-D gels, and $140 for OFFGEL electrophoresis. The two contributors to the much higher cost of OFFGEL separations are the costs of the OFFGEL kit and the large number of SPE columns needed for sample clean-up after electrophoresis. The number of samples that a skilled operator can process per week was estimated to be similar for the three methods. The actual amount of personnel time required can be influenced by whether automation or sample processing formats that facilitate higher throughput are used, particularly for the most time-consuming steps. In this regard, the major bottleneck for in-gel digestion is slicing gel lanes and digesting the many resulting samples. Due to variability in robotic gel cutting and digestions, we use a semiautomated system where digests are performed in 96-well pierced plates, reagents are added using an 8-channel pipet, and liquids are removed by centrifugation. Using this approach, processing of a batch of eight samples requires about 24 h of personnel time. The major bottleneck for the hpRP-HPLC method is performing the HPLC separations, pooling fractions, and drying the fractions to remove the organic solvent. Processing a batch of eight samples requires about 36 h of personnel time using our current setup, although use of an autoinjector, programmed collection of the optimized time ranges for fractions, and use of 96-well collection plates could dramatically reduce time. The major bottlenecks in OFFGEL electrophoresis are setting up the apparatus, sample loading, sample collection, and SPE extraction of the collected fractions. A 96-well SPE plate is used for the post-electrophoresis step, thereby reducing operator time for processing of eight samples to approximately 18 h.
In summary, personnel time requirements for the three methods are similar, i.e., within a factor of two for the lowest (hpRP-HPLC) and highest throughput (OFFGEL) methods. In addition, if the streamlining steps described above for the hpRP-HPLC method would be incorporated, there would be only minor differences in required personnel time for the three alternative fractionation methods. In contrast, consumable costs for the OFFGEL separation method are dramatically higher than for the other two methods.
Merits of plasma versus serum as source material for proteomics discovery or validation
Both plasma and serum are valuable potential sources for proteomics studies and for the methods used herein, it is anticipated that similar results would be obtained. Preparation of plasma samples requires an anticoagulant such as potassium-EDTA, lithium-heparin, or sodium-citrate that have the potential to interfere with recovery of specific proteins, but none of these additives are known to interfere with any of the tested fractionation methods. In contrast the clotting process involved in serum preparation activates proteases that have the potential to substantially reduce the concentrations of proteins of interest. Hence, in general, plasma is recommended for proteomics studies, although the choice of plasma or serum can depend upon specific analytical objectives and/or target peptides or proteins.35
Conclusions
When similar numbers of fractions were used, hpRP-HPLC separation of abundant-protein-depleted plasma yielded the greatest overall depth of analysis compared with either 1-D SDS gels or OFFGEL electrophoresis of peptides. It also provided the highest separation efficiency, as indicated by the percentage of detected peptides that were only observed in a single fraction—which is particularly important for quantitative analysis of low-abundant peptides using MRM methods. Reagents costs were the lowest among the three methods evaluated, and while this method required the most personnel time per sample, the difference is not excessive and can be streamlined by using an autoinjector and 96-well collection plates for fractions. Overall, this method appears to be superior to 1-D gels or OFFGEL electrophoresis for both proteomics discovery and quantitative MRM validation experiments. One disadvantage compared with 1-D gels is that the ability to detect and separately evaluate different molecular forms of a specific protein are lost. But a compensatory factor, particularly for MRM experiments, is that addition of stable-isotope-labeled internal standard peptides can better control technical variations. Since all fractionation steps except for the immunoaffinity depletion step and the trypsin digestion occur after the addition of the internal standards. Interestingly, due to the very different modes of fractionation, a few specific low-abundant proteins may be detected by either SDS gels or hpRP-HPLC and not by the alternative method.
Supplementary Material
Acknowledgments
This project was supported by National Institutes of Health grants CA120393 and CA131582 to D.W.S. and an Institutional Cancer Center Support Grant CA010815. We thank the Wistar Institute Proteomics Core for their assistance with this project and Ms. Mea Fuller for her assistance in preparing the manuscript.
Footnotes
Supporting Information Available
Correlation of elution times with fractions for hpRP separations; FDR for all datasets; the protein list for the hpRP-HPLC 40-fraction dataset; comparisons of peptide coverage for low-abundant proteins using alternative fractionation methods; gel showing depletion of 20 abundant plasma proteins; peptide separation efficiencies using SDS gel fractionation; properties of peptide datasets using OFFGEL electrophoresis; chromatograms of representative hpRP separations; properties of peptide datasets using hpRP separation; This material is available free of charge via the Internet at http://pubs.acs.org.
References
- 1.Ludwig JA, Weinstein JN. Biomarkers in cancer staging, prognosis and treatment selection. Nat Rev Cancer. 2005;5(11):845–56. doi: 10.1038/nrc1739. [DOI] [PubMed] [Google Scholar]
- 2.Anderson NL, Anderson NG. The human plasma proteome: history, character, and diagnostic prospects. Mol Cell Proteomics. 2002;1(11):845–67. doi: 10.1074/mcp.r200007-mcp200. [DOI] [PubMed] [Google Scholar]
- 3.Rifai N, Gillette MA, Carr SA. Protein biomarker discovery and validation: the long and uncertain path to clinical utility. Nat Biotechnol. 2006;24(8):971–83. doi: 10.1038/nbt1235. [DOI] [PubMed] [Google Scholar]
- 4.Tirumalai RS, Chan KC, Prieto DA, Issaq HJ, Conrads TP, Veenstra TD. Characterization of the low molecular weight human serum proteome. Mol Cell Proteomics. 2003;2(10):1096–103. doi: 10.1074/mcp.M300031-MCP200. [DOI] [PubMed] [Google Scholar]
- 5.Liu T, Qian WJ, Gritsenko MA, Xiao W, Moldawer LL, Kaushal A, Monroe ME, Varnum SM, Moore RJ, Purvine SO, Maier RV, Davis RW, Tompkins RG, Camp DG, 2nd, Smith RD. High dynamic range characterization of the trauma patient plasma proteome. Mol Cell Proteomics. 2006;5(10):1899–913. doi: 10.1074/mcp.M600068-MCP200. [DOI] [PMC free article] [PubMed] [Google Scholar]
- 6.Pieper R, Su Q, Gatlin CL, Huang ST, Anderson NL, Steiner S. Multi-component immunoaffinity subtraction chromatography: an innovative step towards a comprehensive survey of the human plasma proteome. Proteomics. 2003;3(4):422–32. doi: 10.1002/pmic.200390057. [DOI] [PubMed] [Google Scholar]
- 7.Tang HY, Ali-Khan N, Echan LA, Levenkova N, Rux JJ, Speicher DW. A novel four-dimensional strategy combining protein and peptide separation methods enables detection of low-abundance proteins in human plasma and serum proteomes. Proteomics. 2005;5(13):3329–42. doi: 10.1002/pmic.200401275. [DOI] [PubMed] [Google Scholar]
- 8.Tang HY, Beer LA, Speicher DW. In-depth analysis of a plasma or serum proteome using a 4D protein profiling method. Methods Mol Biol. 2011;728:47–67. doi: 10.1007/978-1-61779-068-3_3. [DOI] [PMC free article] [PubMed] [Google Scholar]
- 9.Fraterman S, Zeiger U, Khurana TS, Rubinstein NA, Wilm M. Combination of peptide OFFGEL fractionation and label-free quantitation facilitated proteomics profiling of extraocular muscle. Proteomics. 2007;7(18):3404–16. doi: 10.1002/pmic.200700382. [DOI] [PubMed] [Google Scholar]
- 10.Krishnan S, Gaspari M, Della Corte A, Bianchi P, Crescente M, Cerletti C, Torella D, Indolfi C, de Gaetano G, Donati MB, Rotilio D, Cuda G. OFFgel-based multidimensional LC-MS/MS approach to the cataloguing of the human platelet proteome for an interactomic profile. Electrophoresis. 2011;32(6–7):686–95. doi: 10.1002/elps.201000592. [DOI] [PubMed] [Google Scholar]
- 11.Mena ML, Moreno-Gordaliza E, Moraleja I, Canas B, Gomez-Gomez MM. OFFGEL isoelectric focusing and polyacrylamide gel electrophoresis separation of platinum-binding proteins. J Chromatogr A. 2011;1218(9):1281–90. doi: 10.1016/j.chroma.2010.12.115. [DOI] [PubMed] [Google Scholar]
- 12.Zhang Y, Li Y, Qiu F, Qiu Z. Comprehensive analysis of low-abundance proteins in human urinary exosomes using peptide ligand library technology, peptide OFFGEL fractionation and nanoHPLC-chip-MS/MS. Electrophoresis. 2010;31(23–24):3797–807. doi: 10.1002/elps.201000401. [DOI] [PubMed] [Google Scholar]
- 13.Warren CM, Geenen DL, Helseth DL, Xu H, Solaro RJ. Sub-proteomic fractionation, iTRAQ, and OFFGEL-LC-MS/MS approaches to cardiac proteomics. J Proteomics. 2010;73(8):1551–61. doi: 10.1016/j.jprot.2010.03.016. [DOI] [PMC free article] [PubMed] [Google Scholar]
- 14.Ernoult E, Bourreau A, Gamelin E, Guette C. A proteomic approach for plasma biomarker discovery with iTRAQ labelling and OFFGEL fractionation. J Biomed Biotechnol. 2010;2010:927917. doi: 10.1155/2010/927917. [DOI] [PMC free article] [PubMed] [Google Scholar]
- 15.Wang Y, Yang F, Gritsenko MA, Wang Y, Clauss T, Liu T, Shen Y, Monroe ME, Lopez-Ferrer D, Reno T, Moore RJ, Klemke RL, Camp DG, 2nd, Smith RD. Reversed-phase chromatography with multiple fraction concatenation strategy for proteome profiling of human MCF10A cells. Proteomics. 2011;11(10):2019–26. doi: 10.1002/pmic.201000722. [DOI] [PMC free article] [PubMed] [Google Scholar]
- 16.Kong RP, Siu SO, Lee SS, Lo C, Chu IK. Development of online high-/low-pH reversed-phase-reversed-phase two-dimensional liquid chromatography for shotgun proteomics: A reversed-phase-strong cation exchange-reversed-phase approach. J Chromatogr A. 2011;1218(23):3681–8. doi: 10.1016/j.chroma.2011.04.022. [DOI] [PubMed] [Google Scholar]
- 17.Zhou F, Cardoza JD, Ficarro SB, Adelmant GO, Lazaro JB, Marto JA. Online nanoflow RP-RP-MS reveals dynamics of multicomponent Ku complex in response to DNA damage. J Proteome Res. 2010;9(12):6242–55. doi: 10.1021/pr1004696. [DOI] [PMC free article] [PubMed] [Google Scholar]
- 18.Elschenbroich S, Ignatchenko V, Sharma P, Schmitt-Ulms G, Gramolini AO, Kislinger T. Peptide separations by on-line MudPIT compared to isoelectric focusing in an off-gel format: application to a membrane-enriched fraction from C2C12 mouse skeletal muscle cells. J Proteome Res. 2009;8(10):4860–9. doi: 10.1021/pr900318k. [DOI] [PMC free article] [PubMed] [Google Scholar]
- 19.Manadas B, English JA, Wynne KJ, Cotter DR, Dunn MJ. Comparative analysis of OFFGel, strong cation exchange with pH gradient, and RP at high pH for first-dimensional separation of peptides from a membrane-enriched protein fraction. Proteomics. 2009;9(22):5194–8. doi: 10.1002/pmic.200900349. [DOI] [PubMed] [Google Scholar]
- 20.Waller LN, Shores K, Knapp DR. Shotgun proteomic analysis of cerebrospinal fluid using off-gel electrophoresis as the first-dimension separation. J Proteome Res. 2008;7(10):4577–84. doi: 10.1021/pr8001518. [DOI] [PMC free article] [PubMed] [Google Scholar]
- 21.Hubner NC, Ren S, Mann M. Peptide separation with immobilized pI strips is an attractive alternative to in-gel protein digestion for proteome analysis. Proteomics. 2008;8(23–24):4862–72. doi: 10.1002/pmic.200800351. [DOI] [PubMed] [Google Scholar]
- 22.Fang Y, Robinson DP, Foster LJ. Quantitative analysis of proteome coverage and recovery rates for upstream fractionation methods in proteomics. J Proteome Res. 2010;9(4):1902–12. doi: 10.1021/pr901063t. [DOI] [PubMed] [Google Scholar]
- 23.Piersma SR, Fiedler U, Span S, Lingnau A, Pham TV, Hoffmann S, Kubbutat MH, Jimenez CR. Workflow comparison for label-free, quantitative secretome proteomics for cancer biomarker discovery: method evaluation, differential analysis, and verification in serum. J Proteome Res. 2010;9(4):1913–22. doi: 10.1021/pr901072h. [DOI] [PubMed] [Google Scholar]
- 24.Delmotte N, Lasaosa M, Tholey A, Heinzle E, Huber CG. Two-dimensional reversed-phase x ion-pair reversed-phase HPLC: an alternative approach to high-resolution peptide separation for shotgun proteome analysis. J Proteome Res. 2007;6(11):4363–73. doi: 10.1021/pr070424t. [DOI] [PubMed] [Google Scholar]
- 25.Dowell JA, Frost DC, Zhang J, Li L. Comparison of two-dimensional fractionation techniques for shotgun proteomics. Anal Chem. 2008;80(17):6715–23. doi: 10.1021/ac8007994. [DOI] [PMC free article] [PubMed] [Google Scholar]
- 26.Nakamura T, Kuromitsu J, Oda Y. Evaluation of comprehensive multidimensional separations using reversed-phase, reversed-phase liquid chromatography/mass spectrometry for shotgun proteomics. J Proteome Res. 2008;7(3):1007–11. doi: 10.1021/pr7005878. [DOI] [PubMed] [Google Scholar]
- 27.Beer LA, Tang HY, Barnhart KT, Speicher DW. Plasma biomarker discovery using 3D protein profiling coupled with label-free quantitation. Methods Mol Biol. 2011;728:3–27. doi: 10.1007/978-1-61779-068-3_1. [DOI] [PMC free article] [PubMed] [Google Scholar]
- 28.Beer LA, Tang HY, Sriswasdi S, Barnhart KT, Speicher DW. Systematic discovery of ectopic pregnancy serum biomarkers using 3-D protein profiling coupled with label-free quantitation. J Proteome Res. 2011;10(3):1126–38. doi: 10.1021/pr1008866. [DOI] [PMC free article] [PubMed] [Google Scholar]
- 29.Tang HY, Beer LA, Barnhart KT, Speicher DW. Rapid Verification of Candidate Serological Biomarkers Using Gel-based, Label-free, Multiple Reaction Monitoring. J Proteome Res. 2011;10(9):4005–17. doi: 10.1021/pr2002098. [DOI] [PMC free article] [PubMed] [Google Scholar]
- 30.Wang H, Tang HY, Tan GC, Speicher DW. Data analysis strategy for maximizing high-confidence protein identifications in complex proteomes such as human tumor secretomes and human serum. J Proteome Res. 2011;10(11):4993–5005. doi: 10.1021/pr200464c. [DOI] [PMC free article] [PubMed] [Google Scholar]
- 31.Kleinbaum D, Kupper L, Muller K, Nizam A. Applied regression analysis and other multivariable methods. 3. Duxburry Press; Brook: Cole publishinh Company; Pacific Grove, CA: 1998. pp. 111–211. [Google Scholar]
- 32.Armitage P, Berry G. Statistical methods in medical research. 3. Blackwell science, Inc; Malden MA: 1994. pp. 348–350. [Google Scholar]
- 33.Anderson L. Candidate-based proteomics in the search for biomarkers of cardiovascular disease. J Physiol. 2005;563(Pt 1):23–60. doi: 10.1113/jphysiol.2004.080473. [DOI] [PMC free article] [PubMed] [Google Scholar]
- 34.Polanski M, Anderson NL. A list of candidate cancer biomarkers for targeted proteomics. Biomark Insights. 2007;1:1–48. [PMC free article] [PubMed] [Google Scholar]
- 35.Rai AJ, Gelfand CA, Haywood BC, Warunek DJ, Yi J, Schuchard MD, Mehigh RJ, Cockrill SL, Scott GB, Tammen H, Schulz-Knappe P, Speicher DW, Vitzthum F, Haab BB, Siest G, Chan DW. HUPO Plasma Proteome Project specimen collection and handling: towards the standardization of parameters for plasma proteome samples. Proteomics. 2005;5(13):3262–77. doi: 10.1002/pmic.200401245. [DOI] [PubMed] [Google Scholar]
Associated Data
This section collects any data citations, data availability statements, or supplementary materials included in this article.