

Abstract
Objectives
To determine the pattern of variations in tear osmolarity and tear meniscus volume in dry eye patients and in healthy control subjects over an 8-hour daytime period.
Methods
Ten normal subjects (5 males and 5 females with a mean age of 27 ± 7 yrs) and 10 dry eye patients (4 males and 6 females with a mean age of 36 ± 12 yrs) who had been diagnosed on the basis of having an ocular surface discomfort index (OSDI) >12 and a tear breakup time of < 10 seconds or Schirmer’s test score of < 5 mm were included. The tear meniscus volumes of the participants were measured using ultra-high resolution optical coherence tomography (OCT), and tear osmolarity was measured using the TearLab Osmolarity System. Both measurements protocols were conducted on the right eye of each participant every two hours beginning at 8:30AM and ending at 4:30PM. OCT imaging was performed first and was followed by osmolarity testing.
Results
The mean tear osmolarity of the dry eye patients was 304.0 ± 10.8 mOsm/L, and the mean tear osmolarity of the normal subjects was 298.0 ±14.2 mOsm/L (P > 0.05). Over the course of 8 hours, the average measured osmolarities of the dry eye group varied by approximately 21.9 ± 13.5 mOsm/L (range, 6–43 mOsm/L), and the average measured tear osmolarities of the normal group varied by approximately 21.0 ± 9.2 mOsm/L (range, 8–35 mOsm/L). At 2:30 PM, the average volume of the tear menisci in the dry eye group was significantly lower than that of the subjects in the normal group (P < 0.05). No correlations between the tear meniscus volumes and tear osmolarities of either group were observed.
Conclusions
Variations in the tear osmolarities of individual dry eye patients and healthy normal control subjects were documented over the course of 8 daytime hours. No relationships between tear osmolarities and tear meniscus volumes were observed.
Keywords: tear osmolarity, tear meniscus, ultra-high resolution optical coherence tomography, Tearlab Osmolarity System
Introduction
The tear system is highly dynamic, and the secretion, distribution, evaporation, and drainage of tears all play important roles in maintaining the proper tear balance.1–3 Together, these functions can be thought of as constituting a “tear loop” that maintains tear homeostasis. Tears are secreted by the lacrimal gland, and they are subsequently distributed over the ocular surface during the process of blinking. They depart from the ocular surface via evaporation and drainage into the lacrimal puncta.4 The disruption of any of the component that are involved in maintaining the balance of the system may result in tear system abnormalities and may eventually lead to symptoms of dry eye.3,5 Tear osmolarity and volume are two key components of tear dynamics.6 The first-line method of dry eye management is the use of artificial tears that ameliorate the altered tear dynamics by decreasing the tear osmolarity7 and/or supplementing the tear volume.8 It has been suggested that tear hyperosmolarity is one of the main causes of the dry eye symptoms and objective signs.9–13 Measurement of tear osmolarity is considered to be an effective and objective test that can be used in diagnosing of dry eye, regardless of the etiology of the condition.3,14–17 Farris et al. proposed the use of tear hyperosmolarity measurement as a possible gold standard for the diagnosis of dry eye.18
On the basis of both the observation that tear volume is reduced in dry eye patients in our previous study19 and the observations of elevated tear osmolarity in dry eye patients that were found in other studies,3,14,16 we postulate that there may be an inverse relationship between tear volume and tear osmolarity. Thus, as the tear volume diminishes in patients with dry eye, the osmolarity of the patient’s tears becomes elevated. However, this relationship has not been well established. The upper and lower menisci contain approximately 75%–90% of the total volume of the tears that are located on the ocular surface.20 The use of a non-invasive optical coherence tomography (OCT) technique in the measurement of tear menisci is now well established,21,22 and this technique has been used in the both the evaluation and diagnosis of dry eye disease with high levels of repeatability and sensitivity.23,24 Moreover, although there are clear diurnal variations in the tear menisci,22 variations in tear osmolarity that occur throughout the day remain unclear and continue to be a subject of debate (Dalton KN, Jones LW. Optom Vis Sci 2005;82:E-abstract 055070).25–28 The goal of the present study was to measure the diurnal variations of tear osmolarity and to assess the relationship between tear osmolarity and the volume of the tear meniscus during daytime hours in both healthy subjects and dry eye patients.
Materials and Methods
Ethical approval for this prospective study was obtained from the University of Miami Institutional Review Board for Human Research. Written informed consent was obtained from each participant prior to enrollment in the study, and the study was conducted in accordance with the tenets of the Declaration of Helsinki. Study candidates underwent a screening process that included a survey of general medical and ophthalmologic history, slit-lamp biomicroscopy, a tear break-up time (TBUT) test, a fluorescein staining procedure, a Schirmer I test with anesthesia, and an assessment of Meibomian dysfunction. Each subject was also asked to complete two dry eye questionnaires including the Ocular Surface Disease Index (OSDI)29 and another survey that was designed by Lin et al. and that consisted of 8 questions.30 Participants in the present study were diagnosed with dry eye on the basis of specific signs and symptoms (an OSDI score that was >12 and a TBUT of <10 seconds or a Schirmer test score of <5 mm). Normal subjects reported being healthy and having no previous diagnosis of dry eye. None of the subjects had any current ocular or systemic diseases such as conjunctival, scleral, or corneal diseases, glaucoma, diabetes mellitus, or connective tissue diseases. Potential subjects who had a history of eye surgery, trauma, hard contact lens wear within the previous year, or who were taking antidepressant or diuretic medication at the time of the study were excluded. Soft contact lens wearers were asked to stop wearing their lenses for at least 1 week prior to data collection. The use of artificial tears was not allowed during the visit at which the tear meniscus volumes and tear osmolarities were measured. In total, 20 participants were recruited and were categorized into 2 groups: dry eye patients and normal controls. The dry eye group comprised 10 dry eye patients (4 males and 6 females) who had a mean (± SD) age of 36 ± 12 years and who had mild or moderate dry eye according to their OSDI scores. The normal group comprised 10 healthy subjects (5 males and 5 females) who had a mean (± SD) age of 27 ± 7 years.
A custom-built, ultra-high resolution (~3 μm in tissue or water) spectral domain OCT (UHR-OCT) device was used to image the tear menisci of human eyes in the present study; specific details of this measurement technique have been described previously.21,31 Briefly, the light source of the UHR-OCT had a broad bandwidth (100 nm) with a center wavelength of 840 nm. The light source was connected to a telecentric light delivery system that was driven by an X-Y galvanometer scanner, and the power that was delivered into the eye was within a safe range.32,33 The scan depth was set to 2 mm with a width of up to 15 mm. Custom software was used to capture the tear meniscus variables of the OCT images.21,22 Each eye that was tested was also photographed during the screening visit so that the eyelid lengths could be obtained from two-dimensional digital images. The tear volumes of the lower and upper tear menisci (the LTMV and the UTMV, respectively) were calculated by the same method as has been previously described,21 and the total tear meniscus volume (TTMV) was the sum of LTMV and UTMV.
We used the TearLab Osmolarity System (TearLab™ Corp., San Diego, CA, USA) to measure tear osmolarity.14,16,34 Each tear sample was taken by touching the tip of a test card to the surface of the lateral inferior tear meniscus. In total, 50 nL of collected tears were taken up into the microchannels of each test card. The samples were analyzed, and the results were displayed on a portable reader unit. According to the manufacturer, the device had an osmolarity measurement range of 275 to 400 mOsm/L and a coefficient of variation (CV%) of approximately 1.5%, resulting in an analytical standard variation of ± 5 mOsm/L. Reusable electronic check cards, which had been provided by the manufacturer as a means of procedural quality control, were used to verify the function and calibration of the device prior to testing the patients. Osmolarity control solution testing was also performed for each lot number of the test cards. Patients were seated such that their heads were positioned laterally upward and were asked to look at the ceiling. To collect tears, the tip of the test card was positioned just above the lower eyelid so that it touched the tear meniscus.
After all of the subjects had been screened and categorized, they were scheduled for testing. The testing appointments for all of the subjects were scheduled so that they took place at the same time of day. At 8:30 AM (±15 minutes), a non-invasive UHR-OCT technique was used to image the upper and lower tear menisci in the right eye of each subject. Five minutes after imaging, the baseline tear osmolarity in the right eye of each participant was measured in the manner described above. Both the OCT imaging and tear osmolarity measurement procedures were repeated every 2 hours over the course of the next 8 hours. A total of 5 measurements were taken for variable in each eye.
The data were analyzed with a statistical software package (Statistica; StatSoft, Inc., Tulsa, OK, USA) and were presented as the means ± standard deviations. For each eye, the maximum difference in tear osmolarity over the course of the 8-hour measurement period was calculated by subtracting the lowest osmolarity reading from the highest, regardless of the time at which either reading occurred. Independent sample t-tests were used to determine whether there were between-group differences in any of the variables. Repeated measurement analyses of variance (Re-ANOVAs) and post hoc analyses were used to determine whether there were any differences among the 5 measurements of the tear menisci volumes and tear osmolarities of each eye. Pearson’s correlation coefficients were calculated to analyze the relationships between the tear meniscus volumes and tear osmolarities over time. A P value of < 0.05 was considered statistically significant for all analyses.
Results
The average osmolarities of all of the samples that were collected over the course of the study period were 304.0 ± 10.8 mOsm/L (range 287 to 342 mOsm/L) for the group of dry eye patients and 298.0 ±14.2 mOsm/L (range 278 to 342 mOsm/L) for the group of normal subjects (P > 0.05). The average tear osmolarity in the normal group was significantly lower at 12:30 PM than it had been at 8:30 AM (P < 0.05, Figure 1). Additionally, there were no significant differences between both groups at any time points. Contrarily, there were no significant changes in the average tear osmolarity of the dry eye group during the entire study period (P > 0.05, Figure 1). Over the course of the 8-hour study period, the mean maximum difference in the tear osmolarity of the dry eye subjects was 21.9 ± 13.5 mOsm/L with a range of 6 – 43 mOsm/L (Figure 2), and the mean maximum difference in the tear osmolarity of the group of normal subjects was 21.0 ± 9.2 mOsm/L with a range of 8 – 35 mOsm/L.
Figure 1. Daytime variations in tear osmolarity.
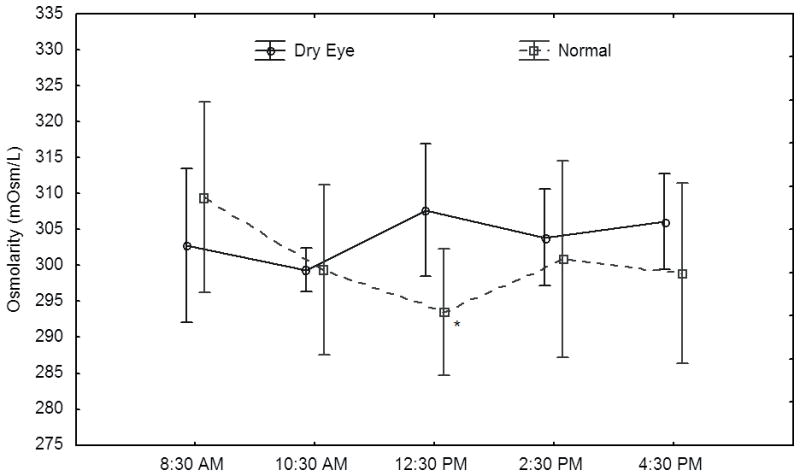
For normal subjects, tear osmolarity had fallen to levels that were significantly lower than baseline levels by 12:30 PM. Contrarily, there were no differences in the tear osmolarity values of the dry eye group at any of the 5 time points (P > 0.05). * indicates P < 0.05 compared with the baseline osmolarity value. Bars indicate 95% confidence intervals.
Figure 2. Variations in tear osmolarity.
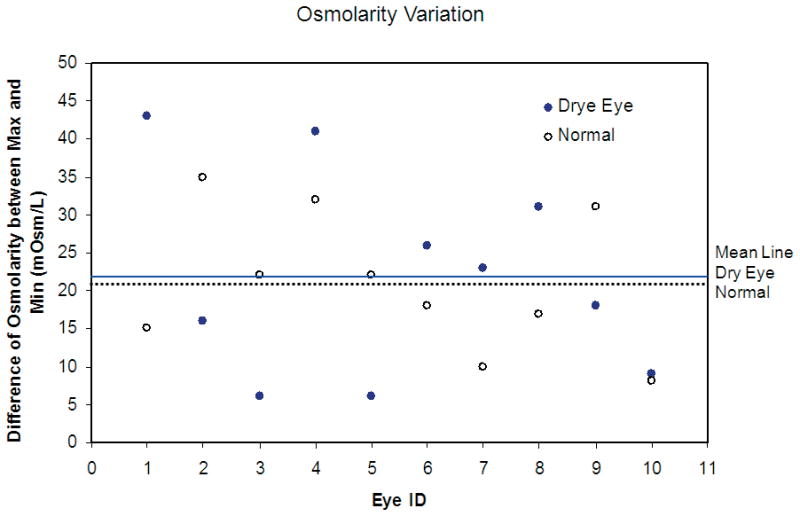
In both the dry eye and normal groups, the differences between the minimum and the maximum tear osmolarities that were measured for each subject during the course of the 8-hour study period fell within a wide range of values. The solid line indicates the average of the maximum differences in the tear osmolarity values of the members of the dry eye group; the dashed line indicates the average of the maximum differences in the osmolarity values of the members of the normal group.
Both the upper and lower tear menisci were visualized in both eyes of all 20 subjects. None of the changes in the volumes of the menisci that occurred over the course of the 8-hour study period were significant for either group (Table 1, Figure 3). From 8:30 AM (baseline) to 10:30 AM, there were no significant differences in either the total tear meniscus or lower tear meniscus volumes between the dry eye group and the normal group. However, at 2:30 PM, there were significant differences in the total tear meniscus volumes of the two groups (P <0.05, Figure 3A). From 12:30 PM until 2:30 PM, the lower tear meniscus volumes of the normal group were greater than those of the dry eye group (P < 0.05, Figure 3B). There were no significant differences in the upper tear meniscus volumes of the two groups at any time (Figure 3C). In addition, no correlations between the tear meniscus volumes and tear osmolarities were found in either group (R2 <0.036, P > 0.05, Figure 4).
Table 1.
Tear meniscus volumes (μL) over an 8-hour period.
| 8:30 AM | 10:30 AM | 12:30 PM | 2:30 PM | 4:30 PM | |
|---|---|---|---|---|---|
| UTMV, μL | |||||
| Dry Eye | 0.41 ± 0.15 | 0.47 ± 0.19 | 0.43 ± 0.14 | 0.36 ± 0.10 | 0.40 ± 0.11 |
| Normal | 0.49 ± 0.36 | 0.38 ± 0.18 | 0.47 ± 0.17 | 0.51 ± 0.25 | 0.44 ± 0.17 |
| LTMV, μL | |||||
| Dry Eye | 0.32 ± 0.26 | 0.37 ± 0.16 | 0.29 ± 0.12 | 0.29 ± 0.16 | 0.36 ± 0.26 |
| Normal | 0.38 ± 0.29 | 0.37 ± 0.28 | 0.51 ± 0.24* | 0.53 ± 0.43* | 0.48 ± 0.36 |
| TTMV, μL | |||||
| Dry Eye | 0.73 ± 0.36 | 0.84 ± 0.30 | 0.72 ± 0.20 | 0.65 ± 0.24 | 0.76 ± 0.35 |
| Normal | 0.87 ± 0.59 | 0.75 ± 0.41 | 0.99 ± 0.34 | 1.05 ± 0.63* | 0.92 ± 0.50 |
indicates P < 0.05 in comparison to the dry eye group
TTMV, total tear meniscus volume; LTMV, lower tear meniscus volume; UTMV, upper tear meniscus volume
Figure 3. Daytime variations in tear meniscus volume.
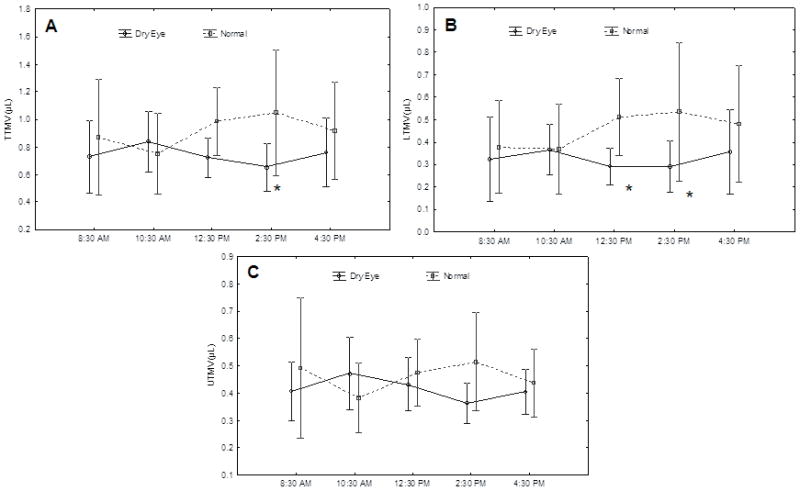
Both the average total tear meniscus volume (A) and the average lower tear meniscus volume (B) of the dry eye group were significantly less than respective volumes of the normal group at 2:30 PM. In addition, significant differences between the lower tear meniscus volumes of the two groups were apparent at 12:30 PM. (C) There were no significant between-group differences in the mean upper tear meniscus volumes at any time point. TTMV, total tear meniscus volume; LTMV, lower tear meniscus volume; UTMV, upper tear meniscus volume. * indicates P < 0.05 in comparison to the dry eye group. Bars indicate 95% confidence intervals.
Figure 4. Analyses of correlations between tear osmolarity, LTMV and TTMV.

No correlations between the tear meniscus volumes and the tear osmolarities were observed for either the dry eye group or the healthy normal subjects (P > 0.05). LTMV: lower tear meniscus volume; TTMV: total tear meniscus volume.
Discussion
The individual daytime variations in the tear osmolarities of both the normal and dry eye groups indicate the dynamic nature of the tear system. Any factors that interrupt the secretion, distribution, evaporation, or drainage of tears may interfere with the dynamic balance of the tear system and may result in variations of both tear osmolarity and tear volume.3 This may be the reason that the nature of diurnal changes in tear osmolarity remains unclear and a subject of debate.25–28 Terry et al. reported that the tear film is hypertonic during waking hours and that it is isotonic with the blood serum during sleep.25 Uniacke et al. found that tear osmolarity increased during the day, declined in the evening, and was isotonic with the blood serum during sleep.26 For the normal subjects in the present study, a decrease in tear osmolarity relative to baseline levels was evident by 12:30 PM, but no significant changes in tear osmolarity occurred in the dry eye group. These data are consistent with the findings of von Bahr et al.; they reported that there were no variations in tear osmolarity that were associated with sleep/wake cycles.27,28 Dalton et al. (Dalton KN, Jones LW. Optom Vis Sci 2005;82:E-abstract 055070) used a novel nanoliter osmometer to evaluate the tear osmolarities of a group of subjects that included both healthy people and dry eye patients. They found that although there was little variation in the average tear osmolarity over the course of a day, the degree of variation within an individual could be significant.
Invasive tear sampling in the lateral tear meniscus may affect both the accuracy and repeatability of tear osmolarity measurements. This may explain the lower osmolarities and the absence of differences between normal and dry eye groups reported by others.9,14–16,35 In addition, an awareness of the positioning of the test card tip on the ocular surface may unintentionally induce a hypersecretory reflex in some subjects,14,37 especially in subjects with low tear volumes who require longer sampling times to collect an appropriate quantity of tears. Reflex tearing during the test may cause some sampling-induced variations in tear osmolarity. Tear osmolarity also varies according to the angle at which the TearLab chip is positioned (Wunderlich K, et al. IOVS 2011;52:ARVO E-Abstract 3797) and the sampling site.37 Wunderlich et al. found that the tear osmolarity values that were obtained with the same TearLab chip varied significantly when it was positioned at each of three different angles. Tears from many locations of the ocular surface have been sampled including the meniscus, the conjunctival fornix, the temporal side, and the medial and outer parts of the conjunctival sac. Gaffney et al.38 predicted that the tear film would have a higher osmolarity than tears in the menisci of both normal and dry eye patients. In the present study, we sampled tears from the lateral lower tear meniscus. In future studies, determining the osmolarities of the tear film itself and of the upper tear meniscus may provide a deeper understanding of the complex relationships between the tear sampling location and osmolarity.
Opinions regarding the tear osmolarity that can be considered a reliable measure for the diagnosis of dry eye vary among different investigators.3,39–41 Gilbard et al.39 found the mean tear osmolarity of dry eye patients was 365 ± 77 mOsm/L, whereas Iester et al.40 and Mathers et al.41 reported values of 349.5 ± 19 mOsm/L and 313.7 ± 13 mOsm/L, respectively. In a meta-analysis, Tomlison et al.3 found that an osmolarity of 316 mOsm/L yields an accuracy of 89% in the diagnosis of dry eye. Recent studies of dry eye that have measured tear osmolarity using the TearLab Osmolarity System14,16 have found that the mean tear osmolarities of the mild-to-moderate and severe dry eye participants were 315.0 ± 11.4 mOsm/L and 336.4 ± 22.3 mOsm/L, respectively.14 On the basis of these cut-off values, some of the subjects in the present study could be regarded as having dry eye even though they did not meet the categorization criteria that we used in screening for dry eye. The goal of the present study was to identify the individual variations in tear osmolarity and to examine the relationship between tear osmolarity variations and variations in the volumes of the tear menisci. Neither tear osmolarity nor tear meniscus volume was used to determine the study groups, which may be the reason that we found a lack of significant differences in osmolarity measurements between the two groups. Nevertheless, variations in tear osmolarity were evident and may need to be considered in future study designs.
Although the tear meniscus volumes of the participants in the dry eye group were smaller than those of the normal subjects, the approximate daytime homeostasis of the tear menisci was evident in both groups. Shen et al.22 investigated diurnal changes in the tear menisci of 20 young, healthy subjects, and found that the volumes of the menisci were stable during the daytime. Thus, under normal circumstances, each component of the tear loop contributes to the maintenance of the dynamic balance of the tear system. However, the LTMV was significantly lower in the dry eye group compared with the normal group in the early afternoon. Although none of the volume changes that occurred during the study period within either group were significant, the gradual and subtle increase in the average lower meniscus volume of the normal group and the equally gradual and subtle decrease in the average lower meniscus volume of the dry eye group resulted in the significant differences that were found between the two groups. This is in agreement with the findings of other studies, such as one by Shen et al.23 in which real-time OCT was used to measure the tear menisci in patients with aqueous tear deficiency (ATD) dry eye. They found that the tear menisci of ATD patients were smaller than the menisci of healthy subjects. A similar result was reported by Chen et al.19 These data indicate that there are differences in the tear balance of the two groups, which suggests that dry eye patients may have a partially impaired ability to maintain a proper balance of tears by means of self-regulation.
Because it is difficult to quantify the tear osmolarity and the tear meniscus volumes of the ocular surface, relatively little information has been made available regarding the relationship between these two parameters in dry eye patients and in normal subjects. Previous studies have reported that tear osmolarity and meniscus volumes were correlated with ocular comfort and objective signs of dry eye, respectively,9–13,21,42,43 so it seems logical that there would be some relationship between the tear osmolarity and meniscus volumes. However, we did not find evidence of such a relationship for either group in the present study. This is in agreement with the findings of Stahl et al. who showed that although the heights of the tear menisci in patients with nasolacrimal duct obstructions decreased after they received dacryocystorhinostomies, their tear osmolarities were unaffected.44 Thus, we postulate that compared with tear volume, which was inferred on the basis of our measurements of tear meniscus variables, tear osmolarity may be more affected by both tear secretion and tear evaporation than by drainage.
The very large individual variations in tear osmolarity that were observed in the current study may be another reason that we were not able to find any correlation between tear osmolarity and meniscus volume. Moreover, this result may simply be a consequence of the small number of subjects in each group and the lack of severe dry eye patients in the present study. A larger study population may be required to detect a true difference between the tear osmolarity of dry eye patients and that of healthy individuals.
The present study has some limitations. It is possible that the initial examination that was conducted to establish baseline values may have affected the subsequent measurements. We measured used a non-invasive OCT technique to measure the tear meniscus variables in a dimly lit room prior to conducting the more invasive procedure for measuring tear osmolarity. The interval of approximately 5 minutes that elapsed between the two measurements should have largely alleviated any error that may have arisen due to the interaction between the two measurements. Measurement errors and other possible error sources have already been discussed.23
In summary, variations in the tear osmolarities of individual dry eye patients and normal subjects were documented during an 8-hour daytime period. The volume of the tear meniscus appeared to be an indicator that could be used to discriminate between dry eye patients and normal subjects. No relationship between the measured tear osmolarities and meniscus volumes was evident.
Acknowledgments
Funding / Support: This study was sponsored by a research grant from Allergan, Inc. This study was also supported by NIH Center Grant P30 EY014801 and Research to Prevent Blindness (RPB).
Financial Disclosures: The authors have no proprietary interest in any materials or methods described within this article.
References
- 1.Golding TR, Bruce AS, Mainstone JC. Relationship between tear-meniscus parameters and tear-film breakup. Cornea. 1997;16:649–661. [PubMed] [Google Scholar]
- 2.Savini G, Barboni P, Zanini M. Tear meniscus evaluation by optical coherence tomography. Ophthalmic Surg Lasers Imaging. 2006;37:112–118. [PubMed] [Google Scholar]
- 3.Tomlinson A, Khanal S, Ramaesh K, et al. Tear film osmolarity: determination of a referent for dry eye diagnosis. Invest Ophthalmol Vis Sci. 2006;47:4309–4315. doi: 10.1167/iovs.05-1504. [DOI] [PubMed] [Google Scholar]
- 4.Doughty MJ, Fonn D, Richter D, et al. A patient questionnaire approach to estimating the prevalence of dry eye symptoms in patients presenting to optometric practices across Canada. Optom Vis Sci. 1997;74:624–631. doi: 10.1097/00006324-199708000-00023. [DOI] [PubMed] [Google Scholar]
- 5.Tomlinson A, Khanal S. Assessment of tear film dynamics: quantification approach. Ocul Surf. 2005;3:81–95. doi: 10.1016/s1542-0124(12)70157-x. [DOI] [PubMed] [Google Scholar]
- 6.Mathers WD. Why the eye becomes dry: a cornea and lacrimal gland feedback model. CLAO J. 2000;26:159–165. [PubMed] [Google Scholar]
- 7.Aragona P, Di Stefano G, Ferreri F, et al. Sodium hyaluronate eye drops of different osmolarity for the treatment of dry eye in Sjogren's syndrome patients. Br J Ophthalmol. 2002;86:879–884. doi: 10.1136/bjo.86.8.879. [DOI] [PMC free article] [PubMed] [Google Scholar]
- 8.Wang Y, Zhuang H, Xu J, et al. Dynamic changes in the lower tear meniscus after instillation of artificial tears. Cornea. 2010;29:404–408. doi: 10.1097/ICO.0b013e3181bd476c. [DOI] [PubMed] [Google Scholar]
- 9.Gilbard JP, Farris RL, Santamaria J. Osmolarity of tear microvolumes in keratoconjunctivitis sicca. Arch Ophthalmol. 1978;96:677–681. doi: 10.1001/archopht.1978.03910050373015. [DOI] [PubMed] [Google Scholar]
- 10.Farris RL, Gilbard JP, Stuchell RN, et al. Diagnostic tests in keratoconjunctivitis sicca. CLAO J. 1983;9:23–28. [PubMed] [Google Scholar]
- 11.Lemp MA. Report of the National Eye Institute/Industry workshop on Clinical Trials in Dry Eyes. CLAO J. 1995;21:221–232. [PubMed] [Google Scholar]
- 12.Gilbard JP, Rossi SR, Gray KL. A new rabbit model for keratoconjunctivitis sicca. Invest Ophthalmol Vis Sci. 1987;28:225–228. [PubMed] [Google Scholar]
- 13.Gilbard JP, Rossi SR, Heyda KG. Tear film and ocular surface changes after closure of the meibomian gland orifices in the rabbit. Ophthalmology. 1989;96:1180–1186. doi: 10.1016/s0161-6420(89)32753-9. [DOI] [PubMed] [Google Scholar]
- 14.Sullivan BD, Whitmer D, Nichols KK, et al. An objective approach to dry eye disease severity. Invest Ophthalmol Vis Sci. 2010;51:6125–6130. doi: 10.1167/iovs.10-5390. [DOI] [PubMed] [Google Scholar]
- 15.Khanal S, Tomlinson A, McFadyen A, et al. Dry eye diagnosis. Invest Ophthalmol Vis Sci. 2008;49:1407–1414. doi: 10.1167/iovs.07-0635. [DOI] [PubMed] [Google Scholar]
- 16.Lemp MA, Bron AJ, Baudouin C, et al. Tear Osmolarity in the Diagnosis and Management of Dry Eye Disease. Am J Ophthalmol. 2011 doi: 10.1016/j.ajo.2010.10.032. [DOI] [PubMed] [Google Scholar]
- 17.Tomlinson A, Cedarstaff T. Diurnal variation in human tear evaporation. Journal of The British Contact Lens Association. 1992;15:77–79. [Google Scholar]
- 18.Farris RL. Tear osmolarity--a new gold standard? Adv Exp Med Biol. 1994;350:495–503. doi: 10.1007/978-1-4615-2417-5_83. [DOI] [PubMed] [Google Scholar]
- 19.Chen F, Shen M, Chen W, et al. Tear meniscus volume in dry eye after punctal occlusion. Invest Ophthalmol Vis Sci. 2010;51:1965–1969. doi: 10.1167/iovs.09-4349. [DOI] [PubMed] [Google Scholar]
- 20.Holly FJ. Physical chemistry of the normal and disordered tear film. Trans Ophthalmol Soc U K. 1985;104 ( Pt 4):374–380. [PubMed] [Google Scholar]
- 21.Wang J, Aquavella J, Palakuru J, et al. Relationships between central tear film thickness and tear menisci of the upper and lower eyelids. Invest Ophthalmol Vis Sci. 2006;47:4349–4355. doi: 10.1167/iovs.05-1654. [DOI] [PubMed] [Google Scholar]
- 22.Shen M, Wang J, Tao A, et al. Diurnal variation of upper and lower tear menisci. Am J Ophthalmol. 2008;145:801–806. doi: 10.1016/j.ajo.2007.12.024. [DOI] [PubMed] [Google Scholar]
- 23.Shen M, Li J, Wang J, et al. Upper and lower tear menisci in the diagnosis of dry eye. Invest Ophthalmol Vis Sci. 2009;50:2722–2726. doi: 10.1167/iovs.08-2704. [DOI] [PubMed] [Google Scholar]
- 24.Ibrahim OM, Dogru M, Takano Y, et al. Application of visante optical coherence tomography tear meniscus height measurement in the diagnosis of dry eye disease. Ophthalmology. 2010;117:1923–1929. doi: 10.1016/j.ophtha.2010.01.057. [DOI] [PubMed] [Google Scholar]
- 25.Terry JE, Hill RM. Human tear osmotic pressure: diurnal variations and the closed eye. Arch Ophthalmol. 1978;96:120–122. doi: 10.1001/archopht.1978.03910050076019. [DOI] [PubMed] [Google Scholar]
- 26.Uniacke NP, Hill RM. Osmotic pressure of the tears during adaptation to contact lenses. J Am Optom Assoc. 1970;41:932–936. [PubMed] [Google Scholar]
- 27.von BAHR G. Corneal thickness; its measurement and changes. Am J Ophthalmol. 1956;42:251–266. [PubMed] [Google Scholar]
- 28.von BAHR. The corneal thickness during perfusion of the anterior chamber with solutions of various tonicity. Doc Ophthalmol. 1962;16:5–10. doi: 10.1007/BF00146715. [DOI] [PubMed] [Google Scholar]
- 29.Schiffman RM, Christianson MD, Jacobsen G, et al. Reliability and validity of the Ocular Surface Disease Index. Arch Ophthalmol. 2000;118:615–621. doi: 10.1001/archopht.118.5.615. [DOI] [PubMed] [Google Scholar]
- 30.Lin PY, Tsai SY, Cheng CY, et al. Prevalence of dry eye among an elderly Chinese population in Taiwan: the Shihpai Eye Study. Ophthalmology. 2003;110:1096–1101. doi: 10.1016/S0161-6420(03)00262-8. [DOI] [PubMed] [Google Scholar]
- 31.Wang J, Jiao S, Ruggeri M, et al. In situ visualization of tears on contact lens using ultra high resolution optical coherence tomography. Eye Contact Lens. 2009;35:44–49. doi: 10.1097/ICL.0b013e31819579f2. [DOI] [PMC free article] [PubMed] [Google Scholar]
- 32.Chen Q, Wang J, Tao A, et al. Ultrahigh-resolution measurement by optical coherence tomography of dynamic tear film changes on contact lenses. Invest Ophthalmol Vis Sci. 2010;51:1988–1993. doi: 10.1167/iovs.09-4389. [DOI] [PMC free article] [PubMed] [Google Scholar]
- 33.Zhou C, Wang J, Jiao S. Dual channel dual focus optical coherence tomography for imaging accommodation of the eye. Opt Express. 2009;17:8947–8955. doi: 10.1364/oe.17.008947. [DOI] [PMC free article] [PubMed] [Google Scholar]
- 34.Benelli U, Nardi M, Posarelli C, et al. Tear osmolarity measurement using the TearLab Osmolarity System in the assessment of dry eye treatment effectiveness. Cont Lens Anterior Eye. 2010;33:61–67. doi: 10.1016/j.clae.2010.01.003. [DOI] [PubMed] [Google Scholar]
- 35.Khanal S, Tomlinson A, Diaper CJ. Tear physiology of aqueous deficiency and evaporative dry eye. Optom Vis Sci. 2009;86:1235–1240. doi: 10.1097/OPX.0b013e3181bc63cc. [DOI] [PubMed] [Google Scholar]
- 36.White KM, Benjamin WJ, Hill RM. Human basic tear fluid osmolality. I. Importance of sample collection strategy. Acta Ophthalmol (Copenh) 1993;71:524–529. doi: 10.1111/j.1755-3768.1993.tb04630.x. [DOI] [PubMed] [Google Scholar]
- 37.Murube J. Tear osmolarity. Ocul Surf. 2006;4:62–73. doi: 10.1016/s1542-0124(12)70028-9. [DOI] [PubMed] [Google Scholar]
- 38.Gaffney EA, Tiffany JM, Yokoi N, et al. A mass and solute balance model for tear volume and osmolarity in the normal and the dry eye. Prog Retin Eye Res. 2010;29:59–78. doi: 10.1016/j.preteyeres.2009.11.002. [DOI] [PubMed] [Google Scholar]
- 39.Gilbard JP, Farris RL. Tear osmolarity and ocular surface disease in keratoconjunctivitis sicca. Arch Ophthalmol. 1979;97:1642–1646. doi: 10.1001/archopht.1979.01020020210003. [DOI] [PubMed] [Google Scholar]
- 40.Iester M, Orsoni GJ, Gamba G, et al. Improvement of the ocular surface using hypotonic 0. 4% hyaluronic acid drops in keratoconjunctivitis sicca. Eye (Lond) 2000;14:892–898. doi: 10.1038/eye.2000.244. [DOI] [PubMed] [Google Scholar]
- 41.Mathers WD, Lane JA, Sutphin JE, et al. Model for ocular tear film function. Cornea. 1996;15:110–119. doi: 10.1097/00003226-199603000-00002. [DOI] [PubMed] [Google Scholar]
- 42.Chen Q, Wang J, Shen M, et al. Lower volumes of tear menisci in contact lens wearers with dry eye symptoms. Invest Ophthalmol Vis Sci. 2009;50:3159–3163. doi: 10.1167/iovs.08-2794. [DOI] [PubMed] [Google Scholar]
- 43.Chen Q, Wang J, Shen M, et al. Tear menisci and ocular discomfort during daily contact lens wear in symptomatic wearers. Invest Ophthalmol Vis Sci. 2010 doi: 10.1167/iovs.10-5780. [DOI] [PubMed] [Google Scholar]
- 44.Stahl U, Francis IC, Stapleton F. Prospective controlled study of vapor pressure tear osmolality and tear meniscus height in nasolacrimal duct obstruction. Am J Ophthalmol. 2006;141:1051–1056. doi: 10.1016/j.ajo.2005.12.051. [DOI] [PubMed] [Google Scholar]