Abstract
To understand the process of protein folding, it will be necessary to obtain detailed structural information on folding intermediates. This difficult problem is being studied by using hydrogen exchange and rapid mixing to label transient structural intermediates, with subsequent analysis of the proton-labelling pattern by two-dimensional nuclear magnetic resonance spectroscopy. Results for cytochrome c show that the method provides the spatial and temporal resolution necessary to monitor structure formation at many defined sites along the polypeptide chain on a timescale ranging from milliseconds to minutes.
A MAJOR obstacle in the ongoing effort to discover the principles of protein folding is the elusive nature of structural intermediates on the folding pathway. The folding transition for globular proteins is often highly cooperative, which makes it difficult to study folding intermediates at equilibrium. Evidence for kinetic intermediates has been found for several proteins1, but the structural description of these transient states is a formidable experimental challenge. One approach relies on disulphide reactions to trap folding intermediates in stable form (reviewed in ref. 2). We chose a different method which makes use of hydrogen–deuterium exchange to label NH sites on the polypeptide chain that are still unprotected at defined time points during refolding, followed by two-dimensional nuclear magnetic resonance (2-D NMR) analysis of the refolded protein to determine the amount of proton label trapped at points throughout the structure. One can thus follow the time course of structure formation for those regions of the protein where labile hydrogens become protected against exchange on refolding.
The application of hydrogen exchange labelling methods for kinetic folding studies was pioneered by Baldwin and coworkers3,4, who initially used tritium exchange and manual mixing to study the slow folding phase of ribonuclease A. The power of this approach is significantly enhanced by the use of hydrogen–deuterium exchange in conjunction with rapid mixing methods, and the subsequent proton-resolved analysis of the labels trapped during refolding using proton NMR (ref. 5). The feasibility of this method was demonstrated by Roder and Wüthrich6 in a study of early structural events in the refolding of bovine pancreatic trypsin inhibitor using one-dimensional NMR. The development of 2-D NMR methods7–9 now makes it possible to monitor a comprehensive set of individual protons at known locations throughout the protein structure. Hydrogen exchange adds the ability to resolve structural events on a millisecond timescale to the inherent spatial resolution of 2-D NMR.
The hydrogen exchange labelling results presented here provide an initial picture of the folding process for cytochrome c in terms of the time-resolved formation of hydrogen-bonded structure. Distinct kinetic patterns are observed for amide protons located in different parts of the protein. Several amide sites on the two terminal helices acquire over 60% protection against exchange within the first 20 ms of refolding, a timescale where previously little was known about folding in structural terms. All other amide protons observed so far remain accessible for exchange at the first stage of folding, and are protected by structure formed in two slower kinetic phases on the 100 ms and 10 s timescale respectively. These include sites in two helical segments between residues 60 and 75, as well as a number of amide protons that form H-bonded tertiary interactions.
The choice of horse cytochrome c for these studies was motivated by our success in obtaining essentially complete resonance assignments in the 1H NMR spectrum in both oxidation states10,11,33. Mitochondrial c-type cytochromes are among the best characterized proteins. Several species have been studied by X-ray crystallography12–14, and extensive protein-folding studies have been reported15–21.
Pulse labelling strategy
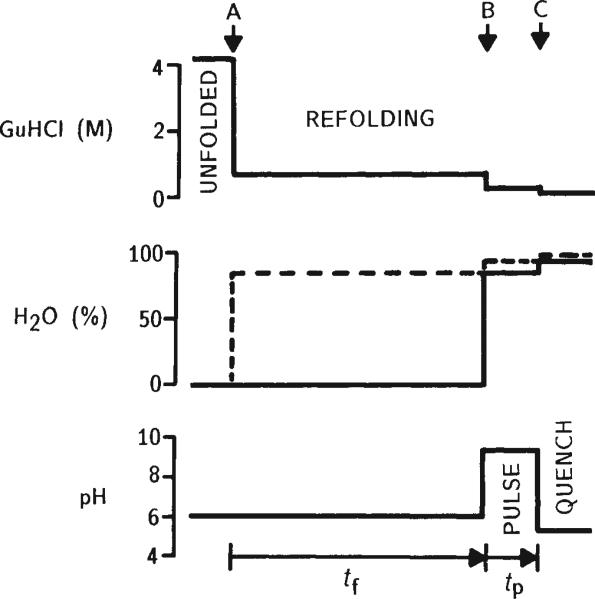
Hydrogen exchange labelling experiments with cytochrome c require the use of preparative rapid-mixing techniques, because the kinetics of refolding are dominated by processes on the 10 and 100 ms timescale16,19. A variation of the pulse labelling method proposed by Kim and Baldwin4 was used for the selective proton labelling of cytochrome c (Fig. 1). The protein is initially unfolded in a D2O-denaturant solution. All exchangeable NH sites become deuterated. Refolding, initiated by rapid dilution of the denaturant, is allowed to proceed for variable time periods before the partially refolded protein is exposed to a 50-ms H2O labelling pulse. Under the conditions chosen for the pulse (pH 9.3, 10 °C, 40–60 ms), the free-peptide H-exchange time constant is about 1 ms (ref. 22), so that amide sites in still unstructured parts of the protein become fully protonated. On the other hand, the proton label is excluded from sites where exchange is retarded more than 50-fold by prior formation of (H-bonded) structure. The labelling pulse is terminated by a rapid change to slow-exchange conditions and refolding is allowed to proceed to completion. The proton labelling pattern imprinted by the pulse is fixed within the native protein and can be analysed at leisure by 2-D NMR. For the quantitation of individual proton occupancies, we use the well resolved NH–CαH cross peaks in 2-D J-correlated (COSY) spectra7,23.
Fig. 1.
Schematic illustration of the H-exchange pulse labelling method used in kinetic refolding experiments with cytochrome c. The relevant solution conditions are shown in relation to three rapid mixing events (arrows). All experiments were performed at 10°C on a commercial preparative rapid-mixing apparatus (Hi-Tech, Salisbury, UK) with an estimated mixing dead time of about 2 ms. Oxidized cytochrome c (type VI from horse heart, purchased from Sigma) was initially dissolved in D2O at pD 6.0 containing 4.2 M guanidine hydrochloride (GuHCl) as a denaturant. These conditions were shown to produce complete unfolding of cytochrome c, as judged by circular dichroism and hydrogen exchange, with the exception of a limited amount of residual structure in the vicinity of the His 18 haem ligand (unpublished data). Initial protein concentration was 6 mM. Refolding was initiated in the first mixer (A) by rapid 6-fold dilution with 0.1 M acetate at pH 6.2 in H2O (dashed line). The resulting GuHCl concentration (0.7 M) is well below the unfolding transition. After variable refolding times (tf), the solution was combined in a second mixer (B) with an equal volume of an H2O buffer (0.1 M sodium phosphate, 0.1 M glycine) at pH 9.3 (final pH determined in a separate control). Under these pulse conditions, freely accessible amide protons exchange in about 1 ms (ref. 22). The labelling pulse was terminated after 50± 10 ms by a rapid pH change to 5.3, accomplished by injecting the solution at the exit of the mixing apparatus into a reservoir of quench buffer (0.3 M sodium citrate, 0.05 M sodium ascorbate, 0 °C) under vigorous stirring (C). The quench conditions favour slow H-exchange (intrinsic exchange times are ~10 s) and rapid refolding. The ascorbate in the quench solution serves both as pH buffer and reducing agent for cytochrome c, taking advantage of the fact that many amide protons exchange much more slowly in the reduced form of the protein25. This procedure, with H2O present in the refolding period, was used for experiments at refolding times tf < 1 s. At longer times, H-exchange is no longer negligible (typical free-peptide exchange times are about 3 s at pH 6,10 °C), and refolding has to be done in D2O (solid line in centre panel). Subsequent preparation of samples for NMR analysis was carried out at 4 °C. Unfolding was not completely reversible under the conditions used; varying amounts of aggregated or incorrectly refolded protein were detected by NMR. The native monomeric fraction was isolated by use of Biorex-70 cation exchange columns. Washing with 0.7 M NaCl, 0.1 M NaPO4 (pH 6.0) elutes the native cytochrome c and not the incorrectly folded (aggregated) material. The protein was concentrated and transferred into D2O by repeated dilution and ultrafiltration. The final NMR sample conditions were between 3 and 5 mM reduced cytochrome c in D2O, pD 5.3, 0.05 M K3PO4, 0.01 M ascorbate. Samples were stored at 4 °C before NMR measurements performed within 24 hours, or at –85 °C for prolonged periods.
The requirement for three sequential mixing stages makes it technically difficult to implement the pulse labelling experiment on a rapid-mixing apparatus. The first two mixing events (dilution of the denaturant and dilution of the D2O solution into H2O at the labelling pulse) involve large mixing ratios (at least 1:5), which together with the final quenching step results in substantial dilution of the protein (>70-fold). However, 1:1 mixing can be used at the second stage if the D2O refolding buffer of the original method4,24 is replaced by an H20 buffer under slow H-exchange conditions (dashed line in Fig. 1). This approach is valid as long as H-exchange into the deuterium-labelled sites of interest is negligible during the refolding time. In the present study this condition was fulfilled for all but the longest refolding times used (>1 s).
The number of probe points monitored by this method is limited to those hydrogens that exchange slowly in the native protein. In a hydrogen-exchange study of cytochrome c, we found that H–D exchange rates can be measured by 2-D NMR methods for about 50 of the 100 backbone amide protons25. Almost all of these protons are involved in crystallographically defined intramolecular hydrogen bonds. The correlation between H-exchange slowing and hydrogen bonding has been noted before26. In most cases then, the protection against hydrogen exchange measured in refolding experiments can be interpreted in terms of hydrogen-bond formation. In the refolding process, some amide hydrogens may become buried and protected against exchange without H-bond formation, but such forms are energetically unfavourable (> 1 kcal mol–1 per proton) and are unlikely to involve many protons. One can also consider the possibility that exchangeable hydrogens may initially become protected by H-bonding to non-native acceptors which are later replaced by the acceptors of the native structure. Such an event might give rise to a transient increase in labelling as tf (Fig. 1) is varied through the time region where the sites that are protected initially become accessible and are then protected again.
Results
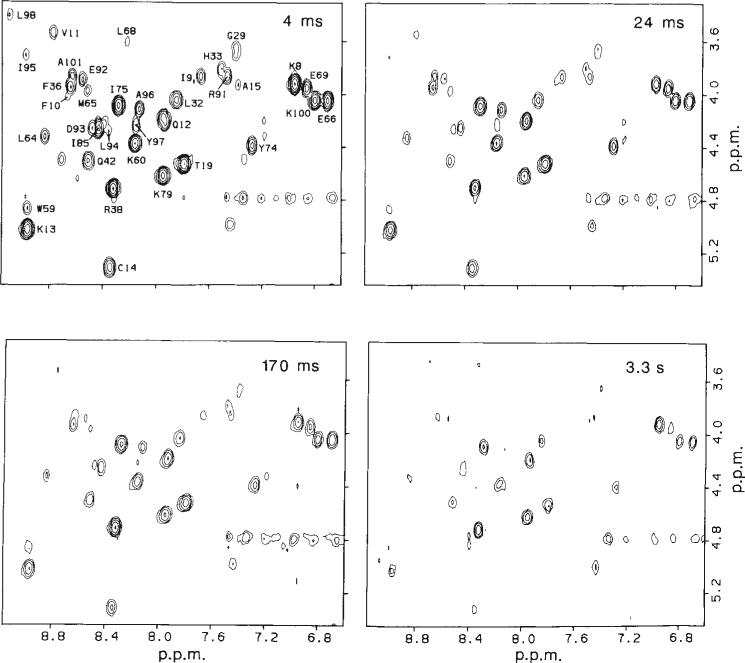
Pulse-labelling experiments with oxidized cytochrome c were performed at 12 different refolding times between 4 ms and 1 min. For each time point a separate cytochrome c sample was prepared in the reduced form for NMR analysis. A section of the COSY spectrum that includes the majority of NH–CαH cross peaks is shown in Fig. 2 for four representative samples labelled at different refolding times. The extreme upper and lower level of cross-peak intensities (volumes) were determined in control experiments in which either fully unfolded or fully folded cytochrome c was exposed to the labelling pulse. The COSY spectrum of the unfolded control sample, labelled to the maximum level determined by the mixing ratio (92%), was used to normalize NH–CαH cross-peak intensities in terms of proton occupancy (intensities vary from one cross peak to another as a result of differences in scalar coupling constants and transverse relaxation times). The folded control experiment was performed to test for the resistance of individual protons in native oxidized cytochrome c to H-exchange labelling. Proton label was excluded from all but five amide sites; these are known to exchange rapidly in the oxidized form but slowly in the reduced form25, so they become labelled in the pulse and then trapped when the protein is reduced in the quench buffer. These amide protons therefore cannot serve as structural probes and were disregarded in the analysis.
Fig. 2.
Two-dimensional NMR analysis of representative cytochrome c samples prepared by the pulse labelling method outlined in Fig. 1. Sections of 2-D J-correlated (COSY) contour plots containing the majority of the NH–CαH cross peaks are shown for samples labelled at four different refolding times. The residue assignments obtained by Wand el al.11 are indicated. Magnitude COSY spectra7,23 were recorded at 20°C on a 500 MHz Bruker AM 500 spectrometer. One hundred and twenty eight transients of 1,024 complex data points covering a spectral width of 9,090 Hz were recorded for each of 400 t1 increments (0 to 44 ms). The data were processed on a Micro VAX computer, using the FTNMR program provided by Dennis Hare. Unshifted sine multiplication and a 2 Hz line-broadening were applied in both dimensions before Fourier transformation. The final digital resolution was 8.9 Hz per point in both dimensions. Cross-peak intensities were measured by volume integration, using a 3-point radius. The average volume of three cross peaks between non-labile protons (not shown) was used as an internal intensity standard. Relative proton occupancies at individual amide NH sites were obtained by using the unfolded control (see text) for normalization; the COSY cross-peak intensities of the control were taken to correspond to 100% proton occupancy.
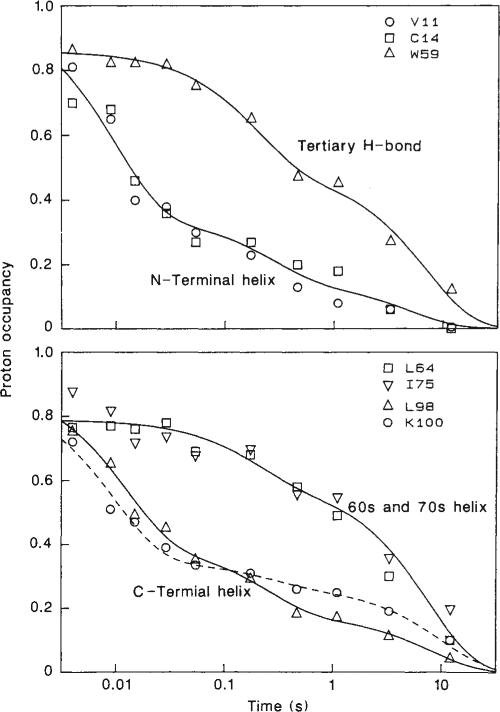
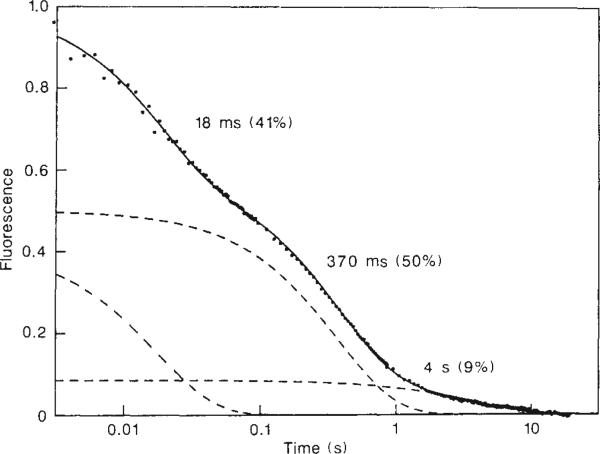
The extent of labelling at 35 individual amide sites was determined by volume integration of the corresponding NH–CαH peaks, using as an internal intensity standard the average volume of some resolved cross peaks for non-labile protons. For a limited number of amide protons, complementary data were obtained from resolved resonances in the 1-D NMR spectrum. Figure 3 shows the relative proton occupancy as a function of refolding time (logarithmic scale) for a representative set of amide sites. For comparison, Fig. 4 shows the results of a fluorescence-detected stopped-flow refolding experiment under identical conditions. The fluorescence of Trp 59, the single tryptophan residue in horse cytochrome c, becomes quenched during refolding as a result of energy transfer to the nearby haem16.
Fig. 3.
Time course of protection against H-exchange labelling for a representative set of backbone NH sites, distributed along the cytochrome c polypeptide chain, and one side chain NH (Trp 59). Proton occupancies are plotted as a function of the refolding time, tf, on a logarithmic scale. The curves represent sums of two (top curve in each panel) or three (bottom curve in each panel) exponential terms. Sample preparation and NMR analysis are described in Figs 1 and 2 respectively. As the Leu 98 backbone NH and the Trp 59 indole NH produce weak COSY cross peaks but are well resolved in the 1-D NMR spectrum, these protons were measured by integration of their resonances in 1-D NMR spectra recorded before and after 2-D experiments.
Fig. 4.
Refolding kinetics in cytochrome c at 10°C, monitored by the fluorescence of a single tryptophan residue (Trp 59). The data were collected on a Hi-Tech stopped-flow apparatus, using a deuterium lamp for excitation at 280 nm and observation of the fluorescence emission at 350 nm. As in the pulse labelling experiments (Fig. 1), cytochrome c was unfolded in 4.2 M GuHCl, pH 6.0, and refolded at pH 6.2 in the presence of 0.7 M GuHCl. The final protein concentration was 5 × 10⁻⁶ M. Under these conditions, unfolding was fully reversible. The kinetic data are presented on the same logarithmic timescale used in Fig. 3. The solid curve was obtained by nonlinear least-squares fitting of three exponential phases, resulting in the indicated time constants and amplitudes. The individual phases are displayed separately with dashed lines.
Kinetic patterns
The pulse labelling results indicate that structural refolding events are dispersed over a timescale ranging from milliseconds to tens of seconds (Fig. 3). Although the detailed behaviour varies among different NH sites, some common kinetic phases can be recognized. The different labelling curves in Fig. 3 can be represented as sums of either two or three exponentials. Several sites acquire about 60% protection within about 20 ms, a second common phase occurs at about 200 ms, and all protons become fully protected in a final phase at about 10 s. The small number of distinct kinetic phases suggests that refolding follows a limited number of pathways with discrete intermediates and argues against folding models with numerous parallel folding pathways (compare ref. 27).
At the shortest refolding time used (4 ms), all proton occupancies are reduced by 10–20% relative to the maximum occupancy measured in the unfolded control experiment (Fig. 3). The origin of this effect is uncertain at this time. It may be an indication of an initial rapid folding process occurring in the dead time of the preparative mixing experiments.
Fluorescence observation of the refolding kinetics (Fig. 4) reveals three phases with relaxation times that closely match the main phases of the proton labelling data (Fig. 3). The kinetic trace for Trp 59 fluorescence quenching is similar to the labelling curve for N- and C-terminal protons, but strikingly different from the course of protection of the Trp 59 indole NH (top curve in Fig. 3), which monitors the formation of a tertiary H-bond with the haem propionate. In the initial kinetic phase, the fluorescence signal drops by 40% while the indole NH remains largely protonated, indicating that the tryptophan ring is brought closer to the haem without formation of the specific H-bonded interaction. The discrepancy between fluorescence and proton labelling persists out to the slowest kinetic phase, which has been attributed to kinetic heterogeneity of the unfolded protein17. Nearly 50% of the molecules form the Trp 59–haem hydrogen bond in the slowest phase, whereas the amplitude of the fluorescence-detected slow phase is only 10%. Such behaviour would clearly not occur in a two-state folding mechanism, even with multiple unfolded forms (see below).
Structural patterns
The degree of protection acquired in the early phase is greatest for amide protons of the N-terminal and C-terminal helices; their proton occupancy drops to about 40% in 30 ms. The examples shown in Fig. 3 are representative for a group of about 10 amide protons, all of which are found in one of the terminal helices of the folded structure. At the same time, other protons located throughout the intervening polypeptide segment remain almost completely accessible for H-exchange labelling; these include sites in two helical segments (residues 61–69 and 71–75), as well as some protons involved in tertiary hydrogen bonds (such as the Trp 59 indole NH to propionate H-bond). Practically all protons analysed so far fall into one of these two classes, although our present data set is not yet complete (quantitation of some amide protons is difficult for technical reasons, for example because of weak NH–CαH cross peaks or spectral overlap). One possible exception is the backbone NH of His 18, which was found to remain partially protected against H-exchange under denaturing conditions (unpublished observation). It is not surprising to find some residual structure in this part of cytochrome c, considering the fact that the polypeptide chain is covalently attached to the haem by Cys 14 and Cys 17, and the His 18 ring remains ligated to the haem iron under the unfolding conditions used.
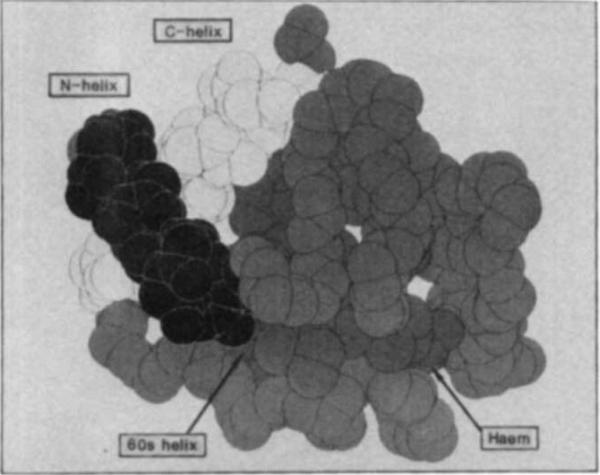
The rapid protection of N- and C-terminal amide protons in a common kinetic phase distinct from all other protons suggests a special role for the terminal helices at an early stage of refolding. In native cytochrome c, the two terminal helices form a tight contact near Gly 6 and Tyr 97, as illustrated in Fig. 5. This interaction is a characteristic feature of all cytochrome c proteins of known structure, and the predominantly hydrophobic residues in the contact region are highly conserved. The observation that amide protons of both helices are protected on the same rapid timescale suggests that formation of the helices and the helix-helix contact are among the earliest structural events. Although the actual docking of the helices is not directly demonstrated here, it seems unlikely that the two helices would fold independently at the same rate, following the same characteristic labelling curve throughout, while the time course for protection of other segments is very different. The fact that the rate of protection for N- and C-terminal amide protons (50 s–1) coincides with the rate of the initial fluorescence change (reduced Trp 59–haem distance) suggests that association of the chain termini may be accompanied by a general condensation of the initially unfolded chain.
Fig. 5.
Space-filling model of cytochrome c (ref. 13) showing the location of various structural elements followed in the refolding experiments. Side chains are omitted. The view was chosen to emphasize the contact between the N-terminal (dark) and C-terminal (light) α-helices which is formed early in folding. Also identified are the 60s helix, an example of a structural feature formed late in folding, and the haem. Trp 59 is behind the lower right edge of the haem.
It is noteworthy that in native cytochrome c the majority of the very slowly exchanging amide protons are found on the N- and C-terminal helices (Phe 10 and residues 94–99; to be published). The helix contact region of the early folding intermediate is thus among the most stable parts (by H-exchange criteria) of the folded structure. The possibility that the association of chain termini at an early stage of folding may represent a common pattern in protein folding, perhaps as a mechanism for conformational entropy reduction, seems worth considering.
In the intermediate kinetic phase (~200 ms), all observed amide protons acquire at least 50% protection (Fig. 3 and additional data, not shown), indicating the formation of stable structure throughout the molecule. The ultimate level of protection reached in about 1 min (data not shown) is indistinguishable from that of the native protein.
Folding pathways
In terms of folding pathways, let us consider two possible situations. (1) The refolding protein follows a sequential pathway of intermediate states, that is, different structural elements form sequentially and gain stability as refolding progresses. In this case, the time course for protection against H-exchange labelling will differ for different regions of the protein. Furthermore, the degree of H-exchange labelling at each position will depend on the stability of the folding intermediate at that position and the pulse labelling conditions. For example under our conditions, the pulse intensity (pulse time × free-peptide exchange rate) is about 50, so that an amide site would become 63% labelled if local structure were to reduce its exchange rate 50-fold relative to the free-peptide rate. (2) The unfolded protein consists of a heterogeneous mixture of rapidly and more slowly refolding molecules, and each class of molecules undergoes a cooperative (two-state) folding transition. In this case, varying amounts of unfolded and fully native molecules will be present at different times, but there will be no partially folded forms. All the amide sites in different parts of the protein would then follow the same labelling curve. The degree of labelling at any time point would be as insensitive to the pulse conditions as the native protein.
The present data show some characteristics of both of these extreme possibilities. The observation of distinct labelling curves for different sites provides clear evidence for partially structured folding intermediates. In particular, the rapid protection in the first kinetic phase exclusively for N- and C-terminal amide sites is characteristic of sequential folding behaviour. This result is consistent with the idea that key elements of secondary structure are formed early in folding1,5,28. But the rate-limiting step in stabilizing the early intermediate in cytochrome c appears to be the association of the two helical segments, probably driven by hydrophobic interaction of the residues at the helix–helix interface.
The observation of partially folded conformations early in folding argues against the initial model of Brandts and coworkers29, in which a heterogeneous two-state mechanism (the second possibility discussed above) results from the presence of non-native proline isomers that completely block refolding. But the later folding phases are not inconsistent with heterogeneous behaviour. For instance, a possible interpretation for the labdling pattern observed near tf = 0.5 s (Fig. 3) is that about half of the molecules are completely folded, a second fraction (30–40%) contains folded structure only at the chain termini, and a minor popUlation (~15%) of molecules is still extensively disordered, as suggested by the ~15% labelling of the N- and C-terminal amide sites. In light of the body of data documenting the kinetically heterogeneous nature of unfolded proteins in generaf29–31 and cytochrome c in particular17, some role for the heterogeneous mechanism appears likely. It is interesting to note that the 60s helix (Glu 61–Glu 69) and the 70s helix (Pro 71–Ile 75) are terminated by proline residues (Pro 71 and Pro 76). The presence of cis isomer at either of these residues might prevent the proper formation of these helices and produce slow-folding phases.
A definitive answer to how sequential and heterogeneous or parallel mechanisms mix to produce the kinetic refolding pathways(s) will have to await further experimentation. Particularly promising are pulse labelling measurements with variable pulse intensity (pulse duration or pH) which can probe the stability of folding intermediates in terms of their degree of protection against H-exchange.
Discussion
The present study demonstrates the capability of H-exchange labelling methods in combination with 2-D NMR analysis for structural characterization of the transient protein conformations encountered during refolding. The pulse labelling approach applied in this and in the accompanying article5 has several advantages compared with the previously used competition method3,6,32: the progress of folding in terms of H-bonded structure formation at individual NH sites can be monitored directly at constant pH; quantitative knowledge of intrinsic H-exchange rates is not required; the interpretation of the data does not rely on kinetic models; and the stability of folding intermediates can be probed by variation of the pulse intensit5,24.
The results can be summarized in terms of a qualitative picture of the cytochrome c folding process. In an early kinetic phase, on the 10-ms timescale, only the terminal helices form structure able partially to withstand proton labelling, probably stabilized by native-like helix–helix contacts. This phase is accompanied by some structural condensation, but other features of the native structure, including some helical segments (60s and 70s) and most tertiary H-bond interactions, are still absent. A subsequent kinetic event on the 100-ms timescale, experienced by about 50% of the molecules, is characterized by H-bond formation throughout the molecules affected. At this stage, the remaining slow-folding molecules contain stable structure only in the N- and C-terminal helices. In a final 10-s phase all amide protons acquire the protection against H-exchange labelling characteristic of native cytochrome c.
Acknowledgments
We thank Professors R. L. Baldwin and B. T. Nail for di scussions and encouragement. This work was supported by research grants from the National Institutes of Health.
References
- 1.Kim PS, Baldwin RLA. Rev. Bioehem. 51:459–489. 9821. [Google Scholar]
- 2.Creighton TE. Prog. Biophys. molec. Biol. 1978;33:231–297. doi: 10.1016/0079-6107(79)90030-0. [DOI] [PubMed] [Google Scholar]
- 3.Schmid FX, Baldwin RL. J. molec. Biol. 1979;135:199–215. doi: 10.1016/0022-2836(79)90347-4. [DOI] [PubMed] [Google Scholar]
- 4.Kim PS, Baldwin RL. Biochemistry. 1980;19:6124–6129. doi: 10.1021/bi00567a027. [DOI] [PubMed] [Google Scholar]
- 5.Udgaonkar JB, Baldwin RL. Nature. 1988;335:694–699. doi: 10.1038/335694a0. [DOI] [PubMed] [Google Scholar]
- 6.Roder H, Wüthrich K. Proteins. 1986;1:34–42. doi: 10.1002/prot.340010107. [DOI] [PubMed] [Google Scholar]
- 7.Aue WP, Bartholdi E, Ernst RR. J. chem. Phys. 1976;64:2229–2246. [Google Scholar]
- 8.Ernst RR, Bodenhausen G, Wokaun A. Principles of Nuclear Magnetic Resonance in One and Two Dimensions. Clarendon; Oxford: 1986. [Google Scholar]
- 9.Wüthrich K. NMR of Proteins and Nucleic Acids. Wiley; New York: 1986. [Google Scholar]
- 10.Wand AJ, Englander SW. Biochemistry. 1986;25:1100–1106. doi: 10.1021/bi00353a024. [DOI] [PubMed] [Google Scholar]
- 11.Wand AJ, DiStefano DL, Feng Y, Roder H, Englander SW. Biochemistry. (in the press) [Google Scholar]
- 12.Dickerson RE, et al. J. biol. Chem. 1971;246:1511–1535. [PubMed] [Google Scholar]
- 13.Takano T, Dickerson RE. J. molec. Biol. 1981;153:79–115. doi: 10.1016/0022-2836(81)90528-3. [DOI] [PubMed] [Google Scholar]
- 14.Louie GV, Hutcheon WLB, Brayer GD. J. molec. Biol. 1988;199:295–314. doi: 10.1016/0022-2836(88)90315-4. [DOI] [PubMed] [Google Scholar]
- 15.Ikai A, Fish W, Tanford C. J. molec. Biol. 1973;145:265–280. doi: 10.1016/0022-2836(73)90321-5. [DOI] [PubMed] [Google Scholar]
- 16.Tsong TY. Biochemistry. 1976;15:5467–5473. doi: 10.1021/bi00670a007. [DOI] [PubMed] [Google Scholar]
- 17.Ridge JA, Baldwin RL, Labhardt AM. Biochemistry. 1981;20:1622–1630. doi: 10.1021/bi00509a033. [DOI] [PubMed] [Google Scholar]
- 18.Nall BT, Landers TA. Biochemsitry. 1981;20:5403–5411. doi: 10.1021/bi00522a008. [DOI] [PubMed] [Google Scholar]
- 19.Brems DN, Stellwagen E. J. biol. Chem. 1983;258:3655–3660. [PubMed] [Google Scholar]
- 20.Ramdas L, Nall BT. Biochemistry. 1986;25:6959–6964. doi: 10.1021/bi00370a033. [DOI] [PubMed] [Google Scholar]
- 21.Kuwajima K, Yamaya H, Miwa S, Sugai S, Nagamura T. FEBS Lett. 1987;221:115–118. doi: 10.1016/0014-5793(87)80363-0. [DOI] [PubMed] [Google Scholar]
- 22.Molday RS, Englander SW, Kallen RG. Biochemistry. 1972;11:150–159. doi: 10.1021/bi00752a003. [DOI] [PubMed] [Google Scholar]
- 23.Nagayama K, Kumar A, Wüthrich K, Ernst RR. J. magn. Reson. 1980;40:321–334. [Google Scholar]
- 24.Kim PS. Meth. Enzym. 1986;131:136–156. doi: 10.1016/0076-6879(86)31039-5. [DOI] [PubMed] [Google Scholar]
- 25.Wand AJ, Roder H, Englander SW. Biochemistry. 1986;25:1107–1114. doi: 10.1021/bi00353a025. [DOI] [PubMed] [Google Scholar]
- 26.Englander SW, Kallenbach NR. Q. Rev. Biophrs. 1984;16:521–655. doi: 10.1017/s0033583500005217. [DOI] [PubMed] [Google Scholar]
- 27.Harrison SC, Durbin R. Proc. natn. Acad. Sci. U.S.A. 1985;82:4028–4030. doi: 10.1073/pnas.82.12.4028. [DOI] [PMC free article] [PubMed] [Google Scholar]
- 28.Ptitsyn OB, Rashin AA. Biophys. Chem. 1975;3:1–20. doi: 10.1016/0301-4622(75)80033-0. [DOI] [PubMed] [Google Scholar]
- 29.Brandts JF, Halvorson HR, Brennan M. Biochemistry. 1975;14:4953–4963. doi: 10.1021/bi00693a026. [DOI] [PubMed] [Google Scholar]
- 30.Garel J-R, Baldwin RL. Proc. natn. Acad. Sci. U.S.A. 1973;70:3347–3351. doi: 10.1073/pnas.70.12.3347. [DOI] [PMC free article] [PubMed] [Google Scholar]
- 31.Lin L-N, Brandts JF. Biochemistry. 1983;26:3537–3543. doi: 10.1021/bi00386a043. [DOI] [PubMed] [Google Scholar]
- 32.Roder H. Meth. Enzym. (in the press) [Google Scholar]
- 33.Feng Y, Roder H, Englander SW, Wand AJ, Di Stefano DL. Biochemistry. doi: 10.1021/bi00427a027. (in the press) [DOI] [PubMed] [Google Scholar]


