

SUMMARY
Tumor-specific pyruvate kinase M2 (PKM2) is essential for the Warburg effect. Besides its well-established role in aerobic glycolysis, PKM2 directly regulates gene transcription. However, the mechanism underlying this nonmetabolic function of PKM2 remains elusive. We show here that PKM2 directly binds to histone H3 and phosphorylates histone H3 at T11 upon EGF receptor activation. This phosphorylation is required for the dissociation of HDAC3 from the CCND1 and MYC promoter regions and subsequent acetylation of histone H3 at K9. PKM2-dependent histone H3 modifications are instrumental in EGF-induced expression of cyclin D1 and c-Myc, tumor cell proliferation, cell cycle progression, and brain tumorigenesis. In addition, levels of histone H3 T11 phosphorylation correlate with nuclear PKM2 expression levels, glioma malignancy grades, and prognosis. These findings highlight the role of PKM2 as a protein kinase in its nonmetabolic functions of histone modification, which is essential for its epigenetic regulation of gene expression and tumorigenesis.
Keywords: PKM2, protein kinase, histone, phosphorylation, acetylation, gene transcription, tumorigenesis
INTRODUCTION
As noted by Warburg in the 1920s, tumor cells, unlike their normal differentiated counterparts, have elevated rates of glucose uptake and lactate production in the presence of oxygen. This phenomenon, known as aerobic glycolysis or the Warburg effect, allows tumor cells to function like fetal cells and to use a large fraction of glucose metabolites to synthesize macromolecules (such as amino acids, phospholipids, and nucleic acids), which support tumor cell growth (Cairns et al., 2011; Hsu and Sabatini, 2008; Koppenol et al., 2011; Vander Heiden et al., 2009).
Pyruvate kinase regulates the final rate-limiting step of glycolysis, which catalyzes the transfer of a phosphate group from phosphoenolpyruvate (PEP) to adenosine diphosphate (ADP), yielding one molecule of pyruvate and one molecule of adenosine triphosphate (ATP) (Altenberg and Greulich, 2004; Majumder et al., 2004). Four pyruvate kinase isoforms (M1, M2, L, and R) exist in mammals and are expressed in different types of cells and tissues. The pyruvate kinase M1 (PKM1) and M2 (PKM2) isoforms result from mutually exclusive alternative splicing of the PKM2 pre-messenger ribonucleic acid (pre-mRNA), reflecting the inclusion of either exon 9 (PKM1) or exon 10 (PKM2), respectively (Noguchi et al., 1986).
Human PKM2 is expressed in fetal tissues and is progressively replaced by the other three isozymes after birth. In human cancer cells, PKM2 expression is upregulated (Dombrauckas et al., 2005; Mazurek, 2007; Mazurek et al., 2005). Replacing PKM2 with PKM1 in human lung cancer cells inhibits the Warburg effect and tumor formation in nude mouse xenografts (Christofk et al., 2008a). Under hypoxic conditions, hypoxia-inducible factor 1α interacts with prolyl hydroxylase 3 and PKM2 to stimulate transactivation of glycolytic genes that promote glucose metabolism in cancer cells (Luo et al., 2011).
Besides its well-known role in glycolysis, PKM2 regulates proliferation and apoptosis of nontransformed cells in a cell type–specific manner by largely unknown mechanisms (Hoshino et al., 2007; Lee et al., 2008; Stetak et al., 2007). PKM2 binds directly and selectively to tyrosine (Tyr, Y)-phosphorylated peptides, and expression of the phosphotyrosine-binding form of PKM2 is required for the rapid growth of cancer cells (Christofk et al., 2008b). Our recent findings revealed that activation of epidermal growth factor (EGF) receptor (EGFR), which has been reported in many human tumors (Moscatello et al., 1995; Nicholson et al., 2001; Wykosky et al., 2011), results in the translocation of PKM2, but not of PKM1, into the nucleus, where PKM2 binds to c-Src-phosphorylated Y333 of β-catenin (Yang et al., 2011). The interaction between PKM2 and β-catenin is required for this protein complex to bind to the CCND1 (encoding for cyclin D1) promoter, where PKM2 kinase activity is essential for the dissociation of histone deacetylase 3 (HDAC3) from the promoter, for histone H3 acetylation, and for cyclin D1 expression (Lu, 2012; Yang et al., 2011). This study clearly demonstrates that PKM2 directly regulates cell cycle progression by controlling cyclin D1 expression, but the mechanism underlying PKM2-regulated histone H3 modification, which activates gene transcription, is unknown.
In this report, we show that EGFR activation results in a direct interaction between PKM2 and histone H3. PKM2 phosphorylates histone H3 at threonine (Thr, T) 11, which is required for histone H3 acetylation at lysine (Lys, K) 9 and the subsequent expression of cyclin D1 and c-Myc, cell proliferation, and tumorigenesis.
RESULTS
EGF-Induced and PKM2-Dependent Phosphorylation of Histone H3 at T11 Is Required for Acetylation of Histone H3 at K9
We previously showed that EGFR activation results in PKM2-dependent acetylation of histone H3, which was detected by an anti-acetylated histone H3 antibody recognizing acetylated K4 and K9 (Yang et al., 2011) (Figure 1A). To identify the Lys residue in histone H3 acetylated upon EGFR activation, we expressed Flag-tagged K4R or K9R mutants of histone H3, in which the individual lysine was mutated into arginine, in U87/EGFR human glioblastoma multiforme (GBM) cells. Immunoblotting analysis with an anti-acetylated H3 antibody showed that histone H3 K9R, but not histone H3 K4R, was resistant to acetylation induced by EGF stimulation (Figure 1A). In addition, histone H3 K9R mutation abrogated EGF-induced H3-K9 acetylation recognized by a specific H3-K9 acetylation antibody (Figure 1A). shRNA-induced depletion of PKM2 in U87/EGFR and/or U251 GBM cells (Figure 1B, left panel) blocked EGF-induced H3-K9 acetylation, as detected by immunoblotting analysis (Figure 1B, right panel), which was further supported by liquid chromatography-coupled mass spectrometric (LC-MS/MS) analyses of a tryptic digest of immunoprecipitated endogenous histone H3 (Figure S1). These results indicate that PKM2 is required for EGF-induced H3-K9 acetylation.
Figure 1. EGF-Induced and PKM2-Dependent Phosphorylation of Histone H3 at T11 Is Required for Acetylation of Histone H3 at K9.

Please also see supplemental Figures S1-S4. Immunoprecipitation and immunoblotting analyses were performed with the indicated antibodies.
(A) U87/EGFR cells expressing Flag-tagged WT H3, H3-K4R, and K9R were treated with or without EGF (100 ng/ml) for 6 h.
(B, F) U87/EGFR and U251 cells expressing a control or PKM2 shRNA were treated with or without EGF (100 ng/ml) for 6 h. Endogenously expressed histone H3 was examined. Data represent the mean ± SD of three independent experiments (F).
(C) U87/EGFR were treated with or without EGF (100 ng/ml) or 20% serum with calyculin A (25 nM) for 6 h.
(D) U87/EGFR cells with or without expressing PKM2 shRNA were treated with or without EGF (100 ng/ml) for 6 h. Endogenously expressed histone H3 was immunoprecipitated.
(E) U87/EGFR cells expressing Flag-tagged WT H3, H3-T3A, H3-T6A, and H3-T11A were treated with or without EGF (100 ng/ml) for 6 h.
(G) U87/EGFR cells expressing Flag-tagged WT H3 or H3-T11A were treated with or without EGF (100 ng/ml) for 6 h.
(H) U87/EGFR cells expressing a control shRNA or shRNA against Chk1, DAPK3, or PKN1 mRNA were analyzed by immunoblotting analysis with the indicated antibodies.
(I) U87/EGFR cells expressing a control shRNA or shRNA against Chk1, DAPK3, or PKN1 mRNA were treated with or without EGF (100 ng/ml) for 6 h and analyzed by immunoblotting analysis with the indicated antibodies.
Histones can undergo several different posttranslational modifications, including acetylation, phosphorylation, methylation, and ubiquitylation. Histone modifications can influence one another, such that one modification is required for the generation of a different modification for subsequent gene transcription regulation (Lee et al., 2010; Suganuma and Workman, 2008). Given that phosphorylation of a histone H3 serine or threonine residue can lead to acetylation of its adjacent Lys (Baek, 2011; Perez-Cadahia et al., 2009; Shimada and Nakanishi, 2008; Shimada et al., 2008), we next examined whether EGF induces histone H3 phosphorylation, which may be essential for H3-K9 acetylation. Immunoblotting analyses of immunoprecipitated histone H3 with antibodies for phospho-threonine, phospho-serine, or phospho-histone H3-S10 showed that EGFR activation increased total levels of phosphorylated threonine (Figure 1C); however, EGF stimulation, unlike treatment with serum and calyculin A (a serine/threonine phosphatase inhibitor), failed to increase total levels of phosphorylated serine or S10 in histone H3. Notably, PKM2 depletion prevented EGF-induced Thr-phosphorylation of histone H3 (Figure 1D). Mutation of T3, T6, and T11 of histone H3, which lie close to K9, into alanine (Ala, A) showed that the H3-T11A mutant, but not the H3-T3A or H3-T6A mutant, was resistant to Thr-phosphorylation induced by EGF stimulation (Figure 1E). Furthermore, EGF-induced H3-T11 phosphorylation, detected with a phospho-H3-T11–specific antibody, was reduced similarly by depletion of both PKM1 and PKM2 (Figure S2) and depletion of PKM2 alone (Figure 1F), indicating that PKM2 specifically regulates H3-T11 phosphorylation. Immunoblotting analyses of immunoprecipitated wild-type (WT) Flag-histone H3 and Flag-histone H3-T11A with an anti-acetylated H3-K9 antibody showed that the T11A mutation abrogated EGF-induced histone H3 acetylation at K9 (Figure 1G) without affecting the status of K36 trimethylation (Figure S3). These results, which are in line with a previous finding that H3-T11 phosphorylation is required for K9 acetylation (Shimada and Nakanishi, 2008), indicate that PKM2-dependent H3-T11 phosphorylation primes K9 acetylation upon EGFR activation.
Chk1 (Shimada et al., 2008), death-associated protein (DAP)-like kinase (Dlk, also termed DAPK3 and ZIPK) (Preuss et al., 2003), and protein-kinase-C-related kinase 1 (PRK1/PKN1) (Metzger et al., 2008) are reported to phosphorylate H3-T11. To examine the potential involvement of these protein kinases in EGF-regulated H3-K9 acetylation, we expressed a control shRNA or shRNA against Chk1, DAPK3, or PKN1 (encoding PRK1) mRNA in U87/EGFR (Figure 1H) or U251 (Figure S4A) cells. As shown in Figures 1I and S4B, depletion of mRNA expression of Chk1, DAPK3, and PKN1 did not affect EGF-induced H3-T11 phosphorylation, further supporting the finding that PKM2 specifically regulates H3-T11 phosphorylation and subsequent H3-K9 acetylation upon EGFR activation.
PKM2 Directly Interacts with Histone H3 and Phosphorylates H3-T11
To further determine the relationship between PKM2 and phosphorylation of H3-T11, we examined the interaction between these two proteins. Pull-down analyses by mixing purified recombinant His-PKM2 on nickel agarose beads with purified recombinant histone H3 or histone H2A showed that PKM2 directly bound to histone H3 but not to histone H2A (Figure 2A). Immunoblotting analyses of immunoprecipitated endogenous histone H3 with an anti-PKM2 antibody showed that EGF stimulation resulted in increased binding of PKM2 to histone H3 (Figure 2B). These results indicate that PKM2 interacts with histone H3 both in vitro and in cells.
Figure 2. PKM2 Directly Interacts with Histone H3 and Phosphorylates H3-T11.

Please also see supplemental Figures S5A and S5B.
Immunoprecipitation and immunoblotting analyses were performed with the indicated antibodies.
(A) Pull-down analyses were performed by mixing purified immobilized His-PKM2 on nickel agarose beads with purified non-tagged recombinant histone H3 or histone H2A.
(B) U87/EGFR cells were treated with or without EGF (100 ng/ml) for 6 h.
(C) In vitro phosphorylation was analyzed by mixing recombinant WT PKM2, PKM2 K367M, or PKM1 with purified recombinant WT H3 or H3-T11A in the presence of PEP or ATP.
(D) Purified recombinant His-histone H3 was phosphorylated by PKM2 in vitro and was analyzed by mass spectrometry. Mass spectrometric analysis of a tryptic fragment at m/z 533.258 (mass error was -0.98 ppm) matched to the doubly-charged peptide 9-KSTGGKAPR-17, suggesting that T11 was phosphorylated. The Sequest score for this match was Xcorr = 2.74; Mascot scores were 46, expectation value 5.1e-4. The pRS score was 116, site probability was 99.1%. The presence of the b2+ ion at 258.2 indicates the S10 residue is unmodified; the presence of the y7+ at 808.2 is in agreement with the assignment of the phosphorylation site to T11.
(E, F) U87/EGFR cells expressing PKM2 shRNA were reconstituted by the expression of WT rPKM2, rPKM2 K367M, or rPKM2 K433E (E) and treated with or without EGF (100 ng/ml) for 6 h (F).
We next examined whether histone H3 might be directly phosphorylated by the catalytic activity of PKM2. An in vitro phosphorylation analysis using ATP as the phosphate group donor did not detect any histone H3 phosphorylation by recombinant PKM2, as detected by immunoblotting with an anti-phospho-Thr antibody or a phospho-H3-T11–specific antibody. However, incubation of PKM2 with histone H3 in the presence of PEP, the physiological phosphate group donor of PKM2, showed that WT PKM2, but not PKM2 K367M kinase-dead mutant (Yang et al., 2011) or PKM1, phosphorylated WT histone H3 but not H3-T11A (Figure 2C and Figure S5A), although recombinant PKM2 K367M and PKM1 were able to interact with histone H3 (Figure S5B). 0.5 mM PEP, which is in the range of the physiological concentrations of PEP (Williamson et al., 1966), was used in the reaction to mimic in vivo conditions. The phosphorylation of histone H3 was further validated by LC-MS/MS analyses, showing that H3-T11, but not H3-S10, is a residue phosphorylated by PKM2 (Figure 2D). Furthermore, reconstituted expression of RNAi-resistant inactive rPKM2 K367M mutant, unlike the re-expression of its WT counterpart (WT rPKM2), in endogenous PKM2-depleted U87/EGFR cells (Figure 2E), failed to rescue EGF-induced H3-T11 phosphorylation or H3-K9 acetylation (Figure 2F). Intriguingly, reconstituted expression of a PKM2 K433E mutant, which loses its binding ability to tyrosine-phosphorylated proteins including β-catenin and promoter regions such as CCND1 and MYC (Christofk et al., 2008b; Yang et al., 2011), also largely failed to restore EGF-induced H3-T11 phosphorylation or H3-K9 acetylation (Figures 2E and 2F). These results indicate that PKM2 directly binds to histone H3 and phosphorylates histone H3 at T11, which is required for subsequent H3-K9 acetylation.
PKM2-Dependent H3-T11 Phosphorylation Promotes the Disassociation of HDAC3 from CCND1 and MYC Promoter
We previously showed that the binding of PKM2 to the CCND1 promoter is required for the dissociation of HDAC3 from the promoter (Yang et al., 2011). To examine whether PKM2-regulated H3-K9 acetylation is mediated by HDAC3 dissociation from the CCND1 promoter, which, in turn, requires prior H3-T11 phosphorylation, we performed chromatin immunoprecipitation (ChIP) analyses with an HDAC3 antibody. As shown in Figure 3, reconstituted expression of RNAi-resistant histone rH3-T11A, compared with re-expression of its WT counterpart in endogenous histone H3-depleted U87/EGFR cells (Figure 3A), blocked EGF-induced HDAC3 dissociation from the CCND1 and MYC promoters (Figure 3B). (The histone H3–depleted U87/EGFR cell line without reconstituted H3 expression was not stable, and H3 expression in these cells recovered after prolonged cultures; these cells were not used for further experiments.) To further support the finding that PKM2-dependent H3-T11 phosphorylation promotes the dissociation of HDAC3 from histone H3, we performed in vitro binding analyses by mixing purified recombinant GST-HDAC3 on agarose beads and purified recombinant WT histone H3 or histone H3-T11A mutant, which was followed by incubation with or without purified recombinant WT PKM2 or PKM2 K367M mutant in a PEP-containing kinase buffer. As shown in Figure 3C, GST-HDAC3 interacted with both WT histone H3 and histone H3-T11A. Intriguingly, the presence of WT PKM2, but not of PKM2 K367M, resulted in the dissociation of HDAC3 from WT histone H3 but not from histone H3-T11A. In addition, pre-incubation of histone H3 with recombinant PKM2 in the presence or absence of PEP before incubating with GST-HDAC3 showed that histone H3 phosphorylated by PKM2 lost its ability to interact with HDAC3 (Figure S5C). These results indicate that PKM2-dependent H3-T11 phosphorylation promotes HDAC3 dissociation from histone H3 and facilitates subsequent H3-K9 acetylation.
Figure 3. PKM2-Dependent H3-T11 Phosphorylation Promotes the Disassociation of HDAC3 from CCND1 and MYC Promoter.

Please also see supplemental Figure S5C.
Immunoblotting analyses were performed with the indicated antibodies.
(A, B) WT rH3 or rH3-T11A expression was reconstituted in endogenous H3-depleted U87/EGFR cells (A), which were then treated with or without EGF (100 ng/ml) for 6 h. ChIP analyses with a HDAC3 antibody were performed (B).
(C) GST-HDAC3 pull-down assay was performed by incubation of 100 ng of purified recombinant His-tagged WT histone H3 or H3-T11A mutant with or without immobilized GST-HDAC3, which was followed by incubation with 200 ng of purified recombinant WT His-PKM2 or His-PKM2 K367M in the presence of PEP.
PKM2-Dependent H3-T11 Phosphorylation Promotes EGF-Induced Expression of Cyclin D1 and c-Myc
EGFR activation results in complex formation between PKM2 and β-catenin, which leads to binding of the complex to the CCND1 and MYC promoter regions and subsequent histone H3 acetylation at the promoters (Yang et al., 2011). To determine whether PKM2 regulates cyclin D1 and c-Myc expression via modulating H3-T11 phosphorylation at the promoter regions, we performed ChIP analyses with anti-phospho-H3-T11. As shown in Figure 4A, EGF treatment resulted in enhanced H3-T11 phosphorylation at the CCND1 promoter, which was prevented by PKM2 depletion. Reconstituted expression of RNAi-resistant rPKM2 K367M in U87/EGFR cells (Figure 2E), unlike its WT counterpart, failed to rescue EGF-induced H3-T11 phosphorylation at the CCND1 promoter (Figure 4A). Given that WT PKM2 and PKM2 K367M have comparable affinity for CCND1 promoter regions (Yang et al., 2011), these results indicate that the kinase activity of PKM2 is required for EGF-induced H3-T11 phosphorylation at the CCND1 promoter.
Figure 4. PKM2-Dependent H3-T11 Phosphorylation Promotes EGF-Induced Expression of Cyclin D1 and c-Myc.

Please also see supplemental Figure S6.
Immunoprecipitation, immunoblotting, and ChIP analyses were performed with the indicated antibodies.
(A) U87/EGFR cells with or without depletion of endogenous PKM2 and reconstituted expression of WT rPKM2 or rPKM2 K367M were treated with or without EGF (100 ng/ml) for 10 h.
(B) 293T cells with or without expressing Flag-tagged WT H3 or H3-T11A were treated with EGF (100 ng/ml) for 6 h.
(C, D, E) U87/EGFR cells with depleted endogenous histone H3 and reconstituted expression of WT rH3 or rH3-T11A were treated with or without EGF (100 ng/ml) for 10 h. ChIP analyses were performed with an anti-PKM2 (C) or an anti-acetyl-H3K9 antibody (D). (E) Quantitative real time polymerase chain reaction (PCR) was performed with specific primers for CCND1 (left panel) or MYC mRNA (right panel). Data represent the mean ± SD of three independent experiments.
(F) U87/EGFR cells with depleted endogenous histone H3 and reconstituted expression of WT rH3, rH3-T11A, or rH3-K9R were treated with or without EGF (100 ng/ml) for 6 h for detection of H3 acetylation or 24 h for examination of cyclin D1 and c-Myc expression.
(G) U87/EGFR cells with endogenous PKM2 depletion and reconstituted expression of WT rPKM2 or rPKM2 K367M were treated with or without EGF (100 ng/ml) for 24 h.
We next investigated the significance of H3-T11 phosphorylation in EGF-induced cyclin D1 and c-Myc expression by reconstituting the expression of WT histone rH3 and histone rH3-T11A in endogenous histone H3-depleted U87/EGFR (Figure 3A). Immunoblotting analyses of immunoprecipitated Flag-tagged histone H3 with an anti-PKM2 antibody showed that Flag-tagged histone H3-T11A, acting like its WT counterpart, binds to PKM2 upon EGF stimulation (Figure 4B). ChIP analyses with a PKM2 antibody demonstrated that PKM2 binds to CCND1 promoter regions to a similar degree in the cells with reconstituted expression of WT histone rH3 and histone rH3-T11A (Figure 4C). However, reconstituted expression of histone rH3-T11A blocked EGF-induced H3-K9 acetylation at CCND1 and MYC promoter regions in both U87/EGFR (Figure 4D) and U251 cells (Figure S6A), as demonstrated by ChIP analyses with an anti-acetylated H3-K9 antibody. In addition, rH3-T11A expression abrogated EGF-enhanced mRNA levels of CCND1 and MYC (Figure 4E), H3-K9 acetylation, and expression of cyclin D1 and c-Myc in both U87/EGFR (Figure 4F) and U251 (Figure S6B) cells. Furthermore, reconstituted expression of rH3-K9R blocked EGF-induced expression of cyclin D1 and c-Myc at both mRNA and protein expression levels (Figures 4E, 4F, S6B). In line with our previous finding that PKM2 kinase activity is required for EGF-induced cyclin D1 expression (Yang et al., 2011), reconstituted expression of PKM2 K367M, compared with re-expression of its WT counterpart in U87/EGFR cells with depleted endogenous PKM2 (Figure 2E), blocked EGF-induced c-Myc expression (Figure 4G). These results indicate that PKM2 phosphorylates H3-T11 at CCND1 and MYC promoter regions, which is required for subsequent H3-K9 acetylation and transcription of the genes.
PKM2-Dependent H3-T11 Phosphorylation Is Required for Cell Cycle Progression, Cell Proliferation, and Tumorigenesis
Cyclin D1 expression is required for the G1-S phase transition (Resnitzky and Reed, 1995). To examine whether PKM2-dependent H3-T11 phosphorylation, which promotes cyclin D1 expression, regulates the G1-S phase transition, we reconstituted the expression of RNAi-resistant WT histone rH3 or rH3-T11A in endogenous histone H3–depleted U87 cells expressing a constitutively active EGFRvIII mutant (Figure 5A). As shown in Figure 5B, expression of histone rH3-T11A, compared with expression of WT histone rH3, resulted in accumulation of U87/EGFRvIII cells in the G0/G1 phase, as determined by flow cytometric analyses. In addition, expression of histone rH3-T11A, in contrast to expression of its WT counterpart, inhibited cell proliferation (Figure 5C). The inhibitory effect on cell cycle progression and cell proliferation was also observed by depletion of both PKM1 and PKM2 (Figures S7A, S7B, and S7C) or depletion of PKM2 alone (Figures 5B and 5C) (Yang et al., 2011). These results strongly suggest that PKM2-dependent H3-T11 phosphorylation is required for cell cycle progression and cell proliferation.
Figure 5. PKM2-Dependent H3-T11 Phosphorylation Is Required for Cell Cycle Progression, Cell Proliferation, and Tumor Development.
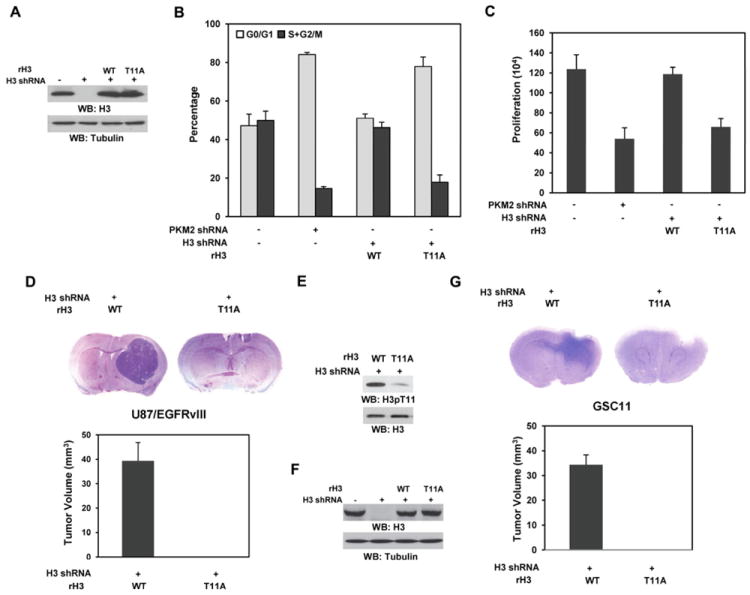
Please also see supplemental Figure S7.
(A) WT rH3 or rH3-T11A expression was reconstituted in U87/EGFRvIII cells with depleted endogenous H3. Immunoblotting analyses were performed with the indicated antibodies.
(B) U87/EGFRvIII cells with depleted PKM2 or endogenous H3 and reconstituted expression of WT rH3 or rH3-T11A were stained with propidium iodide and analyzed for DNA staining profiles by flow cytometry. Data represent the mean ± SD of three independent experiments.
(C) A total number of 2 × 10⁴ U87/EGFRvIII cells with depleted PKM2 or endogenous H3 and reconstituted expression of WT rH3 or rH3-T11A were plated and counted 7 days after seeding in DMEM with 2% bovine calf serum. Data represent the mean ± SD of three independent experiments.
(D, E, F, G) A total of 5 × 10⁵ endogenous histone H3–depleted U87/EGFRvIII (D, E) or GSC11 (F, G) cells with reconstituted expression of WT rH3 or rH3-T11A were intracranially injected into athymic nude mice for each group. The mice were sacrificed and examined for tumor growth. H&E-stained coronal brain sections show representative tumor xenografts. Tumor volumes were measured by using length (a) and width (b) and calculated using the equation: V = ab2/2. Data represent the means ± SD of seven mice. (E) Immunoblotting analysis with anti–phospho-H3-T11 antibody was performed on lysates of the tumor tissue derived from the mice injected with U87/EGFvIII cells with reconstituted expression of WT histone H3 and the counterpart tissue derived form the mice injected with U87/EGFvIII cells with reconstituted expression of histone H3 T11A mutant. (F) WT rH3 or rH3-T11A expression was reconstituted in GSC11 cells with depleted endogenous H3. Immunoblotting analyses were performed with the indicated antibodies.
Depletion of both PKM1 and PKM2 (Figure S7D) or PKM2 alone (Yang et al., 2011) abrogated brain tumorigenesis induced by intracranial injection of U87/EGFRvIII cells. To determine the role of PKM2-dependent H3-T11 phosphorylation in brain tumor development, we intracranially injected endogenous histone H3–depleted U87/EGFRvIII cells with reconstituted expression of WT histone rH3 or histone rH3-T11A mutant. U87/EGFRvIII cells expressing WT histone rH3 elicited rapid tumorigenesis (Figure 5D). In contrast, histone rH3-T11A expression abrogated EGFRvIII-driven tumor growth. In addition, the levels of phosphorylated histone H3 at T11 were higher in the tumor tissue derived from the mice injected with U87/EGFvIII cells with reconstituted expression of WT histone H3 than in the counterpart tissue derived form the mice injected with U87/EGFvIII cells with reconstituted expression of histone H3 T11A (Figure 5E). Similar tumorigenesis results were obtained by using GSC11 human primary GBM cells with endogenous histone H3 depletion and reconstituted expression of WT histone rH3 or rH3-T11A (Figures 5F and 5G). These results indicate that PKM2-dependent H3-T11 phosphorylation is instrumental in EGFR-promoted tumor development.
H3-T11 Phosphorylation Positively Correlates with the Level of Nuclear PKM2 Expression and with Grades of Glioma Malignancy and Prognosis
The nuclear expression level of PKM2 correlates with poor GBM prognosis (Yang et al., 2011). To further define the clinical relevance of our finding that nuclear PKM2 phosphorylates H3-T11 upon EGFR activation, we used IHC analyses to examine the activity levels of EGFR reflected by their phosphorylation levels, H3-T11 phosphorylation, and PKM2 nuclear localization in serial sections of 45 human primary GBM specimens (World Health Organization [WHO] grade IV). The antibody specificities were validated by using IHC analyses with specific blocking peptides (data not shown). As shown in Figure 6A, levels of H3-T11 phosphorylation, nuclear PKM2 expression, and EGFR activity were correlated with each other. Quantification of the staining on a scale of 0 to 8.0 showed that these correlations were significant (Figure 6B).
Figure 6. H3-T11 Phosphorylation Positively Correlates with the Level of Nuclear PKM2 Expression and with Grades of Glioma Malignancy and Prognosis.
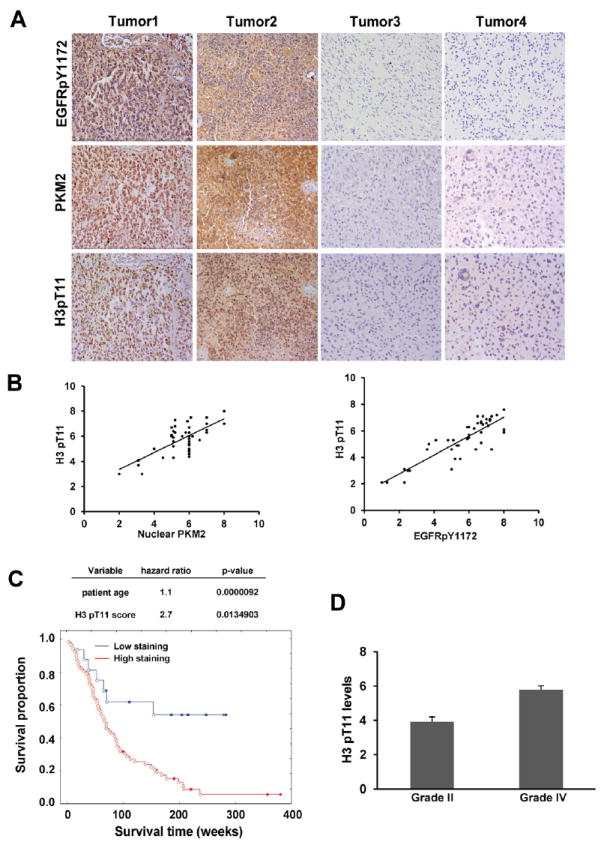
(A, B) Immunohistochemical staining with anti–phospho-EGFR Y1172, anti–phospho-H3-T11, and anti-PKM2 antibodies was performed on 45 GBM specimens. Representative photos of four tumors are shown (A). Semiquantitative scoring was performed (Pearson product moment correlation test; r = 0.704, p < 0.0001, left panel; r = 0.86, p < 0.001, right panel). Note that some of the dots on the graphs represent more than one specimen (some scores overlapped) (B).
(C) The survival times for 85 patients with low (0-4 staining scores, blue curve) versus high (4.1-8 staining scores, red curve) H3-T11 phosphorylation (low, 16 patients; high, 69 patients) were compared. The table (top panel) shows the multivariate analysis after adjustment for patient age, indicating the significance level of the association of H3-T11 phosphorylation (p = 0.01349038) with patient survival. Empty circles represent deceased patients, and filled circles represent censored (alive at last clinical follow-up) patients.
(D) Thirty diffuse astrocytoma specimens were immunohistochemically stained with anti–phospho-H3-T11 antibody, and specimens were compared with 45 stained GBM specimens (Student’s t test, two tailed, p < 0.001). Data represent the mean ± SD of and 30 stained astrocytoma specimens and 45 stained GBM specimens.
We compared survival durations of 85 patients, all of whom received standard adjuvant radiotherapy after surgery, followed by treatment with an alkylating agent (temozolomide in most cases), with low (0-4 staining) versus high (4.1-8 staining) H3-T11 phosphorylation. Patients whose tumors had low H3-T11 phosphorylation (16 cases) had a median survival that was not reached; those whose tumors had high levels of H3-T11 phosphorylation (69 cases) had a significantly lower median survival duration of 77 weeks. In a Cox multivariate model, the IHC score of H3-T11 phosphorylation (Figure 6C, p = 0.013490) was an independent predictor of GBM patient survival, after adjusting for patient age, a relevant clinical covariate. These results support a role for PKM2-dependent H3-T11 phosphorylation in the clinical behavior of human GBM and reveal a relationship between H3-T11 phosphorylation and clinical aggressiveness of the tumor. To further explore this relationship, we examined whether the levels of H3-T11 phosphorylation correlated with the grades of glioma malignancy. Levels of H3-T11 phosphorylation in samples from patients (30 cases) with low-grade diffuse astrocytoma (WHO grade II; median survival time >5 years) were compared with those from patients with high-grade GBM (Furnari et al., 2007). IHC analysis showed significantly lower levels of H3-T11 phosphorylation in low-grade tumors than were present in GBM specimens (Figure 6D).
DISCUSSION
PKM2, a glycolytic enzyme with a key role in the Warburg effect (Christofk et al., 2008a; Mellati et al., 1992), also processes nonmetabolic functions and plays a critical role in regulating gene transcription (Yang et al., 2011). However, the mechanisms underlying PKM2-regulated transcriptional control of gene expression are not known. In this report, we demonstrate that PKM2, functioning as a protein kinase, interacts with histone H3 and phosphorylates H3-T11, which leads to HDAC3 removal from CCND1 and MYC promoter regions and subsequently to K9 acetylation and gene transcription.
These findings, together with those from previous reports, significantly enrich our understanding of the physiological role of PKM2 in tumor development by revealing its two integrated functions: 1) PKM2 act as a glycolytic enzyme transferring a phosphate group from PEP to ADP for ATP generation and pyruvate production. It is also a rate-limiting controller of glycolysis needed for generation of glucose metabolites to synthesize amino acids, phospholipids, and nucleic acids, which are building blocks for cell growth and cell proliferation (Hsu and Sabatini, 2008; Koppenol et al., 2011; Vander Heiden et al., 2009). 2) PKM2 acts as a protein kinase phosphorylating histone for gene transcription, which directly controls cell cycle progression and cell proliferation (Yang et al., 2011). This line of evidence establishes PKM2 as a unique and key regulator of cancer development by virtue of its coordination of ATP generation, macromolecular syntheses, and gene transcription via both metabolic and nonmetabolic functions.
EGFR activation results in the nuclear translocation of PKM2, but not PKM1 (Yang et al., 2011), which restricts the accessibility of PKM1 to histone. PEP participates in the phosphorylation of H11 in phosphoglycerate mutase (PGAM1), but not through PKM2 acting as a PGAM1 kinase (Vander Heiden et al., 2010). Given that PKM2 phosphorylates Stat3 at Y705 (to activate transcription of MEK5) (Gao et al., 2012) and histone H3 at T11, PKM2 is apparently a dual-specificity protein kinase, acting as both a tyrosine protein kinase and a serine/threonine protein kinase. It has been reported that histone H3-T11 can be phosphorylated by several protein kinases (Shimada et al., 2008) (Metzger et al., 2008; Preuss et al., 2003). Dlk/DAPK3/ZIPK phosphorylates H3-T11 in mitosis. However, the role of H3-T11 phosphorylation in mitosis is not clear (Preuss et al., 2003). Basal Chk1 activity was reported for phosphorylation of H3-T11 in interphase, and DNA damage, which phosphorylates and activates Chk1, causes the dissociation of Chk1 from chromatin and H3-T11 dephosphorylation (Shimada et al., 2008). In addition, androgen stimulation enhances H3-T11 phosphorylation in prostate cancer cells in a PRK1/PKN1-dependent manner (Metzger et al., 2008). However, depletion of DAPK3, Chk1, or PRK1/PKN1 did not affect EGF-induced H3-T11 phosphorylation, further supporting the idea that nuclear translocation of PKM2 induced by EGFR activation plays a critical role in H3-T11 phosphorylation, which promotes G1-S phase transition and cell cycle progression.
EGFR activation results in GSK-3β–independent β-catenin transactivation by mechanisms distinct from Wnt-dependent canonical signaling (Fang et al., 2007; Ji et al., 2009; Lu et al., 2003; Lu and Hunter, 2004; Yang et al., 2011). EGFR activation results in nuclear translocation of PKM2, which interacts with Y333-phosphorylated β-catenin (Yang et al., 2011). This protein complex binds to the CCND1 and MYC promoter regions, where PKM2 phosphorylates H3-T11, leading to HDAC3 disassociation from the promoters and subsequent acetylation of histone H3, transcription of genes, cycle progression, and cell proliferation (Figure 7). The finding that PKM2-dependent H3-T11 phosphorylation, which regulates total cellular histone H3 acetylation levels, is required for tumor cell proliferation and tumorigenesis, and that the levels of H3-T11 phosphorylation and nuclear PKM2 (Yang et al., 2011) correlate with grades of glioma malignancy and prognosis, may provide a molecular basis for improved diagnosis and treatment of tumors with activated EGFR and upregulated PKM2.
Figure 7. PKM2 regulates gene expression by H3-T11 Phosphorylation.

EGFR activation results in nuclear translocation of PKM2 that binds to gene promoter regions, where PKM2 phosphorylates H3-T11, leading to HDAC3 disassociation from the promoters and subsequent acetylation of histone H3, transcription of genes, cell cycle progression, and cell proliferation.
EXPERIMENTAL PROCEDURES
Materials
Rabbit polyclonal antibodies recognizing phospho-histone H3 T11, phospho-histone H3 S10, phospho-EGFR Y1172, PKM1, PKM2, and c-Myc were obtained from Signalway Biotechnology (Pearland, TX). Rabbit polyclonal antibodies recognizing histone H3, histone H2A, tri-methyl-histone H3 K36, tri-methyl-histone H3 K79, and phospho-histone H3 T11 were obtained from Abcam (Cambridge, MA). Mouse antibodies recognizing phospho-tyrosine and phospho-serine were obtained from BD Biosciences (Bedford, MA). Polyclonal antibodies for Chk1, PKN1, cyclin D1, and PCNA and a monoclonal antibody for phospho-threonine were purchased from Santa Cruz Biotechnology (Santa Cruz, CA). EGF and mouse monoclonal antibodies for Flag, His, DAPK3, and tubulin were purchased from Sigma (St. Louis, MO). A polyclonal antibody specific for acetylated histone H3 K9, a monoclonal antibody for HDAC3, hygromycin, puromycin, G418, DNase-free RNase A, and propidium iodide were purchased from EMD Biosciences (San Diego, CA). HyFect transfection reagents were from Denville Scientific (Metuchen, NJ). GelCode Blue Stain Reagent was obtained from Pierce (Rockford, IL). Purified histone H3 was from New England Biolab (Ipswich, MA).
Cells and Cell Culture Conditions
U87, U87/EGFR, and U251 GBM cells and 293T cells were maintained in Dulbecco’s modified Eagle’s medium (DMEM) supplemented with 10% bovine calf serum (HyClone, Logan, UT). Human primary GSC11 GBM cells were maintained in DMEM/F-12 50/50 supplemented with B27, EGF (10 ng/ml), and bFGF (10 ng/ml). Cell cultures were made quiescent by growing them to confluence, and the medium was replaced with fresh medium containing 0.5% serum for 1 day. EGF at a final concentration of 100 ng/ml was used for cell stimulation.
Transfection
Cells were plated at a density of 4 × 10⁵/60-mm dish at 18 h before transfection. Transfection was performed as previously described (Xia et al., 2007).
Mass Spectrometry Analysis
An in vitro PKM2-phosphorylated sample of purified H3 was exhaustively acetylated with acetic anhydride and triethylamine in acetonitrile, evaporated to dryness, then resuspended in 50 mM ammonium bicarbonate buffer containing Rapigest (Waters Corp, MA). The sample was heated to 95°C for 10 min and then allowed to cool; 100 ng of sequencing-grade modified trypsin (Promega, Madison, WI) was added. The digestion proceeded overnight at 37°C and was analyzed by LC-MS/MS on an Obitrap-XL mass spectrometer (Thermo Fisher Scientific, Waltham, MA).
Proteins were identified by a database search of the fragment spectra against the National SwissProt protein database (EBI) using Mascot v.2.3 (Matrix Science, London, UK) and Sequest (v.1.20) via Proteome Discoverer v.1.3. (Thermo Fisher Scientific). Phosphopeptide matches were analyzed by using PhosphoRS implemented in Proteome Discoverer and manually curated (Taus et al., 2011).
Immunoprecipitation and Immunoblotting Analysis
Extraction of proteins with a modified buffer from cultured cells was followed by immunoprecipitation and immunoblotting with corresponding antibodies as described previously (Lu et al., 1998). Protein levels were quantified through densitometry. Data represent the mean ± SD of three independent experiments.
Cell Proliferation Assay
A total of 2 × 10⁴ cells were plated and counted 7 days after seeding in DMEM with 0.5% bovine calf serum. Data represent the mean ± SD of three independent experiments.
DNA Constructs and Mutagenesis
Polymerase chain reaction (PCR)-amplified human PKM2 was cloned into pcDNA3.1/hygro (+) vector between BamH I and Not I. pcDNA 3.1/hygro (+)-PKM2 K367M, pcDNA 3.1/hygro (+)-Histone H3 K4R, -K9R, -T3A, -T6A, and −T11A were made by using the QuikChange site-directed mutagenesis kit (Stratagene, La Jolla, CA). pcDNA 3.1-rPKM2 contains non-sense mutations of C1170T, C1173T, T1174C, and G1176T.
The pGIPZ control was generated with control oligonucleotide GCTTCTAACACCGGAGGTCTT. pGIPZ PKM2 shRNA was generated with CATCTACCACTTGCAATTA oligonucleotide targeting exon 10 of the PKM2 transcript. pGIPZ PKM1/2 shRNA was generated with GATTATCAGCAAAATCGAG. pGIPZ Histone H3 shRNA was generated with CCTATGAAAGGATGCAATA. pGIPZ Chk1 shRNA was generated with GCAACAGTATTTCGGTATA. pGIPZ DAPK3 shRNA was generated with AAGCAGGAGACGCTCACCA. pGIPZ PKN1 shRNA was generated with CCCGGACCACGGGTGACAT.
Flow Cytometric Analysis
A total of 1 × 10⁶ treated cells were fixed in cold 70% ethanol for 3 h, spun down, and incubated for 1 h at 37°C in PBS with DNase-free RNase A (100 μg/ml) and propidium iodide (50 μg/ml). Cells were then analyzed with use of a fluorescence-activated cell sorter (FACS). Data represent the mean ± SD of three independent experiments.
Purification of Recombinant Proteins
The WT and mutants of His-PKM2, His-PKM1, and His-histone H3 and GST-HDAC3 were expressed in bacteria and purified as described previously (Xia et al., 2007).
In Vitro Kinase Assays
The kinase reactions were performed as described previously (Fang et al., 2007; Vander Heiden et al., 2010). In brief, the bacterially purified recombinant PKM2 (200 ng) were incubated with histone H3 (100 ng) with kinase buffer (50 mM Tris-HCl [pH 7.5], 100 mM KCl, 50 mM MgCl2, 1 mM Na3VO4, 1 mM DTT, 5% glycerol, 0.5 mM PEP, 0.05 mM FBP) in 25 μl at 25°C for 1 h. The reactions were terminated by the addition of sodium dodecyl sulfate–polyacrylamide gel electrophoresis (SDS-PAGE) loading buffer and heated to 100°C. The reaction mixtures were then subjected to SDS-PAGE analyses.
ChIP Assay
ChIP was performed by using SimpleChIP® Enzymatic Chromatin IP Kits. Chromatin prepared from cells (in a 10-cm dish) was used to determine total DNA input and for overnight incubation with the specific antibodies or with normal rabbit or mouse immunoglobulin G. The human CCND1 promoter-specific primers used in PCR were 5′-GGGGCGATTTGCATTTCTAT-3′ (forward) and 5′-CGGTCGTTGAGGAGGTTGG-3′ (reverse). MYC promoter-specific primers were 5′-CAGCCCGAGACTGTTGC-3′ (forward) and 5′-CAGAGCGTGGGATGTTAG-3′ (reverse).
Immunofluorescence Analysis
Immunofluorescence analyses were performed as described previously (Fang et al., 2007).
Immunohistochemical Analysis
Mouse tumor tissues were fixed and prepared for staining. The specimens were stained with Mayer’s hematoxylin and subsequently with eosin (Biogenex Laboratories, San Ramon, CA). Afterward, the slides were mounted with use of a Universal Mount (Research Genetics Huntsville, AL).
The tissue sections from paraffin-embedded human GBM and astrocytoma specimens were stained with antibodies against phospho-histone H3 T11, PKM2, or nonspecific IgG as a negative control. We quantitatively scored the tissue sections according to the percentage of positive cells and staining intensity, as previously defined (Ji et al., 2009). We assigned the following proportion scores: 0 if 0% of the tumor cells showed positive staining, 1 if 0% to 1% of cells were stained, 2 if 2% to 10% were stained, 3 if 11% to 30% were stained, 4 if 31% to 70% were stained, and 5 if 71% to 100% were stained. We rated the intensity of staining on a scale of 0 to 3: 0, negative; 1, weak; 2, moderate; and 3, strong. We then combined the proportion and intensity scores to obtain a total score (range, 0–8), as described previously (Ji et al., 2009). Scores were compared with overall survival, defined as the time from date of diagnosis to death or last known date of follow-up. All patients received standard adjuvant radiotherapy after surgery, followed by treatment with an alkylating agent (temozolomide in most cases). The use of human brain tumor specimens and the database was approved by the Institutional Review Board at MD Anderson Cancer Center. Data represent the mean ± SD of 45 stained GBM specimens and 30 stained astrocytoma specimens.
Statistical Analysis
We determined the significance of differences in the human glioma data using Pearson’s correlation test and Student’s t test (two-tailed). p < 0.05 was considered to be significant.
Intracranial Injection
We intracranially injected 5 × 10⁵ GBM cells (in 5 μl of DMEM per mouse) with endogenous histone H3 depletion and reconstituted expression of histone H3 WT or T11V into 4-week-old female athymic nude mice. The intracranial injections were performed as described in a previous publication (Gomez-Manzano et al., 2006). Seven mice per group in each experiment were included. Animals injected with U87/EGFRvIII or GSC11 cells were sacrificed 14 or 30 days after glioma cell injection, respectively. The brain of each mouse was harvested, fixed in 4% formaldehyde, and embedded in paraffin. Tumor formation and phenotype were determined by histologic analysis of H&E-stained sections. Data represent the means ± SD of seven mice.
Quantitative Real-Time PCR
Total RNA was extracted with use of an RNA High-purity Total RNA Rapid Extraction Kit (Signalway Biotechnology). cDNA was prepared by using oligonucleotide (dT), random primers, and a Thermo Reverse Transcription kit (Signalway Biotechnology). Quantitative real-time PCR analysis was performed using 2 × SIBR real-time PCR Premixture (Signalway Biotechnology) under the following conditions: 5 min at 95°C followed by 40 cycles at 95°C for 30 s, 55°C for 40 s, and 72°C for 1 min using an ABI Prism 7700 sequence detection system. Data were normalized to expression of a control gene (β-actin) for each experiment. Data represent the mean ± SD of three independent experiments.
The following primer pairs were used for quantitative real-time PCR: CCND1, 5′-GCGAGGAACAGAAGTGC-3′ (forward) and 5′-GAGTTGTCGGTGTAGATGC-3′ (reverse); MYC, 5′-ACACCCTTCTCCCTTCG-3′ (forward) and 5′-CCGCTCCACATACAGTCC-3′ (reverse); β-actin, 5′-ATGGATGACGATATCGCTGCGC-3′ (forward) and 5′-GCAGCACAGGGTGCTCCTCA-3′ (reverse).
Supplementary Material
HIGHLIGHTS.
PKM2 binds to and phosphorylates H3-T11.
PKM2-dependent H3-T11 phosphorylation is required for H3-K9 acetylation.
H3-T11 phosphorylation is required for gene expression and tumorigenesis.
H3-T11 phosphorylation levels correlate with glioma malignancy and prognosis.
Acknowledgments
This work was supported by National Cancer Institute grants 2R01CA109035 (Z.L.), 5 P50 CA127001-03, and CA16672 (Cancer Center Support Grant); a research grant (RP110252; Z. L.) from the Cancer Prevention and Research Institute of Texas (CPRIT), an American Cancer Society Research Scholar Award RSG-09-277-01-CSM (Z.L.), and a Sister Institution Network Fund from The University of Texas MD Anderson Cancer Center (Z.L.). T.H. is a Frank and Else Schilling American Cancer Society Professor, and work in his group was supported by National Cancer Institute grant 2R01CA082683.
Footnotes
Publisher's Disclaimer: This is a PDF file of an unedited manuscript that has been accepted for publication. As a service to our customers we are providing this early version of the manuscript. The manuscript will undergo copyediting, typesetting, and review of the resulting proof before it is published in its final citable form. Please note that during the production process errors may be discovered which could affect the content, and all legal disclaimers that apply to the journal pertain.
References
- Altenberg B, Greulich KO. Genes of glycolysis are ubiquitously overexpressed in 24 cancer classes. Genomics. 2004;84:1014–1020. doi: 10.1016/j.ygeno.2004.08.010. [DOI] [PubMed] [Google Scholar]
- Baek SH. When signaling kinases meet histones and histone modifiers in the nucleus. Mol Cell. 2011;42:274–284. doi: 10.1016/j.molcel.2011.03.022. [DOI] [PubMed] [Google Scholar]
- Cairns RA, Harris IS, Mak TW. Regulation of cancer cell metabolism. Nat Rev Cancer. 2011;11:85–95. doi: 10.1038/nrc2981. [DOI] [PubMed] [Google Scholar]
- Christofk HR, Vander Heiden MG, Harris MH, Ramanathan A, Gerszten RE, Wei R, Fleming MD, Schreiber SL, Cantley LC. The M2 splice isoform of pyruvate kinase is important for cancer metabolism and tumour growth. Nature. 2008a;452:230–233. doi: 10.1038/nature06734. [DOI] [PubMed] [Google Scholar]
- Christofk HR, Vander Heiden MG, Wu N, Asara JM, Cantley LC. Pyruvate kinase M2 is a phosphotyrosine-binding protein. Nature. 2008b;452:181–186. doi: 10.1038/nature06667. [DOI] [PubMed] [Google Scholar]
- Dombrauckas JD, Santarsiero BD, Mesecar AD. Structural basis for tumor pyruvate kinase M2 allosteric regulation and catalysis. Biochemistry. 2005;44:9417–9429. doi: 10.1021/bi0474923. [DOI] [PubMed] [Google Scholar]
- Fang D, Hawke D, Zheng Y, Xia Y, Meisenhelder J, Nika H, Mills GB, Kobayashi R, Hunter T, Lu Z. Phosphorylation of beta-catenin by AKT promotes beta-catenin transcriptional activity. J Biol Chem. 2007;282:11221–11229. doi: 10.1074/jbc.M611871200. [DOI] [PMC free article] [PubMed] [Google Scholar]
- Furnari FB, Fenton T, Bachoo RM, Mukasa A, Stommel JM, Stegh A, Hahn WC, Ligon KL, Louis DN, Brennan C, et al. Malignant astrocytic glioma: genetics, biology, and paths to treatment. Genes Dev. 2007;21:2683–2710. doi: 10.1101/gad.1596707. [DOI] [PubMed] [Google Scholar]
- Gao X, Wang H, Yang JJ, Liu X, Liu ZR. Pyruvate kinase m2 regulates gene transcription by acting as a protein kinase. Mol Cell. 2012;45:598–609. doi: 10.1016/j.molcel.2012.01.001. [DOI] [PMC free article] [PubMed] [Google Scholar]
- Gomez-Manzano C, Alonso MM, Yung WK, McCormick F, Curiel DT, Lang FF, Jiang H, Bekele BN, Zhou X, Alemany R, et al. Delta-24 increases the expression and activity of topoisomerase I and enhances the antiglioma effect of irinotecan. Clin Cancer Res. 2006;12:556–562. doi: 10.1158/1078-0432.CCR-05-1892. [DOI] [PubMed] [Google Scholar]
- Hoshino A, Hirst JA, Fujii H. Regulation of cell proliferation by interleukin-3-induced nuclear translocation of pyruvate kinase. J Biol Chem. 2007;282:17706–17711. doi: 10.1074/jbc.M700094200. [DOI] [PubMed] [Google Scholar]
- Hsu PP, Sabatini DM. Cancer cell metabolism: Warburg and beyond. Cell. 2008;134:703–707. doi: 10.1016/j.cell.2008.08.021. [DOI] [PubMed] [Google Scholar]
- Ji H, Wang J, Nika H, Hawke D, Keezer S, Ge Q, Fang B, Fang X, Fang D, Litchfield DW, et al. EGF-induced ERK activation promotes CK2-mediated disassociation of alpha-Catenin from beta-Catenin and transactivation of beta-Catenin. Mol Cell. 2009;36:547–559. doi: 10.1016/j.molcel.2009.09.034. [DOI] [PMC free article] [PubMed] [Google Scholar]
- Koppenol WH, Bounds PL, Dang CV. Otto Warburg’s contributions to current concepts of cancer metabolism. Nat Rev Cancer. 2011;11:325–337. doi: 10.1038/nrc3038. [DOI] [PubMed] [Google Scholar]
- Lee J, Kim HK, Han YM, Kim J. Pyruvate kinase isozyme type M2 (PKM2) interacts and cooperates with Oct-4 in regulating transcription. Int J Biochem Cell Biol. 2008;40:1043–1054. doi: 10.1016/j.biocel.2007.11.009. [DOI] [PubMed] [Google Scholar]
- Lee JS, Smith E, Shilatifard A. The language of histone crosstalk. Cell. 2010;142:682–685. doi: 10.1016/j.cell.2010.08.011. [DOI] [PMC free article] [PubMed] [Google Scholar]
- Lu Z. Nonmetabolic functions of pyruvate kinase isoform M2 in controlling cell cycle progression and tumorigenesis. Chin J Cancer. 2012;31:5–7. doi: 10.5732/cjc.011.10446. [DOI] [PMC free article] [PubMed] [Google Scholar]
- Lu Z, Ghosh S, Wang Z, Hunter T. Downregulation of caveolin-1 function by EGF leads to the loss of E-cadherin, increased transcriptional activity of beta-catenin, and enhanced tumor cell invasion. Cancer Cell. 2003;4:499–515. doi: 10.1016/s1535-6108(03)00304-0. [DOI] [PubMed] [Google Scholar]
- Lu Z, Hunter T. Wnt-independent beta-catenin transactivation in tumor development. Cell Cycle. 2004;3:571–573. [PubMed] [Google Scholar]
- Lu Z, Liu D, Hornia A, Devonish W, Pagano M, Foster DA. Activation of protein kinase C triggers its ubiquitination and degradation. Mol Cell Biol. 1998;18:839–845. doi: 10.1128/mcb.18.2.839. [DOI] [PMC free article] [PubMed] [Google Scholar]
- Luo W, Hu H, Chang R, Zhong J, Knabel M, O’Meally R, Cole RN, Pandey A, Semenza GL. Pyruvate Kinase M2 Is a PHD3-Stimulated Coactivator for Hypoxia-Inducible Factor 1. Cell. 2011;145:732–744. doi: 10.1016/j.cell.2011.03.054. [DOI] [PMC free article] [PubMed] [Google Scholar]
- Majumder PK, Febbo PG, Bikoff R, Berger R, Xue Q, McMahon LM, Manola J, Brugarolas J, McDonnell TJ, Golub TR, et al. mTOR inhibition reverses Akt-dependent prostate intraepithelial neoplasia through regulation of apoptotic and HIF-1-dependent pathways. Nat Med. 2004;10:594–601. doi: 10.1038/nm1052. [DOI] [PubMed] [Google Scholar]
- Mazurek S. Pyruvate kinase type M2: a key regulator within the tumour metabolome and a tool for metabolic profiling of tumours. Ernst Schering Found Symp Proc. 2007:99–124. doi: 10.1007/2789_2008_091. [DOI] [PubMed] [Google Scholar]
- Mazurek S, Boschek CB, Hugo F, Eigenbrodt E. Pyruvate kinase type M2 and its role in tumor growth and spreading. Semin Cancer Biol. 2005;15:300–308. doi: 10.1016/j.semcancer.2005.04.009. [DOI] [PubMed] [Google Scholar]
- Mellati AA, Yucel M, Altinors N, Gunduz U. Regulation of M2-type pyruvate kinase from human meningioma by allosteric effectors fructose 1,6 diphosphate and L-alanine. Cancer Biochem Biophys. 1992;13:33–41. [PubMed] [Google Scholar]
- Metzger E, Yin N, Wissmann M, Kunowska N, Fischer K, Friedrichs N, Patnaik D, Higgins JM, Potier N, Scheidtmann KH, et al. Phosphorylation of histone H3 at threonine 11 establishes a novel chromatin mark for transcriptional regulation. Nat Cell Biol. 2008;10:53–60. doi: 10.1038/ncb1668. [DOI] [PMC free article] [PubMed] [Google Scholar]
- Moscatello DK, Holgado-Madruga M, Godwin AK, Ramirez G, Gunn G, Zoltick PW, Biegel JA, Hayes RL, Wong AJ. Frequent expression of a mutant epidermal growth factor receptor in multiple human tumors. Cancer Res. 1995;55:5536–5539. [PubMed] [Google Scholar]
- Nicholson RI, Gee JM, Harper ME. EGFR and cancer prognosis. Eur J Cancer. 2001;37(Suppl 4):S9–15. doi: 10.1016/s0959-8049(01)00231-3. [DOI] [PubMed] [Google Scholar]
- Noguchi T, Inoue H, Tanaka T. The M1- and M2-type isozymes of rat pyruvate kinase are produced from the same gene by alternative RNA splicing. J Biol Chem. 1986;261:13807–13812. [PubMed] [Google Scholar]
- Perez-Cadahia B, Drobic B, Davie JR. H3 phosphorylation: dual role in mitosis and interphase. Biochem Cell Biol. 2009;87:695–709. doi: 10.1139/O09-053. [DOI] [PubMed] [Google Scholar]
- Preuss U, Landsberg G, Scheidtmann KH. Novel mitosis-specific phosphorylation of histone H3 at Thr11 mediated by Dlk/ZIP kinase. Nucleic Acids Res. 2003;31:878–885. doi: 10.1093/nar/gkg176. [DOI] [PMC free article] [PubMed] [Google Scholar]
- Resnitzky D, Reed SI. Different roles for cyclins D1 and E in regulation of the G1-to-S transition. Mol Cell Biol. 1995;15:3463–3469. doi: 10.1128/mcb.15.7.3463. [DOI] [PMC free article] [PubMed] [Google Scholar]
- Shimada M, Nakanishi M. Checkpoints meet the transcription at a novel histone milestone (H3-T11) Cell Cycle. 2008;7:1555–1559. doi: 10.4161/cc.7.11.6062. [DOI] [PubMed] [Google Scholar]
- Shimada M, Niida H, Zineldeen DH, Tagami H, Tanaka M, Saito H, Nakanishi M. Chk1 is a histone H3 threonine 11 kinase that regulates DNA damage-induced transcriptional repression. Cell. 2008;132:221–232. doi: 10.1016/j.cell.2007.12.013. [DOI] [PubMed] [Google Scholar]
- Stetak A, Veress R, Ovadi J, Csermely P, Keri G, Ullrich A. Nuclear translocation of the tumor marker pyruvate kinase M2 induces programmed cell death. Cancer Res. 2007;67:1602–1608. doi: 10.1158/0008-5472.CAN-06-2870. [DOI] [PubMed] [Google Scholar]
- Suganuma T, Workman JL. Crosstalk among Histone Modifications. Cell. 2008;135:604–607. doi: 10.1016/j.cell.2008.10.036. [DOI] [PubMed] [Google Scholar]
- Taus T, Kocher T, Pichler P, Paschke C, Schmidt A, Henrich C, Mechtler K. Universal and confident phosphorylation site localization using phosphoRS. J Proteome Res. 2011;10:5354–5362. doi: 10.1021/pr200611n. [DOI] [PubMed] [Google Scholar]
- Vander Heiden MG, Cantley LC, Thompson CB. Understanding the Warburg effect: the metabolic requirements of cell proliferation. Science. 2009;324:1029–1033. doi: 10.1126/science.1160809. [DOI] [PMC free article] [PubMed] [Google Scholar]
- Vander Heiden MG, Locasale JW, Swanson KD, Sharfi H, Heffron GJ, Amador-Noguez D, Christofk HR, Wagner G, Rabinowitz JD, Asara JM, et al. Evidence for an alternative glycolytic pathway in rapidly proliferating cells. Science. 2010;329:1492–1499. doi: 10.1126/science.1188015. [DOI] [PMC free article] [PubMed] [Google Scholar]
- Williamson JR, Kreisberg RA, Felts PW. Mechanism for the stimulation of gluconeogenesis by fatty acids in perfused rat liver. Proc Natl Acad Sci U S A. 1966;56:247–254. doi: 10.1073/pnas.56.1.247. [DOI] [PMC free article] [PubMed] [Google Scholar]
- Wykosky J, Fenton T, Furnari F, Cavenee WK. Therapeutic targeting of epidermal growth factor receptor in human cancer: successes and limitations. Chin J Cancer. 2011;30:5–12. doi: 10.5732/cjc.010.10542. [DOI] [PMC free article] [PubMed] [Google Scholar]
- Xia Y, Wang J, Liu TJ, Yung WK, Hunter T, Lu Z. c-Jun downregulation by HDAC3-dependent transcriptional repression promotes osmotic stress-induced cell apoptosis. Mol Cell. 2007;25:219–232. doi: 10.1016/j.molcel.2007.01.005. [DOI] [PMC free article] [PubMed] [Google Scholar]
- Yang W, Xia Y, Ji H, Zheng Y, Liang J, Huang W, Gao X, Aldape K, Lu Z. Nuclear PKM2 regulates beta-catenin transactivation upon EGFR activation. Nature. 2011;480:118–122. doi: 10.1038/nature10598. [DOI] [PMC free article] [PubMed] [Google Scholar]
Associated Data
This section collects any data citations, data availability statements, or supplementary materials included in this article.