Abstract
Recent evidence suggests that cytomegalovirus infection contributes to the development of medulloblastomas. Differential activation of antiviral expression programs in medulloblastomas has not been investigated yet. In this study, we assess the relevance of an antiviral transcriptional response in medulloblastomas. We analyzed a gene expression signature of type I interferon response in three public gene expression data sets of medulloblastomas. Interferon response genes were found to be significantly coordinately regulated in two independent studies. We distilled a signature of 10 interferon response genes from two data sets. This signature exhibited strongly significant gene-versus-gene correlation of expression levels across samples in a third external medulloblastoma data set. Our medulloblastoma IFN signature identified a previously unrecognized patient subgroup partially overlapping the WNT and SHH subtypes proposed by others. We conclude that significant traces of differential activation of antiviral transcriptional response can be found in three independent medulloblastoma patient cohorts. This IFN activation signal often coincides with reduced proliferation scores. Our proposed 10-gene type I IFN response gene signature could help to assess antiviral states in further gene expression data sets of medulloblastomas or other cancers.
Introduction
Medulloblastoma is one of the most frequent brain tumors in childhood and a major cause of morbidity in children because of its frequent malignancy [1,2]. It comprises molecularly diverse subtypes that can be characterized by mutations or deletions in known cancer pathways like the Sonic Hedgehog pathway (SHH, in genes PTCH1, SUFU) [3,4] and Wnt pathway (in genes CTNNB1, APC, AXIN1, AXIN2) [5–9], by high-level amplification of MYC, MYCL, or MYCN, by large chromosomal imbalances affecting chromosome 17, in particular isochromosome 17q, or many further genetic lesions of unknown relevance [2,10–15]. Several studies addressed the problem of medulloblastoma subtyping by massive genomic data [16–21]. A recent consensus conference concluded that medulloblastoma molecular subtypes currently can be best described by the four major transcriptional phenotypes of medulloblastomas: the WNT and SHH pathway activation subtypes and the less well defined subtypes 3 and 4 [22]. For the WNT subtype, either characteristic pathway mutations such as CTNNB1, APC, AXIN1, and AXIN2, chromosome 6 loss, or yet-unknown changes can lead to a characteristic transcriptional phenotype of WNT pathway activation that coincides with a particularly good prognosis. Similarly, the SHH transcriptional phenotype segregates with mutations in SHH pathway genes such as PTCH1 or SUFU and characterizes a more aggressive phenotype. Subtypes 3 and 4 are less strictly well defined by distinct genetic lesions [21,22]. Exclusively, groups 3 and 4 tumors seem to have isochromosomes 17q and high OTX2 gene expression. Group 3 (and WNT subtype) tumors have high expression of MYC, whereas isochromosome 17q is most abundant in group 4 tumors [21,22].
However, the approaches taken to identify the main medulloblastoma subtypes are based on data mining techniques that are determined to split patient cohorts in nonoverlapping clusters. Such algorithms are not optimal when overlapping clusters of patients could possibly be discovered through combined transcriptional programs that could arise from co-occurrence of distinct genetic lesions (e.g., WNT plus SHH pathway mutations in same patient) or from other coexisting independent cellular phenomena (e.g., immune activation and mutation). Recently, it was reported that the majority of medulloblastomas is infected by cytomegalovirus (CMV) and that antiviral therapy was effective for CMV-positive—but not CMV-negative—medulloblastomas using in vivo and in vitro models [23]. Based on these findings we hypothesized that, in a considerable fraction of medulloblastomas, a CMV infection can elicit an antiviral response. This response could be traced in microarray expression data sets through specific activation of interferon (IFN) response genes. IFN response signatures have been characterized in diverse contexts also in clinical cancer studies [24–26]. Coordinate up-regulation of IFN signature genes in medulloblastomas would be a sign of viral infection. The sole preliminary evidence for differential immune gene expression is the finding by Cho et al. [19] that among other genes some immune response genes also have a tendency to be expressed higher in one of their six postulated subtypes. However, this finding was not followed up by further analyses (e.g., to characterize and discuss the type and relevance of immune activation) and did not enter the consensus view about the major four medulloblastoma subtypes [22]. In the following, we specifically assess coordinate type I IFN response using published IFN gene signatures and three publicly available medulloblastoma microarray studies that were the basis of the recent proposal of a consensus about medulloblastoma subtypes [16–18]. We show that type I IFN response genes are coordinately activated in medulloblastoma.
Materials and Methods
Data Acquisition and Preprocessing
Microarray expression data was downloaded from Gene Expression Omnibus (GEO) at the National Center for Biotechnology Information (http://www.ncbi.nlm.nih.gov/geo/) with identifier GSE12992 for the data set of Fattet et al. [17] and with identifier GSE10327 for the data set of Kool et al. [18], or from the St. Jude hospital research Web site (http://www.stjuderesearch.org/site/data/medulloblastoma) for the data set of Thompson et al. (44 of 46 CEL files intact) [16]. All calculations were carried out using the R statistics environment (version 2.14.0) supplemented by selected Bioconductor packages (http://www.bioconductor.org/). We condensed Affymetrix DNA chip signals from CEL files on the probeset level using the RMA algorithm as implemented in the affy Bioconductor package resulting in log2 scale probeset intensities. Gene symbols were assigned to probesets using annotation from the Bioconductor package hgu133plus2.db. Probesets with minimal variance of their intensities across all samples of a data set were not considered further (4000 probesets dropped for U133a chip design, 8000 probesets dropped for U133plus2 chip design). Probeset intensities were summarized on the gene level by averaging all remaining probeset intensities of a distinct gene. Expression values of single genes were z normalized (mean centered and standardized) across samples in each data set.
Testing Signature Coherence and Calculation of Signature Scores
For most multigene signatures, it is assumed that their genes change their expression intensities coordinately across samples, that is, they correlate in a particular data set. For permutation-based testing of this property, we defined a coherence score, CS(S,D), of a gene set S in a data set D. The CS is the mean of all pairwise Pearson correlation coefficients between the expression vectors for all possible nonidentical gene pairs in S calculated on data D, thus adopting a value between [-1,+1], with CS = 1 indicating perfect correlation between all genes in S for data D. For signatures under study, we determined CS for different data sets D and contrasted it with CS obtained through data or gene set shuffling. We tested 1) whether the signature under study has a higher CS than randomly selected gene sets of the same size and 2) whether the signature under study has a higher CS on the original data than on data in which each gene's expression vector is permuted independently, thus destroying possible chance correlation structures. We performed these tests using n = 10,000 permutations. Therefore, the minimal reported P value is P < 1e - 4 (on the null hypotheses that CSs of random signatures have equal or higher rank than the CS of the signature under study). Finally, to assign signature expression scores to single samples or patients, the z-normalized log scale intensities of all signature genes in S were averaged per sample, resulting in a single continuous signature expression score per sample.
Results and Discussion
Our hypothesis is that IFN response is differentially activated in medulloblastoma patients and that this can be traced by multigene expression signatures. To define an initial set of IFN response genes, we revisited the results of two studies. In the first study, Baechler et al. [25] found a type I IFN response gene expression signature in peripheral blood that is indicative of active dermatomyositis. The second study by Comabella et al. [26] discovered that an IFN signature in monocytes is associated with poor response to IFN-β therapy in multiple sclerosis. In total, these studies identified a set of 18 type I IFN response genes that we used as a starting point for our analysis (Table W1). We first assessed this signature in the two microarray data sets of Thompson et al. [16] and Fattet et al. [17], for which we could obtain expression data for 44 and 40 tumors, respectively. Of 18 genes, 16 were represented with strong signals in the microarray data from both studies. We used this 16-gene signature as our initial IFN signature—not yet optimized for use in medulloblastoma.
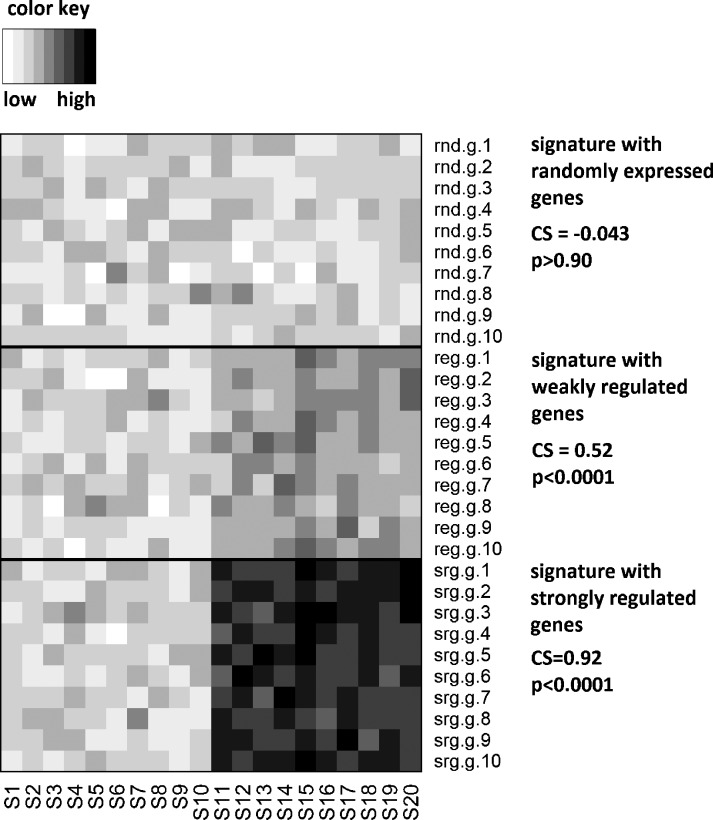
To show that there is significant coordinate up- and down-regulation of IFN signature genes in a distinct data set, we determined a new parameter—the coherence score (CS). This is calculated as the mean of all Pearson correlation coefficients for pairs of gene expression vectors of nonidentical signature genes across samples in a microarray data set. In Figure 1, we give examples of nonregulated (random), weakly regulated, and strongly regulated signatures to illustrate that the coherence score can identify coordinated (coherent) differential up-regulation across samples (see also Figure W1 for diagnostic plots). Note that, for a signature with strong coordinate upregulated in some samples (bottom signature in Figure 1), we yield a CS close to 1, and for a signature with only randomly fluctuating genes, we yield a CS close to 0. The examples illustrate that the CS is a measure to trace the footprint of a biologic process in a microarray data set without knowing beforehand in which samples this process is activated.
Figure 1.
The signature CS for simulated signatures. Here we show three examples of the signature coherence score for simulated gene expression signatures. Background signature values were simulated for a matrix of g = 1000 genes and n = 20 samples by sampling from a normal distribution with a mean of zero and a standard deviation of one. For values associated with genes 1 to 10 and samples 11 to 20, we added a constant c ε [0, 2, 4] to this random data matrix, thereby simulating no, weak, or strong differential expression between samples 1 to 10 and 11 to 20 for the first 10 genes of the data matrix. These 10 genes were now considered the signature under study. The CS was calculated (Materials and Methods) and its significance of deviation from the described randomization tests was determined. For the random signature, we found CS = 0.043 with P > .90. For the weakly deregulated signature, we found CS = 0.52 with P < .0001. For the strongly deregulated signature, we found CS = 0.92 with P < .0001. Thus, the CS score was strongly dependent on the introduced signal. It can be used as an indicator of common regulation (coherence) of signature gene expression.
For the data set of Thompson et al. (St. Jude hospital), the coherence score of the 16-gene IFN signature was 0.29; for the data set of Fattet et al. (GSE12992), we yielded a CS = 0.25. We assessed the significance of this finding using data perturbation and random gene sets: When we sampled 10,000 gene sets of the same size as the IFN signature from all genes represented in the full data set and scored these 10,000 signatures in the data of Thompson et al. and Fattet et al., we never obtained higher CS scores than for the original IFN signature. Similarly, when we 10,000-times permuted the expression levels within the IFN signature across samples (for each gene separately) and then assessed the IFN signature, we never obtained higher scores than for the nonrandomized IFN signature in both data sets of Thompson et al. and Fattet et al. (diagnostic plots visualizing this analysis can be found in Figures W2 and W3). Thus, we propose that the initial IFN signature (not medulloblastoma optimized) already shows a strong intergene correlation in our two medulloblastoma data sets at a significance level of P < .0001. So far, we discovered that the IFN response program—as defined by the original IFN signature—is a differentially active transcriptional program in two different medulloblastoma patient cohorts.
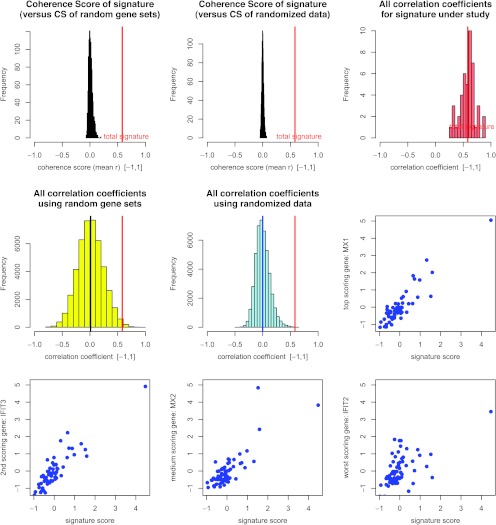
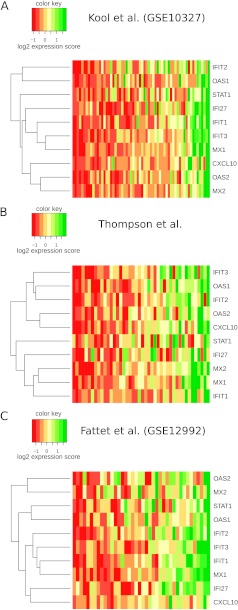
We observed that not all genes in the original IFN signature were strongly correlating with the signature core. Because the original signature was defined based on data from autoimmune disease—not from cancer data—this was not unexpected. Therefore, we selected a specific medulloblastoma IFN response signature (med-IFN): We selected a core medulloblastoma IFN signature (med-IFN signature) of 10 genes for which each gene correlated with r > 0.4 with the original IFN signature score (per-sample-mean of standardized mean-centered expression values of all genes) in each training data set. We then tested the med-IFN signature in a third independent validation cohort of 62 medulloblastomas for coherent expression patterns (microarray data of the study of Kool et al.). We found that it yields a coherence score of CS = 0.58 in this validation data set (see Figure 2 for diagnostic plots of this signature). A coherence score as high as this was neither obtained when 10,000 randomly selected 10-gene sets were scored on this data nor was it obtained when the med-IFN signature's coherence score was calculated on 10,000 shuffled versions of this med-IFN signature (per-gene expression values were permuted randomly, each gene independently). Thus, it is highly unlikely that the observed strong gene-wise cross-correlation of the med-IFN signature arose by chance (P < .0001 for both tests). Coherence scores for the core med-IFN signature in the training data were CS = 0.402 for the Thompson data and CS = 0.389 for the Fattet data—an expected improvement after selecting centroid-correlating genes. In Figure 3, we show heat maps of the 10-gene signature with hierarchically clustered genes and samples ordered according to med-IFN signature score. The heat maps visualize the overall strongly coordinated changes for IFN response status in the three medulloblastoma data sets, with the data set of Kool et al. not used for training of the signature. We finally assigned med-IFN signature scores to the tumor samples of all three medulloblastoma data sets using our 10-gene med-IFN signature. Signature scores for samples were defined as the sums of z-normalized (mean-centered and standardized) expression values per sample.
Figure 2.
Validation of the medulloblastoma IFN signature. Here we show diagnostic plots of the medulloblastoma 10-gene IFN signature in the Kool et al. validation data set. A red vertical line marks the CS score of the med-IFN signature throughout the plots. Top left: The signature coherence score (red) compared to 10,000 coherence scores obtained for random gene sets. Top middle: The signature coherence score (red) compared to 10,000 coherence scores obtained for randomly permuted versions of the IFN signature. Top right: IFN signature coherence score compared to all correlation coefficients from which it is derived. Mid row/left column: gene-versus-gene correlation coefficients for random gene sets. Middle row/middle column: gene-versus-gene correlation coefficients for the randomly perturbed signature. Middle row/right column: Scatterplot of MX1 signals across tumors and IFN signature scores across tumors. MX1 is the gene that best correlates to the IFN signature score. Bottom left: Scatterplot of IFIT3 signals across tumors and IFN signature scores across tumors. IFIT3 is the gene that second best correlates to the IFN signature score. Bottom/middle: Scatterplot of MX2 signals across tumors and IFN signature scores across tumors. MX2 is a gene with median correlation to the IFN signature score. Bottom right: Scatterplot of IFIT2 signals across tumors and IFN signature scores across tumors. IFIT2 is the signature gene with lowest correlation to the IFN signature score.
Figure 3.
Medulloblastoma type I IFN signature gene expression. Heat maps visualize mean-centered standardized gene expression values in three studies for all genes of the medulloblastoma IFN response signature (med-IFN). Samples in columns are ordered by signature score. Color code: green — high expression, red — low expression (expression score color keys are given in the legends). (A) Expression intensities in data set from Kool et al. (validation data set). (B) Expression intensities in data set from Thompson et al. (training data set 1). (C) Expression intensities in data set from Fattet et al. (training data set 2).
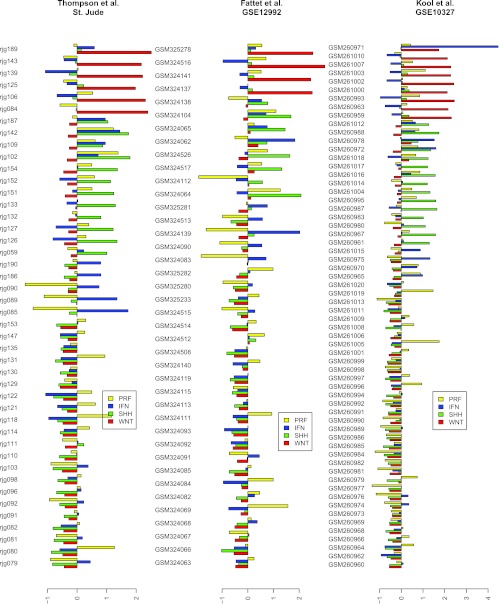
To analyze the med-IFN signature in the context of the consensus on molecular subtypes in medulloblastoma, we established and analyzed WNT and SHH signatures from the results of Kool et al. As WNT signature genes, we selected 11 top genes overexpressed in Kool subtype A that were known in the WNT pathway context: SP5, EMX2, LEF1, AXIN2, TNC, EPHA7, FZD10, DKK2, WIF1, CCDC46, and PAX3. The WNT signature yields exceptionally high coherence scores of CS > 0.80 in all three microarray data sets (P < .0001). As SHH signature genes, we selected the top 21 genes overexpressed in Kool subtype B: SEPT10, CYYR1, POU3F2, PRKD1, PRIMA1, BDH2, C4orf18, SFRP1, RNF130, RFTN2, SCHIP1, KIAA0922, SATB2, ZNF516, ZFP36L1, SRGAP1, GLI2, CCDC109B, BCHE, SOX2, and CLIC1. Also, the SHH signature yields highly significant coherence scores of CS > 0.5 in all three data sets (P < .0001). The strong coherence of the WNT and SHH signatures reflects the fundamental differences with respect to the developmental origins of these cancer subtypes. Generally, proliferation is an important outcome of cancer pathway activation. Differences in proliferation between known subtypes were not assessed in previous studies. In analogy to the procedure for the IFN signatures, we established a proliferation signature: starting from 84 genes encoding DNA synthesis and kinetochore proteins, we distilled a core of 21 proliferation genes strongly correlating in the two training data sets. We used these as a core medulloblastoma proliferation signature. Whereas the overall coherence of the original signatures in the two data sets was low (CS ∼ 0.10), but significant (P < .001), analysis of the 21-gene medulloblastoma proliferation signature resulted in a high coherence in the validation data set by Kool et al. (CS = 0.463, P < .0001). To assess dependencies between subtypes, we scored all samples of the three medulloblastoma data sets using the four signatures (WNT, SHH, IFN, PRF) and visualized them in Figure 4. High IFN signature scores are present in all medulloblastoma subtypes, although in total, only two tumors of the WNT subtype have an IFN response phenotype. So, IFN response occurs across all subtypes but is probably more seldom in WNT subtype tumors. In particular, for the data sets of Thompson et al. and Fattet et al., we observed low proliferation scores for IFN-high tumors. Considering all 146 patients in the three studies, we observed for a thresholds of Tmed-IFN = 0.25 and TPRF = -1 a significant association (Fisher exact test, P = .005) between low proliferation score and high med-IFN score: of 13 patients with low PRF scores, 8 have high IFN scores (∼61%), whereas only 30 of the remaining 133 patients (∼23%) with intermediate to high proliferation scores have high IFN scores. This might indicate that IFN responses can lead to lower proliferation rates in medulloblastomas—with potential influence on prognosis. Among the non-WNT non-SHH group 3/group 4 tumors that often have poor prognosis, the med-IFN-high tumors might be those with better prognosis owing to their low proliferative state. It is to be shown in future prospective studies how IFN response and proliferative state relate to CMV infection and whether this has consequences for therapy (administration of less aggressive chemotherapy or radiotherapy and/or antiviral therapeutics).
Figure 4.
Pathway signature scores in all three data sets. Here we show bar plots of scores for the interferon signature (IFN), Wnt pathway activation signature (WNT), Sonic Hedgehog pathway activation (SHH), and proliferation signatures (PRF) for each patient in the three medulloblastoma cohorts under study. Identifiers for each patient are given as GEO sample IDs or as microarray IDs of the St. Jude study.
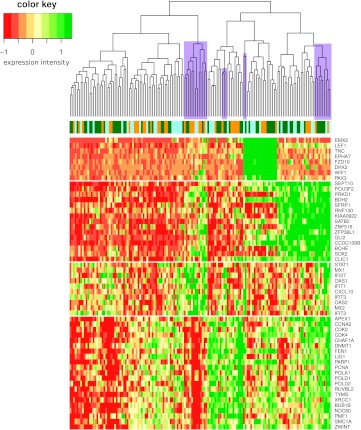
The presence of IFN responses across all subtypes could have hindered an earlier discovery of the med-IFN transcriptional program. The reason is that previously used clustering approaches aim to find nonoverlapping clusters: they have focused the cluster formation only on the most influential—and therefore possibly overdominant—expression programs, in particular those induced by SHH and WNT pathways. The dominance of WNT and SHH expression programs in a hierarchical clustering of a combined medulloblastoma data set is illustrated in Figure 5. Hypothesis-driven approaches or biclustering approaches that are able to discover overlapping clusters [27] could help to discover less dominant, but nevertheless relevant, differentially regulated transcriptional programs. We have shown here for the IFN response signature example that a hypothesis-driven approach can lead to additional insights and is complementary to unsupervised clustering-based cancer subtyping.
Figure 5.
Hierarchical clustering of a combined medulloblastoma data set. A heat map of a medulloblastoma data set composed of gene-wise z-normalized expression data for 146 medulloblastomas from the studies of Thompson, Fattet, and Kool is shown. Columns/samples are hierarchically clustered (average linkage, Euclidean distance). Genes are ordered by membership to WNT, SHH, IFN, and PRF signatures. Top coloring reflects which sample belongs to which original data set (blue - Thompson, orange - Fattet, green - Kool). Note how clustering is dominated by WNT and SHH genes. IFN-high samples (marked in magenta) are rather distributed among all WNT-low samples and often have a PRF-low expression phenotype.
Conclusions
We found an IFN response multigene expression signature that is a recurrently activated gene expression module in medulloblastomas. In the light of the study by Baryawno et al. on CMV infections in medulloblastoma, this is a complementary piece of evidence for an important role of viral infection associated with antiviral response in the development of medulloblastoma. We found that IFN responses are not restricted to distinct known subtypes of medulloblastoma (WNT, SHH, group 3/4). Initial evidence exists that IFN response could coincide with reduced proliferation rates. Further studies will have to address whether differential activation of antiviral cellular programs are due to CMV or other infections, whether all CMV infections coincide with an IFN response, and whether the ability to elicit an antiviral response has an influence on prognosis or therapy for medulloblastoma. We further propose our IFN signature as a tool to detect differential antiviral states in further cancer types, making it possible to retrospectively explore microarray data for type I IFN response activation.
Supplementary Material
Acknowledgments
The author thanks the authors of the three medulloblastoma microarray data sets for making their data sets publicly available, and Thomas Grombacher and Jerome Wojcik for helpful comments during article preparation.
Footnotes
The author works for the pharmaceutical company Merck KGaA that develops and commercializes cancer therapeutics. This professional relationship does influence the author's scientific neutrality in medulloblastoma research. There are no products, patents or other commercial interests related to this study.
This article refers to supplementary materials, which are designated by Table W1 and Figures W1 to W3 and are available online at www.transonc.com.
References
- 1.Albright AL. Pediatric brain tumors. CA Cancer J Clinicians. 1993;43:272–288. doi: 10.3322/canjclin.43.5.272. [DOI] [PubMed] [Google Scholar]
- 2.de Bont JM, Packer RJ, Michiels EM, den Boer ML, Pieters R. Biological background of pediatric medulloblastoma and ependymoma: a review from a translational research perspective. Neuro Oncol. 2008;10(6):1040–1060. doi: 10.1215/15228517-2008-059. [DOI] [PMC free article] [PubMed] [Google Scholar]
- 3.Pietsch T, Waha A, Koch A, Kraus J, Albrecht S, Tonn J, Sorensen N, Berthold F, Henk B, Schmandt N, et al. Medulloblastomas of the desmoplastic variant carry mutations of the human homologue of Drosophila patched. Cancer Res. 1997;57:2085–2088. [PubMed] [Google Scholar]
- 4.Taylor MD, Liu L, Raffel C, Hui CC, Mainprize TG, Zhang X, Agatep R, Chiappa S, Gao L, Lowrance A, et al. Mutations in SUFU predispose to medulloblastoma. Nat Genet. 2002;31:306–310. doi: 10.1038/ng916. [DOI] [PubMed] [Google Scholar]
- 5.Ellison DW, Onilude OE, Lindsey JC, Lusher ME, Weston CL, Taylor RE, Pearson AD, Clifford SC United Kingdom Children's Cancer Study Group Brain Tumour Committee, author. β-Catenin status predicts a favorable outcome in childhood medulloblastoma: the United Kingdom Children's Cancer Study Group Brain Tumour Committee. J Clin Oncol. 2005;23:7951–7957. doi: 10.1200/JCO.2005.01.5479. [DOI] [PubMed] [Google Scholar]
- 6.Huang H, Mahler-Araujo BM, Sankila A, Chimelli L, Yonekawa Y, Kleihues P, Ohgaki H. APC mutations in sporadic medulloblastomas. Am J Pathol. 2000;156:433–437. doi: 10.1016/S0002-9440(10)64747-5. [DOI] [PMC free article] [PubMed] [Google Scholar]
- 7.Dahmen RP, Koch A, Denkhaus D, Tonn JC, Sorensen N, Berthold F, Behrens J, Birchmeier W, Wiestler OD, Pietsch T. Deletions of AXIN1, a component of the WNT/wingless pathway, in sporadic medulloblastomas. Cancer Res. 2001;61:7039–7043. [PubMed] [Google Scholar]
- 8.Koch A, Waha A, Tonn JC, Sorensen N, Berthold F, Wolter M, Reifenberger J, Hartmann W, Friedl W, Reifenberger G, et al. Somatic mutations of WNT/wingless signaling pathway components in primitive neuroectodermal tumors. Int J Cancer. 2001;93:445–449. doi: 10.1002/ijc.1342. [DOI] [PubMed] [Google Scholar]
- 9.Koch A, Hrychyk A, Hartmann W, Waha A, Mikeska T, Waha A, Schüller U, Sörensen N, Berthold F, Goodyer CG, et al. Mutations of the Wnt antagonist AXIN2 (conductin) result in TCF-dependent transcription in medulloblastomas. Int J Cancer. 2007;121(2):284–291. doi: 10.1002/ijc.22675. [DOI] [PubMed] [Google Scholar]
- 10.Aldosari N, Bigner SH, Burger PC, Becker L, Kepner JL, Friedman HS, McLendon RE. MYCC and MYCN oncogene amplification in medulloblastoma. A fluorescence in situ hybridization study on paraffin sections from the Children's Oncology Group. Arch Pathol Lab Med. 2002;126:540–544. doi: 10.5858/2002-126-0540-MAMOAI. [DOI] [PubMed] [Google Scholar]
- 11.Swartling FJ, Grimmer MR, Hackett CS, Northcott PA, Fan QW, Goldenberg DD, Lau J, Masic S, Nguyen K, Yakovenko S, et al. Pleiotropic role for MYCN in medulloblastoma. Genes Dev. 2010;24(10):1059–1072. doi: 10.1101/gad.1907510. [DOI] [PMC free article] [PubMed] [Google Scholar]
- 12.Pan E, Pellarin M, Holmes E, Smirnov I, Misra A, Eberhart CG, Burger PC, Biegel JA, Feuerstein BG. Isochromosome 17q is a negative prognostic factor in poor-risk childhood medulloblastoma patients. Clin Cancer Res. 2005;11:4733–4740. doi: 10.1158/1078-0432.CCR-04-0465. [DOI] [PubMed] [Google Scholar]
- 13.Pfister S, Remke M, Toedt G, Werft W, Benner A, Mendrzyk F, Wittmann A, Devens F, von Hoff K, Rutkowski S, et al. Supratentorial primitive neuroectodermal tumors of the central nervous system frequently harbor deletions of the CDKN2A locus and other genomic aberrations distinct from medulloblastomas. Genes Chromosomes Cancer. 2007;46(9):839–851. doi: 10.1002/gcc.20471. [DOI] [PubMed] [Google Scholar]
- 14.Rossi MR, Conroy J, McQuaid D, Nowak NJ, Rutka JT, Cowell JK. Array CGH analysis of pediatric medulloblastomas. Genes Chromosomes Cancer. 2006;45:290–303. doi: 10.1002/gcc.20292. [DOI] [PubMed] [Google Scholar]
- 15.Lo KC, Rossi MR, Eberhart CG, Cowell JK. Genome wide copy number abnormalities in pediatric medulloblastomas as assessed by array comparative genome hybridization. Brain Pathol. 2007;17(3):282–296. doi: 10.1111/j.1750-3639.2007.00072.x. [DOI] [PMC free article] [PubMed] [Google Scholar]
- 16.Thompson MC, Fuller C, Hogg TL, Dalton J, Finkelstein D, Lau CC, Chintagumpala M, Adesina A, Ashley DM, Kellie SJ, et al. Genomics identifies medulloblastoma subgroups that are enriched for specific genetic alterations. J Clin Oncol. 2006;24:1924–1931. doi: 10.1200/JCO.2005.04.4974. [DOI] [PubMed] [Google Scholar]
- 17.Fattet S, Haberler C, Legoix P, Varlet P, Lellouch-Tubiana A, Lair S, Manie E, Raquin MA, Bours D, Carpentier S, et al. β-Catenin status in paediatric medulloblastomas: correlation of immunohistochemical expression with mutational status, genetic profiles, and clinical characteristics. J Pathol. 2009;218:86–94. doi: 10.1002/path.2514. [DOI] [PubMed] [Google Scholar]
- 18.Kool M, Koster J, Bunt J, Hasselt NE, Lakeman A, van Sluis P, Troost D, Meeteren NS, Caron HN, Cloos J, et al. Integrated genomics identifies five medulloblastoma subtypes with distinct genetic profiles, pathway signatures and clinicopathological features. PLoS One. 2008;3:e3088. doi: 10.1371/journal.pone.0003088. [DOI] [PMC free article] [PubMed] [Google Scholar]
- 19.Cho YJ, Tsherniak A, Tamayo P, Santagata S, Ligon A, Greulich H, Berhoukim R, Amani V, Goumnerova L, Eberhart CG, et al. Integrative genomic analysis of medulloblastoma identifies a molecular subgroup that drives poor clinical outcome. J Clin Oncol. 2011;29:1424–1430. doi: 10.1200/JCO.2010.28.5148. [DOI] [PMC free article] [PubMed] [Google Scholar]
- 20.Schwalbe EC, Lindsey JC, Straughton D, Hogg TL, Cole M, Megahed H, Ryan SL, Lusher ME, Taylor MD, Gilbertson RJ, et al. Rapid diagnosis of medulloblastoma molecular subgroups. Clin Cancer Res. 2011;17:1883–1894. doi: 10.1158/1078-0432.CCR-10-2210. [DOI] [PMC free article] [PubMed] [Google Scholar]
- 21.Northcott PA, Korshunov A, Witt H, Hielscher T, Eberhart CG, Mack S, Bouffet E, Clifford SC, Hawkins CE, French P, et al. Medulloblastoma comprises four distinct molecular variants. J Clin Oncol. 2011;29:1408–1414. doi: 10.1200/JCO.2009.27.4324. [DOI] [PMC free article] [PubMed] [Google Scholar]
- 22.Taylor MD, Northcott PA, Korshunov A, Remke M, Cho YJ, Clifford SC, Eberhart CG, Parsons DW, Rutkowski S, Gajjar A, et al. Molecular subgroups of medulloblastoma: the current consensus. Acta Neuropathol. 2012;123:465–472. doi: 10.1007/s00401-011-0922-z. [DOI] [PMC free article] [PubMed] [Google Scholar]
- 23.Baryawno N, Rahbar A, Wolmer-Solberg N, Taher C, Odeberg J, Darabi A, Khan Z, Sveinbjörnsson B, Fuskevag OM, Segerstrom L, et al. Detection of human cytomegalovirus in medulloblastomas reveals a potential therapeutic target. J Clin Invest. 2011;121(10):4043–4055. doi: 10.1172/JCI57147. [DOI] [PMC free article] [PubMed] [Google Scholar]
- 24.Einav U, Tabach Y, Getz G, Yitzhaky A, Ozbek U, Amariglio N, Izraeli S, Rechavi G, Domany E. Gene expression analysis reveals a strong signature of an interferon-induced pathway in childhood lymphoblastic leukemia as well as in breast and ovarian cancer. Oncogene. 2005;24:6367–6375. doi: 10.1038/sj.onc.1208797. [DOI] [PubMed] [Google Scholar]
- 25.Baechler EC, Bauer JW, Slattery CA, Ortmann WA, Espe KJ, Novitzke J, Ytterberg SR, Gregersen PK, Behrens TW, Reed AM. An interferon signature in the peripheral blood of dermatomyositis patients is associated with disease activity. Mol Med. 2007;13(1–2):59–68. doi: 10.2119/2006-00085.Baechler. [DOI] [PMC free article] [PubMed] [Google Scholar]
- 26.Comabella M, Lünemann JD, Río J, Sánchez A, López C, Julià E, Fernández M, Nonell L, Camiña-Tato M, Deisenhammer F, et al. A type I interferon signature in monocytes is associated with poor response to interferon-β in multiple sclerosis. Brain. 2009;132(pt 12):3353–3365. doi: 10.1093/brain/awp228. [DOI] [PubMed] [Google Scholar]
- 27.Madeira SC, Oliveira AL. Biclustering algorithms for biological data analysis: a survey. IEEE/ACM Trans Comput Biol Bioinform. 2004;1(1):24–45. doi: 10.1109/TCBB.2004.2. [DOI] [PubMed] [Google Scholar]
Associated Data
This section collects any data citations, data availability statements, or supplementary materials included in this article.


