Abstract
Haptoglobin (Hp) synthesis occurs almost exclusively in liver, and it is rapidly upregulated in response to stress. Because many of the pathways that initiate hepatic Hp synthesis are also operative during acute kidney injury (AKI), we tested whether AKI activates the renal cortical Hp gene. CD-1 mice were subjected to six diverse AKI models: ischemia-reperfusion, glycerol injection, cisplatin nephrotoxicity, myoglobinuria, endotoxemia, and bilateral ureteral obstruction. Renal cortical Hp gene induction was determined either 4–72 h or 1–3 wk later by measuring Hp mRNA and protein levels. Relative renal vs. hepatic Hp gene induction during endotoxemia was also assessed. Each form of AKI induced striking and sustained Hp mRNA increases, leading to ∼10- to 100-fold renal Hp protein elevations (ELISA; Western blot). Immunohistochemistry, and isolated proximal tubule assessments, indicated that the proximal tubule was the dominant (if not only) site of the renal Hp increases. Corresponding urinary and plasma Hp elevations were surrogate markers of this response. Endotoxemia evoked 25-fold greater Hp mRNA increases in kidney vs. liver, indicating marked renal Hp gene reactivity. Clinical relevance of these findings was suggested by observations that urine samples from 16 patients with established AKI had statistically higher (∼12×) urinary Hp levels than urine samples from either normal subjects or from 15 patients with chronic kidney disease. These AKI-associated urinary Hp increases mirrored those seen for urinary neutrophil gelatinase-associated lipoprotein, a well accepted AKI biomarker gene. In summary, these studies provide the first evidence that AKI evokes rapid, marked, and sustained induction of the proximal tubule Hp gene. Hp's known antioxidant, as well as its protean pro- and anti-inflammatory, actions imply potentially diverse effects on the evolution of acute tubular injury.
Keywords: acute renal failure, ischemia, rhabdomyolysis, cisplatin, obstruction
during the course of recent investigations (34), we made the surprising observation that the albumin and the α-feto protein (AFP) genes, which are normally expressed only in liver, are acutely upregulated in kidney by either ischemic or nephrotoxic (glycerol; maleate) acute renal failure (ARF). In addition, we observed that, when cultured human proximal tubule (HK-2) cells were subjected to ATP depletion or to cytosolic calcium overload, albumin gene induction occurred (34). In concert, these findings implied that genes (albumin, AFP), which are normally expressed in liver, but silent in kidney, are acutely induced as part of a proximal renal tubule “stress response”. The potential clinical relevance of these observations was indicated by two additional findings. First, clinical acute kidney injury (AKI) appeared to increase renal tubular albumin gene expression, as suggested by increased RNA polymerase II binding to urinary chromatin fragments of the albumin gene (consistent with increased albumin gene transcription) (34). Second, patients with AKI manifested increased urinary AFP excretion, compared with levels seen in critically ill-matched, non-AKI controls (34). In summary, these findings led us to coin the term “renal hepatization,” whereby the acutely damaged kidney assumes selected features of a hepatic phenotype.
A third protein, which is almost exclusively synthesized by the liver, is haptoglobin (Hp) (1, 2, 22). Hence, we questioned whether Hp, like albumin and AFP, might also be induced by AKI. Indeed, Hp possesses a number of properties that make its potential induction by AKI of particular interest. First, given its ability to bind hemoglobin (9, 16, 25) and myoglobin (27), it can decrease the severity of intravascular hemolysis- and rhabdomyolysis-induced AKI, respectively, by decreasing heme protein filtration (19, 23, 32). Second, Hp can exert direct anti-oxidant effects, independent of its ability to facilitate heme protein disposal (7, 25, 30). Third, Hp has been reported to paradoxically possess both anti-inflammatory, as well as proinflammatory, effects. For example, Hp can inhibit the respiratory burst in stimulated neutrophils, blunt endotoxin-stimulated T-lymphocyte proliferation, and modulate macrophage and dendritic cell function (3–5, 13, 14, 25). Conversely, Hp can also signal through the Toll-like receptor pathway, increasing inflammatory responses (28). Given that ischemic and nephrotoxic AKI evoke intrarenal inflammation (e.g., Refs. 8, 18, 29), concomitant alterations in renal Hp expression might impact these responses and thus alter AKI severity and outcomes. Finally, specific Hp polymorphisms, most notably Hp2–2, appear to be overrepresented in patients with both acute and chronic nephropathies (6, 11, 12, 20, 26). This further suggests that Hp may exert pathophysiological effects in patients with diverse forms of renal disease.
Given the above considerations, we have assessed whether AKI increases renal cortical/proximal tubule Hp gene expression. To this end, renal cortical/proximal tubule Hp mRNA and protein levels were sought in the aftermath of diverse forms of experimental AKI [ischemia-reperfusion (I/R) injury, glycerol-induced rhabdomyolysis, bilateral ureteral obstruction (BUO), cisplatin (CP) nephrotoxicity, myoglobinuria, or endotoxemia]. Corresponding changes in plasma and urinary Hp levels were sought. A potential clinical correlate of these experimental results was sought by measuring Hp levels in urine samples obtained from patients with either severe AKI or chronic kidney disease (CKD).
METHODS
Animal Studies
All experimental AKI models were conducted using male CD-1 mice (35–45 g; Charles River Laboratories, Wilmington, MA). They were housed under standard vivarium conditions with free food and water access. All protocols were approved by the institution's IACUC. Surgeries were performed under deep pentobarbital anesthesia (40–50 mg/kg, administered by intraperitoneal injection).
Ischemic AKI
Four-hour I/R protocol.
Six mice were subjected to a midline laparotomy, and then 30 min of bilateral ischemic injury was imposed by application of microvascular clamps to the renal pedicles. The clamps were then removed, and uniform reperfusion was confirmed by the loss of kidney cyanosis. Body temperature was maintained at 37°C throughout with the use of an external heating source. Four hours postsurgery, the kidneys were resected and iced, the cortices were dissected, and the tissues were extracted for total RNA (RNeasy; Qiagen) (34). Hp mRNA was assayed by RT-PCR using the primers presented in Table 1. The results were expressed as a ratio to simultaneously measured GAPDH, used as a housekeeping gene. Six mice subjected to the same surgical protocol, but without induction of ischemic renal injury, served as controls.
Table 1.
Primers used for Hp mRNA assessments
| mRNA | Primer Sequences | Product Size, bp |
|---|---|---|
| Haptoglobin | 5′-TTG CTG TGG AGT TGG GCA ATG ATG-3′ | 605 |
| 5′-ACG GCC TGG TGC TAT GTA GTC TTT-3′ | ||
| GAPDH | 5′-CTG CCA TTT GCA GTG GCA AAG TGG-3′ | 437 |
| 5′-TTG TCA TGG ATG ACC TTG GCC AGG-3′ |
Primers used for the quantification of haptoglobin (Hp) in mouse kidney cortex are shown.
Twenty-four hour reperfusion protocol.
Six mice were subjected to the above I/R protocol. Following removal of the vascular clamps, the abdominal incisions were sutured in two layers, and the mice were allowed to recover from anesthesia. Twenty-four hours later, the mice were reanesthetized, a urine sample was obtained from the bladder by external compression, and a terminal plasma sample was obtained from the inferior vena cava. Renal cortical samples were extracted for both total RNA and protein (34). Renal cortical Hp mRNA was assayed, as above. Plasma, urine, and renal cortical protein samples were assayed for mouse Hp protein concentrations by ELISA (Alpha Diagnostic International). Kidney Hp levels were expressed as a ratio to total extract protein content. Urinary Hp levels were factored by urinary creatinine. Finally, terminal blood urea nitrogen (BUN) concentrations were measured as an index of renal failure severity. Plasma, urine, and renal cortical tissue samples obtained from six sham operated mice served as controls.
Glycerol Model of Rhabomyolysis-Induced AKI
Twelve mice were lightly anesthetized with isoflurane, and then they were injected with 10 ml/kg of 50% glycerol, administered intramuscularly in equally divided dosages into each hindlimb. Twelve nonglycerol mice served as controls. At either 4 h or 24 h postglycerol injection, one-half of the glycerol-injected mice and one-half of the controls were deeply anesthetized with pentobarbital, and then blood, urine, and renal cortical tissue samples were obtained and assayed for Hp protein, mRNA, and BUN analyses, as noted above.
Purified Myoglobin Injections
Ten mice were lightly anesthetized with isoflurane, and then they were injected with purified horse skeletal muscle myoglobin (250 mg/kg in 1 ml saline; Sigma Chemical; M0630; administered subcutaneously in the dorsal neck region). Either 4 or 24 h later, one-half of the mice were anesthetized, and renal cortical, urine, and plasma samples were obtained and assayed, as noted above. Samples from five normal mice served as controls.
CP Nephrotoxicity
Twelve mice received an intraperitoneal injection of CP (30 mg/kg, in 100 μl of saline). As controls, 12 mice received an equal amount of saline vehicle. At either 1 or 3 days postinjections, one-half of the mice in each group were anesthetized with pentobarbital. Blood, urine, and renal cortical tissue samples were obtained and analyzed, as noted above. Of note, the 24-h and 72-h time frame was used for the CP experiments because of the relatively slow onset of CP AKI (e.g., compared with I/R or glycerol-induced AKI).
BUO
Twelve mice were subjected to a midline laparotomy, and both ureters were ligated at their midpoint with silk ligatures. Twelve mice subjected to sham ureteral obstruction served as controls. One-half of the mice in each group were maintained under anesthesia, and, at 4 h postureteral obstruction, the kidneys were resected for Hp mRNA analyses. The remaining six sham-operated mice and six BUO mice had their abdominal incisions sutured, and they were allowed to recover from anesthesia. At 24 h postsurgery, the mice were reanesthetized. The mice with BUO had a urine sample aspirated from the dilated renal pelvis with a 28-gauge needle-fitted syringe. Then, terminal plasma and renal cortical samples were obtained. The plasma, urine, and renal cortical samples were assayed for Hp mRNA (cortex) or protein (plasma, urine, cortex), as noted above.
Endotoxin-Induced AKI
Ten mice were injected with 2 mg/kg of E. coli lipopolysaccharide (LPS; 0111:B4; L-2630; Sigma Chemical, St. Louis, MO; stock solution, 4 mg/ml saline). Either 4 h or 24 h postinjection (n, 4 and 6 mice, respectively), the mice were anesthetized, and terminal blood, urine, and kidney samples were obtained for Hp protein/mRNA and BUN analyses, as noted above. Samples obtained from six normal mice served as controls.
Assessment of Hepatic vs. Renal Hp mRNA Levels Following Induction of AKI
To assess the relative degree of hepatic vs. renal Hp expression in the setting of different forms of AKI, simultaneous hepatic and kidney RNA samples were obtained from control mice and from mice that had been subjected to either the I/R, glycerol, or LPS injection protocol 24 h earlier (n, 4–6 per group). Hepatic and renal cortical RNA was extracted and assayed for Hp mRNA, as noted above. The degrees of increase in mRNA values were expressed as the fold increase vs. that observed in control liver and renal cortical tissues.
Time Course of Renal Cortical Hp Expression Following Unilateral Ischemic Injury
Our laboratory has previously reported that, following 30 min of unilateral ischemic renal injury, ongoing tubular necrosis, progressive inflammation, lipid accumulation, and renal fibrosis result, culminating in end-stage kidney disease (two-thirds loss of renal mass) by 3 wk (37). To ascertain the time course of Hp gene expression over this period, 15 mice were subjected to 30 min of left ischemic injury (37). The right kidney was left unperturbed. Either 1, 7, or 21 days postischemia (n, 5 mice at each time point), the mice were reanesthetized, and bilateral nephrectomy was performed. The postischemic and contralateral kidney samples underwent cortical protein and RNA extraction for Hp protein and mRNA analyses. The results of the postischemic and contralateral kidney analyses were compared.
Renal Cortical Western Blotting
To confirm the results of the ELISA assessments of renal cortical Hp increases following AKI, renal cortical protein extracts were subjected to Western blotting under reducing and denaturing conditions (Criterion XT 4–12% Bis-Tris precast gels; Biorad, Hercules, CA). Hp was detected using sheep anti-mouse Hp (R&D Systems, Minneapolis, MN; no. AF-4409), and a horseradish peroxidase labeled secondary antibody (donkey anti-sheep IgG; R&D Systems, HA F016). Two extracts each from the I/R, CP, glycerol, and LPS-AKI models were probed and contrasted to seven control renal cortical protein samples.
Proximal Tubule Segment Assessments
The following experiments were undertaken to assess whether the injury-induced renal cortical Hp mRNA and protein increases were directly expressed in proximal tubules. Mice were injected with either CP (n, 4) or LPS (n, 6), as noted above. One day post-LPS injection, or 2 days post-CP injection, the mice were anesthetized, the kidneys were excised, the cortex was resected, and proximal tubule segments (PTS) were isolated, as previously described (39). In brief, the cortical tissues were iced, minced with a razor blade, and then centrifuged through 31% Percoll. The recovered tubule pellets were then extracted for protein and RNA for subsequent Hp protein and mRNA determination. The results were contrasted to those obtained simultaneously in PTS harvested from six control mice.
Immunohistochemical Probing Of Kidney for Hp
Immunhistochemistry was undertaken to further explore the site of renal cortical Hp increases. A kidney, obtained 24 h postinduction of 30 min of unilateral ischemia, the contralateral (noninjured) kidney, and a kidney from a normal mouse were cut in frontal sections and fixed in 10% buffered formalin. Four-micrometer sections were cut and deparaffinized. The slides were rehydrated in Tris-buffered saline-Tween wash buffer, and antigen was retrieved in a Black and Decker steamer for 20 min in preheated Target Retrieval solution (pH6, Dako, Carpinteria, CA). All remaining staining steps were performed at room temperature using the Dako Autostainer. Endogenous peroxide activity was blocked using 3% H2O2 for 8 min, followed by the Avidin/Biotin Blocking Kit (Biocare Medical, Walnut Creek, CA). The sections were then incubated with Tris-buffered saline containing 1% BSA, 15% donkey serum, and 5% mouse serum (Jackson ImmunoResearch, West Grove, PA) for 10 min. Hp was detected using the above-noted sheep polyclonal from R&D Systems (Minneapolis, MN) at 1:00 (2 μg/ml) for 60 min. The antibody was detected using biotinylated donkey anti-sheep (Jackson ImmunoResearch) for 30 min, followed by streptavidin horseradish peroxidase (Jackson ImmunoResearch) for 30 min. The staining was visualized with 3,3′-diaminobenzidine (Dako) for 8 min and then counterstained with hematoxylin (Dako) for 2 min. Concentration-matched isotype control slides were run for each tissue sample (Jackson ImmunoResearch Laboratories) (38).
Urinary Hp Concentrations in Patients With Acute vs. Chronic AKI
To seek a clinical correlate for the above experimental data, untimed (“spot”) urine samples were obtained from 16 patients with severe AKI, as defined by the need for acute dialysis or continuous renal replacement therapy (RRT). The presumptive diagnoses were either ischemic, nephrotoxic, or multifactorial ARF. The urine samples were obtained just before RRT initiation. Selected patient information is presented in Table 2. For comparison, urine samples were obtained from 15 patients with late-stage CKD (Seattle Kidney Study, a prospective cohort study of CKD from any cause; see Table 2). Of note, although the majority of the CKD patients had associated diabetes, they lacked heavy proteinuria, suggesting that diabetic nephropathy was not the etiology of their renal disease. Indeed, the degree of proteinuria did not significantly differ between the ARF and CKD groups. Finally, to establish normal urine Hp values, urine samples were obtained for 10 normal volunteers. The urine samples were assayed for human Hp by ELISA (Abcam, Cambridge, MA), and the results were expressed as micrograms Hp-to-milligram urine creatinine ratios. As a comparator, a reference AKI biomarker, urinary neutrophil gelatinase-associated lipoprotein (NGAL) concentrations, was also assayed (R&D systems). All urine samples were collected using protocols that were approved by the respective institutions' internal review board (Washington University for ARF samples; University of Washington for CKD and control urine samples) and with patient informed consent.
Table 2.
Baseline characteristics of AKI and CKD patient cohort
| Characteristic | |
|---|---|
| AKI | |
| Age, yr | 61 ± 14 |
| Male, no. (%) | 7 (44) |
| Race, no. (%) | |
| White | 11 (68) |
| Black | 6 (38) |
| Other | 0 |
| Diabetes, no. (%) | 6 (38) |
| Baseline serum creatinine, mg/dl | 1.2 ± 0.48 |
| Serum creatinine at time of urine collection, mg/dl | 5.5 ± 3.88 |
| Protein-to-creatinine ratio, mg/mg | 1.48 ± 1.51 |
| CKD | |
| Age, yr | 59.1 ± 10.3 |
| Male, no. (%) | 15 (100) |
| Race, no. (%) | |
| White | 12 (80) |
| Black | 2 (13) |
| Other | 1 (7) |
| Diabetes, no. (%) | 13 (87) |
| Serum creatinine, mg/dl | 3.8 ± 1.3 |
| Estimated GFR, ml·min−1·1.73 m−2 (CKD-EPI equation) | 18.8 ± 6.1 |
| Protein-to-creatinine ratio, mg/mg | 1.43 ± 2.41 |
All values are given as means ± SD. Characteristics are given of acute kidney injury (AKI; n = 16) and chronic kidney disease (CKD; n = 15) patients who had urinary Hp assayed. Other statistics are for estimated glomerular filtration rate (GFR): intraquartile range 13.3, 23.3 ml·min−1·1.73 m−2; range 7.7-29.7 ml·min−1·1.73 m−2. The estimated GFR was not calculated for the AKI patients because their serum creatinines were not in steady state.
Calculations and Statistics
All data are presented as means ± 1 SE, excepting the data in Table 2, which presents the patient data as means ± 1 SD. Statistical comparisons were made by unpaired Student's t-test. If multiple comparisons were made, the Bonferroni correction was applied. Given the non-Gaussian distribution of the urinary Hp and NGAL data, these values were log base 10 transformed for the purpose of statistical analysis by unpaired T-test.
RESULTS
Renal Cortical Hp mRNA Levels Rise Following I/R, Glycerol, or CP-Induced AKI
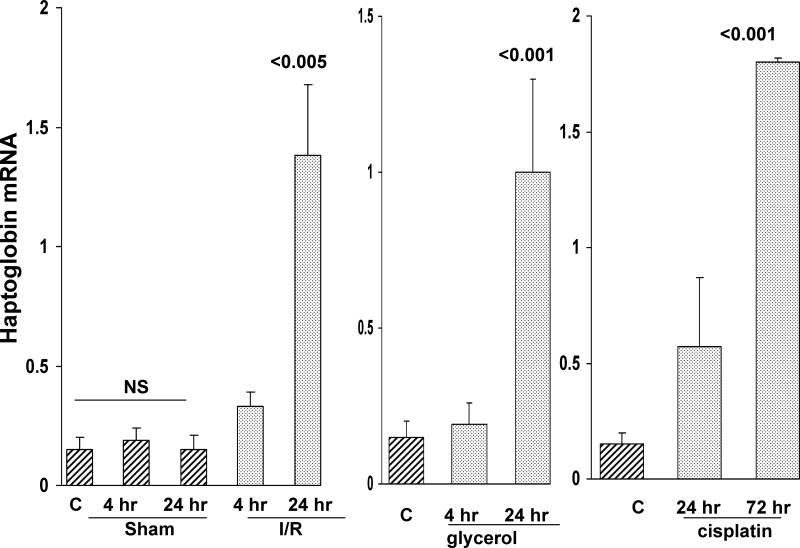
As shown in Fig. 1, renal cortical Hp mRNA levels approximately doubled within 4 h of inducing I/R injury, and, by 24 h, approximately eightfold mRNA increases were observed. Conversely, sham surgery did not alter renal cortical Hp mRNA levels. As shown in Fig. 1, middle and right, these results were recapitulated by both glycerol-induced rhabdomyolysis and by CP-induced ARF, with stepwise Hp mRNA increases being observed (reaching ∼5× and 10× control values at 24 h postglycerol, and 72 h post-CP injection, respectively). In each of these three models, severe renal failure resulted, as denoted by markedly elevated BUN levels (119 ± 5, 106 ± 5, and 135 ± 6 mg/dl at 24 h post-I/R, glycerol-induced rhabdomyolysis, and 72 h post-CP injection, respectively; control values, 24 ± 2 mg/dl).
Fig. 1.
Renal cortical haptoglobin (Hp) mRNA levels rise in response to ischemic (left), glycerol (Gly; middle), and cisplatin (CP)-induced acute kidney injury (AKI; right). Renal cortical mRNA levels were assessed during the initiation phase (4 h) and maintenance phase (24 h) of ischemia-reperfusion (I/R) and Gly-induced acute renal failure (ARF). Because of the slower onset of AKI due to CP, initiation phase and maintenance phase assessments were made at 24 and 72 h, respectively. Stepwise Hp mRNA increases were apparent in each of the three AKI models. C, control kidney values. In addition, the I/R values were compared with those observed in sham-operated mice [nonsignificant (NS) vs. the normal kidney values]. Values are means ± SE. P values are vs. control or sham values.
Renal Cortical Hp mRNA Levels Rise in Response to Myoglobin Injection, BUO, and LPS Injection
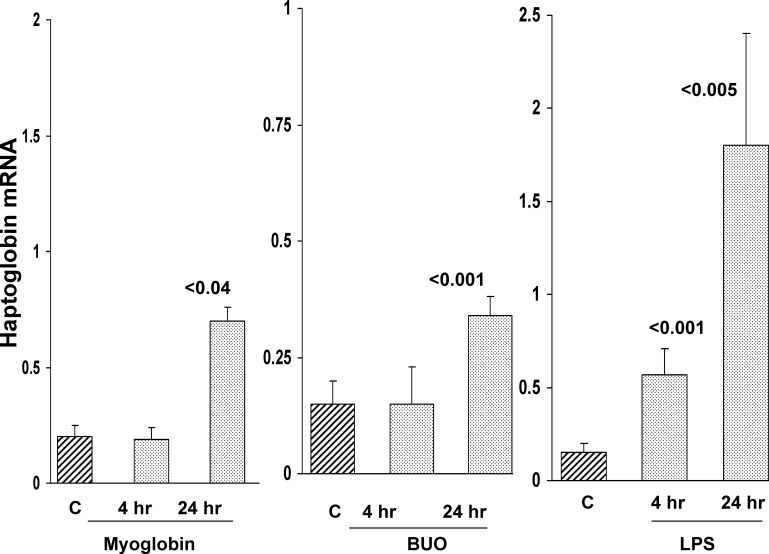
As shown in Fig. 2, the injection of purified horse skeletal muscle myoglobin evoked a time-dependent increase in Hp mRNA within renal cortex. BUO induced a comparable result. However, it was noteworthy that these mRNA increases were relatively modest (∼2× vs. controls), compared with those observed with I/R, glycerol, or CP induced injury (∼5–10×), as noted above. In contrast, LPS injection induced massive renal cortical Hp mRNA increases. These were observed within 4 h of LPS injection, and, by 24 h, ∼10-fold Hp mRNA increases were observed (compared with control values). Myoglobin injection did not evoke any azotemia (BUN, 20 mg/dl at 24 h vs. controls of 24 mg/dl). LPS and BUO induced modest and severe azotemia, respectively (58 ± 8 and 132 ± 7 mg/dl).
Fig. 2.
Renal cortical Hp mRNA levels rise in response to myoglobinuria, bilateral ureteral obstruction (BUO), and endotoxemia. Following purified myoglobin (Mgb) injection (left), creation of BUO (middle), or endotoxin [lipopolysaccharide (LPS); right] injection, stepwise increases in renal cortical Hp mRNA levels were observed. C, control mouse values. Values are means ± SE. P values are vs. controls.
Relative Degrees of Hp mRNA Changes in Liver vs. Kidney
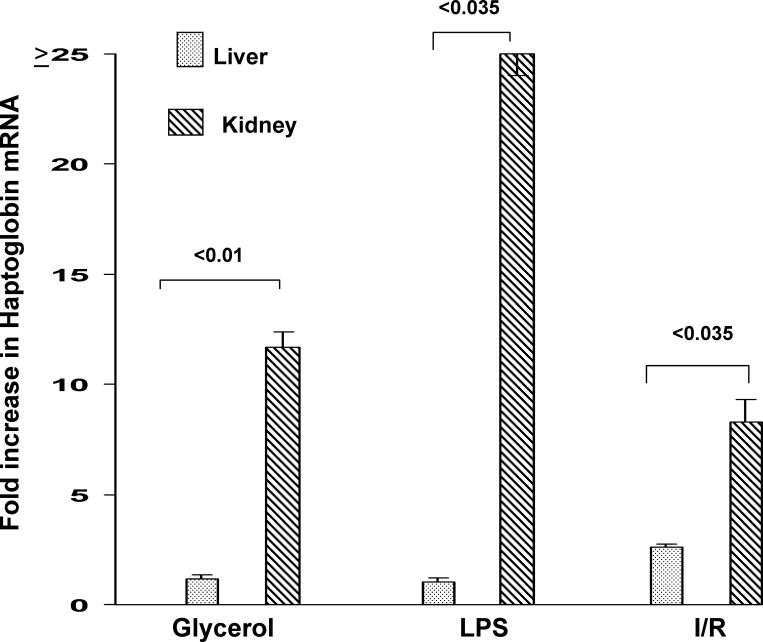
To assess the relative degrees of hepatic vs. renal cortical Hp gene induction in response to stress, simultaneous hepatic and renal cortical Hp mRNA levels were measured 24 h post-LPS injection, glycerol injection, or induction of bilateral I/R injury. Despite the fact that the liver and kidney had the same exposure to LPS, the kidney manifested an approximate 25-fold greater increase in Hp mRNA levels than did liver (see Fig. 3). Glycerol-induced rhabdomyolysis/myohemoglobinemia increased hepatic Hp mRNA, but the increases were only approximately one-third of those seen in kidney. Surprisingly, renal I/R increased hepatic Hp mRNA levels (possibly as a response to surgical stress and uremia). However, as with the glycerol model, the values in liver were just one-third of those observed in renal cortex.
Fig. 3.
Comparison of hepatic vs. renal cortical Hp mRNA increases following Gly (left), LPS (middle), and I/R-induced AKI (fold increases over control values; right). Both Gly-induced rhabdomyolysis and LPS injection increased hepatic mRNA, most likely due to the direct effect of LPS and Gly-induced myohemoglobinemia on the liver. However, the fold increase was far greater in kidney. Following renal ischemia (and/or surgical stress/effects of uremia), hepatic Hp mRNA was also increased, but again, the increase was greater in the injured kidney. Values are means ± SE.
AKI-Induced Hp mRNA Elevations Are Translated into Increased Hp Protein Levels
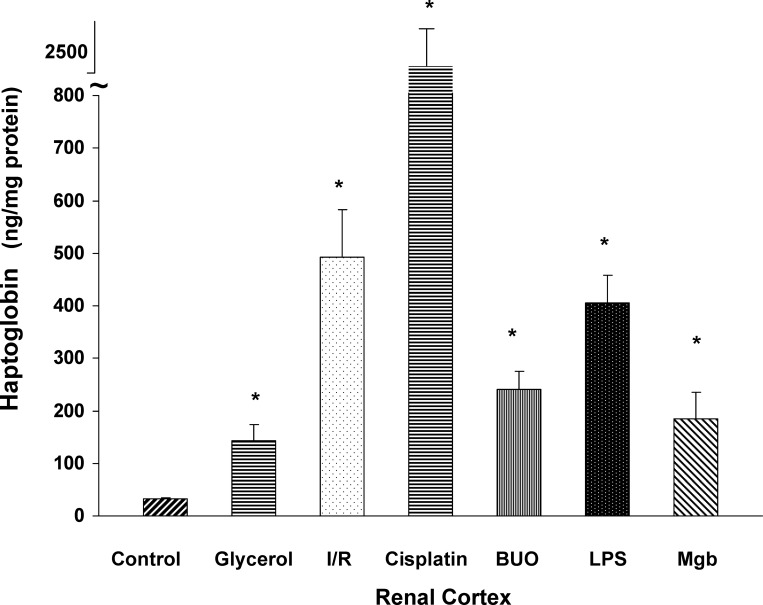
To determine whether the AKI-induced increases in Hp mRNA levels were translated into Hp protein, renal cortical samples were probed for Hp by ELISA. As shown in Fig. 4, each of the six AKI models tested induced marked Hp increases in renal cortex. However, the degree of increase varied dramatically with the different AKI models. For example, glycerol and myoglobin injection caused ∼3-fold increases; conversely, I/R, BUO, and LPS caused ∼8- to 10-fold increases. Finally, CP nephrotoxicity evoked the greatest renal cortical Hp elevation, rising from 33 to ∼2,500 ng/mg protein at 72 h.
Fig. 4.
Hp protein levels in kidney following each of the six models of experimental AKI. Each of the AKI models caused a significant increase (*P < 0.05 vs. controls) in renal cortical Hp protein levels. However, the degree of elevation varied dramatically among the groups. Values are means ± SE.
AKI-Induced Renal Cortical Hp Protein Elevations Are Associated with Increased Urinary Hp Excretion
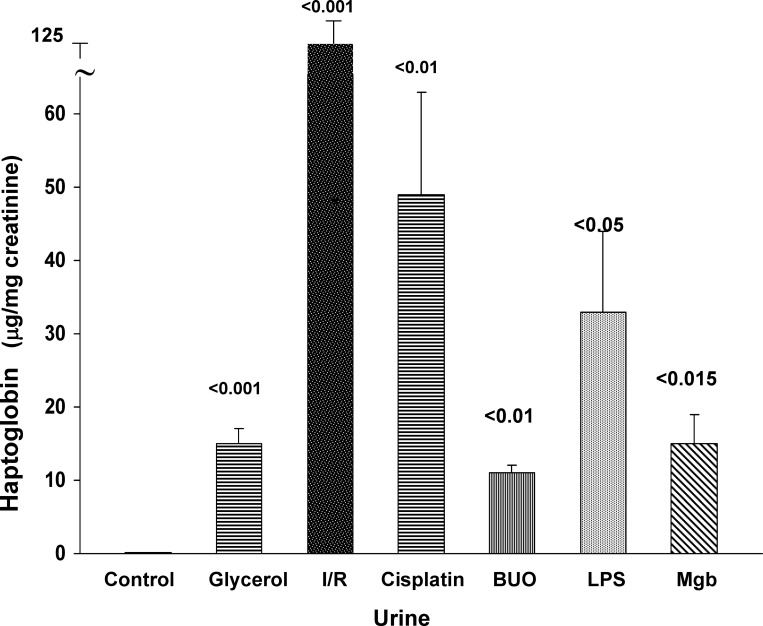
To determine whether the AKI-induced increases in renal cortical Hp mRNA and protein levels were associated with increases in urinary Hp levels, three to four urine samples were obtained at 24 h (or in the case of CP, 72 h) following induction of the different AKI models, and they were assayed for Hp by ELISA. As shown in Fig. 5, each AKI model induced marked, and significant, increases in urine Hp levels (factored by urine creatinine). The degrees of elevation varied with the type of renal injury and ranged from 15 to 125 μg/mg creatinine. The urinary Hp elevations, in large part, mirrored the relative increases in renal cortical Hp levels. Control urine samples had barely detectable Hp levels (<0.1 μg/mg creatinine).
Fig. 5.
Urine Hp protein levels following AKI. Urine samples were assayed for Hp at 24 h postinduction of I/R injury, or Gly, LPS, or purified Mgb injection. Urine samples, aspirated from the dilated renal pelvis at 24 h following BUO, and urine obtained 72 h post-CP injection were also assayed. Each form of renal injury caused marked urinary Hp increases, although the degree of increase varied substantially between the different treatment groups. All values are expressed after factoring by urine creatinine. Values are means ± SE.
Plasma Hp Levels Are Elevated Following AKI
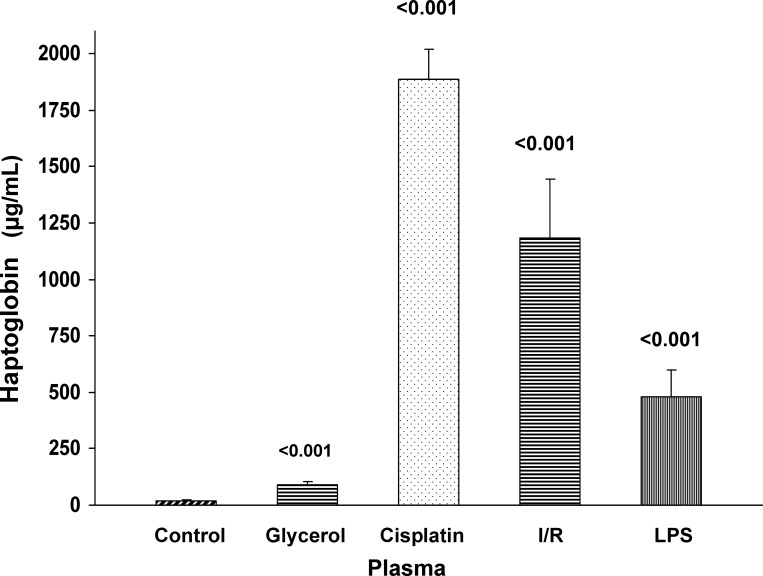
As shown in Fig. 6, each of the tested AKI models caused significant increases in plasma Hp concentrations. As with urine, the degree of plasma elevations differed markedly and roughly reflected the increases in renal cortical Hp levels.
Fig. 6.
Plasma Hp levels following Gly, CP, I/R, or LPS-induced AKI. Each form of renal injury increased plasma Hp concentrations, although the values varied considerably among the different groups. Values are means ± SE. P values are compared with control plasma samples.
Renal Cortical Western Blotting Reveals Marked AKI-Induced Increases in Hp Protein Levels
To confirm the ELISA data (i.e., that AKI increased renal cortical Hp protein levels), and to determine whether intact Hp protein was being produced, renal cortical protein extracts were probed for Hp by Western blotting. As depicted in Fig. 7, no clearly detectable Hp band was observed in control kidney tissue extracts. Conversely, marked Hp increases were observed in each of the AKI tissue samples and within the expected size range of ∼45–48 kDa (consistent with Hp α/β-dimers; see discussion). The band densities (Hp protein amounts) in the CP, I/R, and LPS samples were roughly equivalent, but lesser band densities were observed in glycerol AKI samples. These results were consistent with the relative amounts of Hp protein in renal cortex, as quantified by ELISA. Thus Western blotting confirmed that 1) AKI markedly raises renal cortical Hp protein levels; and 2) that the Hp is of the expected size (i.e., intact protein was being made).
Fig. 7.
Western blot of renal cortical protein samples obtained 24 h following I/R, Gly, or LPS-mediated AKI or 72 h postinduction of CP nephrotoxicity. Each of the AKI models expressed high levels of Hp, as indicated by dense bands appearing within the expected 44- to 48-kDa size range. In contrast, Hp was either barely detectable or undetectable in the control (C) renal cortical samples.
Time Course of Hp Expression Following Ischemic AKI
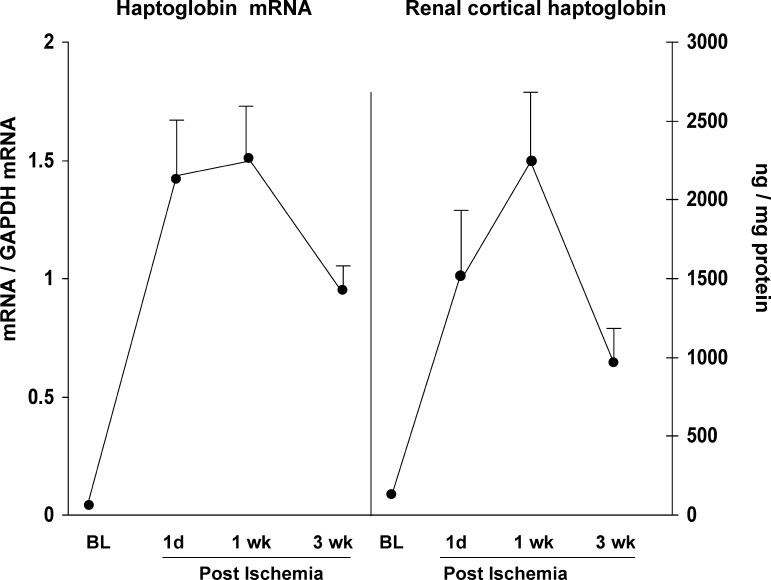
To assess the durability of the Hp response following AKI, Hp mRNA and protein levels were measured over a 3-wk time course in a unilateral 30-min I/R model (37). As shown in Fig. 8, Hp mRNA and protein levels were markedly elevated at 1 day postischemia, and these increases were sustained, or further increased, at the 1-wk time point. By 3 wk postischemia, both the mRNA and protein levels had declined by ∼35% from peak (1 wk) values. However, given that the employed unilateral ischemia model is associated with an approximate two-thirds loss of renal mass by 3 wk postischemia (34), these declining Hp mRNA and protein levels appeared to mirror this loss of renal parenchyma, rather than a decline in either Hp mRNA or protein production per residual nephron.
Fig. 8.
Renal cortical Hp mRNA and protein levels over a 3-wk time course following unilateral ischemic renal injury. Stepwise increases in Hp mRNA and/or protein levels were observed from 1 day to 1 wk postischemia. Absolute values of both the mRNA and protein levels were also elevated at 3 wk postischemia (depicted by the solid lines), although they were lower than the 1-wk postischemia values. However, if one factors the 3-wk values by the two-thirds reduction in renal mass, progressive increases in both mRNA and protein levels per remaining functional renal mass were observed. Values are means ± SE.
AKI-induced Hp mRNA and Protein Elevations Are Expressed in Isolated Proximal Tubules
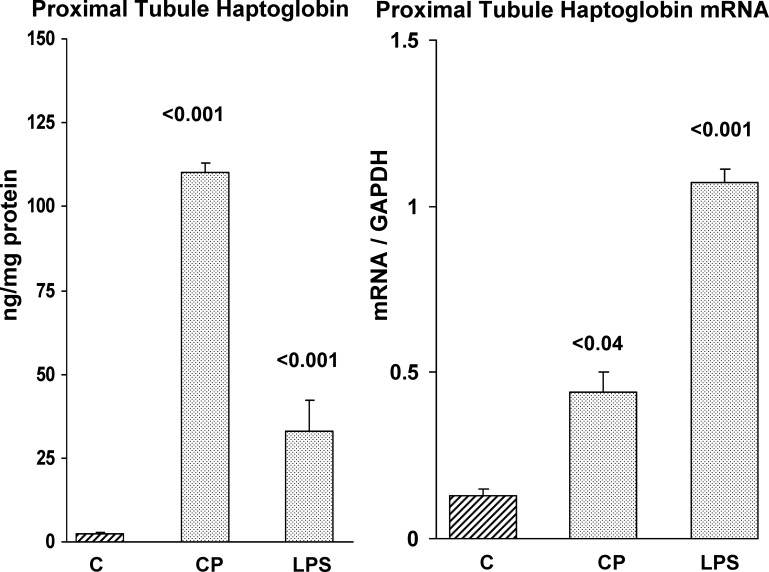
As shown in Fig. 9, isolated proximal tubules obtained from mouse renal cortex 2 days post-CP injection or 1 day post-LPS injection manifested marked elevations of both Hp protein and mRNA. This indicated that the Hp protein and mRNA elevations observed in whole kidney tissue were due, at least part, to changes within proximal tubule epithelium (the prime target of ischemic and toxic AKI).
Fig. 9.
Hp mRNA and protein levels are elevated in isolated proximal tubules obtained from control mice (C), and from mice that were either subjected to CP or LPS-induced AKI. Control mice proximal tubules showed low levels of Hp and mRNA. In contrast, tubules isolated from mice exposed to CP or LPS injection (48 and 24 h before tubule isolation) showed marked Hp mRNA and protein increases, compared with control tubules. Values are means ± SE.
Immunohistochemistry Localized the Hp Increases to Proximal Tubules
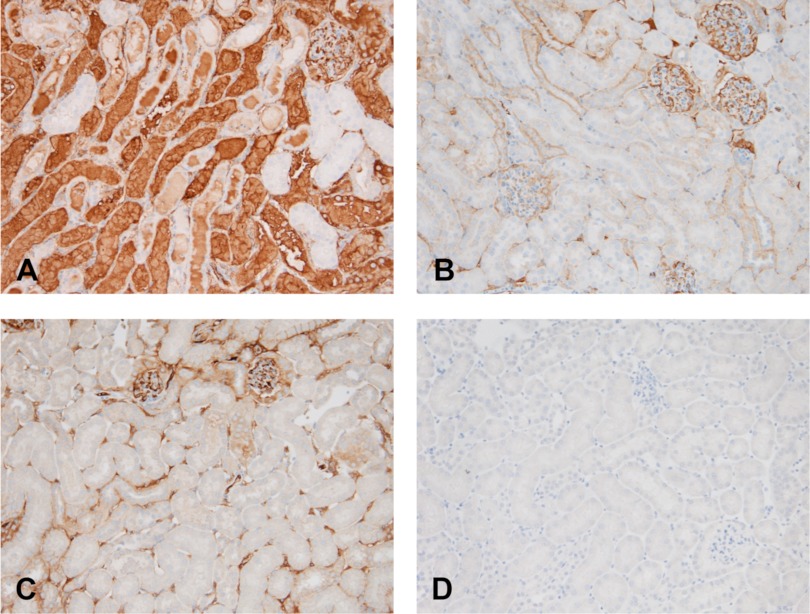
To further assess the location of the renal cortical Hp increases, a normal kidney, a unilateral postischemic kidney, and its contralateral control were each probed for Hp by immunohistochemistry. As shown in Fig. 10A, there was dramatic Hp staining of proximal tubules within the cortex and outer medullary stripe. Hp was also seen in proximal tubular lumina. While small amounts of Hp were observed within glomeruli and vasa rectae, this staining was no greater than that seen in control kidney (and likely reflected Hp within the vascular compartment). Distal nephron segments were devoid of detectable Hp staining. As shown in Fig. 10A, the normal kidney showed no Hp staining, excepting small amounts within the glomerulus and peritubular capillaries. Of note, the contralateral (nonischemic) kidney obtained from a mouse with unilateral ischemia recapitulated the findings seen in the normal kidney. This indicated that the high Hp expression in the postischemic kidney reflected renal Hp production, rather than potential Hp uptake from the systemic circulation.
Fig. 10.
Immunohistochemical localization of Hp protein within postischemic proximal tubules. A: at 24 h postunilateral ischemic injury, a marked increase in Hp staining was observed in cortical/outer medullary stripe proximal tubules and tubular lumina. Conversely, no Hp staining was observed in distal nephron segments. Hp staining was observed in glomerular capillary tufts (top right) and in peritubular capillaries, likely reflecting Hp within the circulation. B: in contrast to the postischemic kidney, no proximal tubule Hp staining was observed in the contralateral (nonischemic) kidney, although, once again, Hp was present within the glomeruli. C: staining of the normal kidney for Hp revealed only small amounts within glomerular capillary tufts and in peritubular capillaries. Specifically, no proximal tubule staining was observed. D: probing of normal kidney with nonimmune isotype (control) IgG demonstrates no staining.
Urine Samples From Patients with AKI Express Increased Amounts of Hp, Compared with Either Normal Subjects or Patients With CKD
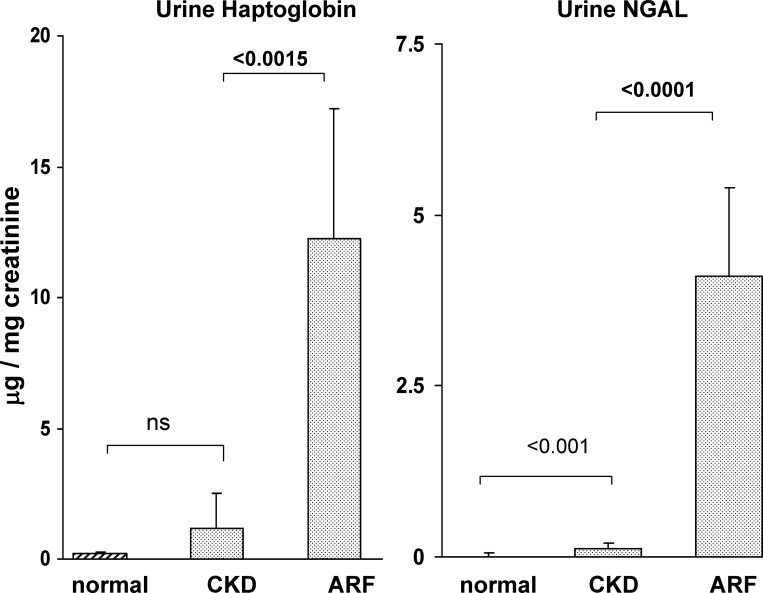
As an indirect assessment of renal Hp gene expression, urine samples were obtained from 16 patients with AKI just before initiation of RRT. Additional urine samples were collected from 15 patients with CKD of unknown origin and from 10 normal subjects. General patient demographics for the AKI and CKD cohorts are presented in Table 2. As shown in Fig. 11, the AKI patient cohort had 12-fold higher urinary Hp protein levels than did the CKD population. Thus this was consistent with the experimental AKI data, which demonstrated increased urinary Hp levels following AKI. Hp was barely detectable in normal urine samples. For comparison, the urinary Hp levels were contrasted to those for urinary NGAL, a widely accepted renal “AKI biomarker” protein. The relative degrees of urinary NGAL and Hp elevations in the AKI group, vs. the CKD group, were highly comparable. Thus this implies that the increased urinary Hp levels in the AKI patients were reflective of AKI.
Fig. 11.
Urinary Hp-to-creatinine ratios (left), and neutrophil gelatinase-associated lipoprotein (NGAL)-to-creatinine ratios (right) in patients with AKI and chronic kidney disease (CKD) and in normal human urine. Left: there was an approximate 12-fold increase in urinary Hp levels in patients with AKI, compared with patients with CKD (P < 0.0015 after log base 10 transformation). Whereas the CKD cohort appeared to have a modest increase in urine Hp levels, compared with control urine samples, this difference was not statistically significant. The relative increase in urine Hp-to-creatinine ratios for the AKI vs. the CKD patients was essentially the same as that for NGAL, used as a comparator AKI biomarker protein. Values are means ± SE.
DISCUSSION
It is widely recognized that hepatic Hp synthesis is triggered by heterogeneous stimuli, including infection, inflammation, oxidative stress, trauma, and malignancies (25). It is usually initiated by inflammatory cytokines, most notably IL-6, which activates the STAT3 (signal transducer and activator of transcription 3) signal transduction pathway (10, 17). It has recently been suggested that hypoxia inducible factor (HIF)-1α, and possibly NF-κB, can act synergistically with STAT3 signaling (21, 31), thereby contributing to Hp gene activation under conditions of hypoxia or ischemia-induced tissue stress. Because of the diverse factors that can trigger the Hp synthetic pathway, and given the rapidity of its response, Hp is considered to be an “acute phase reactant” and thus part of the “acute stress response”.
Although the liver is, by far, the dominant site of stress-induced Hp synthesis, there are suggestions that, under selected circumstances, extrahepatic Hp production (e.g., in lung, vasculature, and adipocytes; Ref. 33) can result. In light of the fact that most of the factors that trigger hepatic Hp synthesis are also operative during AKI (e.g., HIF-1α/STAT3/NF-κB/IL-6 signaling; inflammation; oxidative stress), we questioned whether Hp is also an “acute phase reactant” in kidney. Initial support for this possibility comes from a recent proteomics study, which documented increased amounts of a Hp precursor protein in mouse renal cortex following 3 days of ureteral obstruction (15).
Given the above considerations, we sought Hp gene induction in six highly diverse models of AKI: I/R, glycerol, CP, myoglobin nephrotoxicity, BUO, and endotoxemia. Hp gene expression was assessed by measuring renal cortical Hp mRNA during the so-called “initiation” and “maintenance” phases of ARF (4 and 24 h, respectively, except for CP, where assessments were made at 24 and 72 h). With the I/R, LPS, and CP models, Hp mRNA increases were observed during the AKI initiation phase, and, upon reaching the ARF maintenance phase, ∼5- to 10-fold Hp mRNA elevations were documented in each of the six AKI models. To assess whether these increased mRNA levels were translated into protein, renal cortical Hp protein levels were also assessed. As shown in Fig. 4, marked Hp elevations were observed, although the degrees varied considerably among the different ARF groups. For example, with glycerol or myoglobin injection, three- to fourfold Hp increases were noted. Conversely, with I/R or CP nephrotoxicity, ∼10- to 100-fold renal cortical Hp protein elevations were observed. It is noteworthy that these quantitative differences in Hp protein levels were expressed, despite somewhat equivalent Hp mRNA increases among most of the AKI groups. This suggests that the quantitative differences in AKI-induced renal cortical Hp protein increases were not simply a result of different gene transcription rates. Rather, model-specific differences in Hp mRNA translation, or possible differences in Hp uptake from, or into, the systemic circulation, may also have played roles.
To assess whether AKI-induced Hp gene induction is a transient or durable response, we next assessed the time course of Hp mRNA and protein expression for 3 wk following unilateral ischemic injury. As depicted in Fig. 8, increased Hp gene expression was observed throughout the course of these experiments. In this regard, the 3-wk values are particularly noteworthy because, by this time, an approximate two-thirds loss of renal mass had occurred (37). Thus, if one factors the observed 3-wk Hp mRNA and protein values by the amount of residual renal mass, it appears that there was progressive Hp gene induction in residual nephrons. These results indicate that, in addition to Hp being a kidney “acute phase reactant”, once induced, it is remarkably sustained.
Given the heterogeneity of cell types within renal cortex, the observed renal cortical Hp mRNA and protein increases could potentially reflect changes in multiple nephron segments, including glomeruli, tubules, vasculature, as well as infiltrating inflammatory cells. Because the proximal tubule is the primary site of nephrotoxic and ischemic renal injury, we sought to determine whether it participated in the Hp gene induction response. Toward this end, PTS were isolated from mice 2 days following CP injection, and Hp mRNA and protein levels in them were assessed. As depicted in Fig. 9, marked increases in both Hp protein and mRNA levels were observed. In contrast to ischemic or toxic injury, endotoxemia evokes an acute renal “stress response” in the relative absence of tubular cell death. To assess whether proximal tubules would manifest Hp gene induction under these conditions, PTS were isolated post-LPS injection, and, once again, marked Hp mRNA and protein increases occurred. Finally, to assess whether the proximal tubule was the dominant site of injury-induced Hp accumulation, immunohistochemistry was performed on postischemic and control kidney samples. Indeed, dramatic, and proximal tubule-specific, Hp increases were observed (i.e., there was no evidence of increased HP staining elsewhere within the kidney). Noteworthy was that the nonischemic contralateral kidney did not manifest increased proximal tubule Hp staining. Given that both the postischemic and contralateral kidney were exposed to the same plasma Hp concentration, these results clearly indicate that proximal tubule Hp synthesis, not increased tubular uptake from the systemic circulation, caused the elevated proximal tubule Hp levels.
Because ELISA measures specific epitopes on target proteins, it is possible that the AKI-induced Hp increases could have reflected either Hp precursors or degradation products. Therefore, to confirm that AKI did, indeed, increase intact Hp in kidney, renal cortical extracts from different AKI models were probed by Western blotting. In this regard, Hp normally exists as an approximate 88-kDa protein, consisting of two linked α/β-dimers (24). When subjected to Western blotting, the two dimers separate and appear with an expected molecular mass of ∼44–48 kDa. As shown in Fig. 7, all of the tested AKI samples demonstrated striking Hp increases within the expected molecular mass range. Conversely, Hp could not be detected in any of the normal kidney extracts. Thus, in addition to confirming the ELISA results of increased Hp protein levels with AKI, the Western blot results underscore that mature Hp protein was being made.
Given that diverse forms of experimental AKI increased renal cortical Hp synthesis, and given that Hp is a secreted protein, we questioned whether AKI might increase either plasma or urinary Hp levels. As shown in Figs. 5 and 6, this was clearly the case, given that dramatic plasma and urinary Hp increases were observed. However, an important caveat in interpreting the plasma results is that they could have potentially reflected hepatic Hp production. Thus, to assess relative renal vs. hepatic Hp gene responses, we measured Hp mRNA levels in simultaneously collected renal cortical and hepatic RNA extracts. As shown in Fig. 3, each of the AKI models evoked hepatic, as well as renal, Hp mRNA increases. However, in every case, the increase was greater in kidney. Of particular interest were the LPS results, given that the kidney manifested an approximate 25-fold greater Hp mRNA increase (compared with basal values) than did liver. This underscores that the kidney is, indeed, a prominent participant in the systemic Hp “stress response”. The relative degrees to which the kidney vs. the liver contributed to the elevated plasma Hp levels remain unknown. In contrast, it is likely that the kidney was the major source of urinary Hp, given that the relatively large size of circulating Hp (88 kDa; two α/β-dimers joined by a disulfide bridge) would likely limit its glomerular filtration and hence its urinary excretion. Furthermore, the immunohistochemistry finding of Hp gaining access to tubular lumina supports this assumption.
In an attempt to gain clinical evidence for AKI-initiated Hp gene activation, urine samples were obtained from 16 patients with established AKI, from 15 patients with CKD, and from 10 normal subjects. The samples were then assayed for Hp concentrations, and the results were compared between the groups. As shown in Fig. 11, the AKI group manifested ∼12-fold greater urinary Hp levels than did the CKD patients. Indeed, the CKD patients did not have significant urine Hp elevations, compared with normal subjects. Thus these results recapitulated the experimental findings of increased urinary Hp excretion in response to AKI. We cannot definitively exclude the possibility that, despite its high molecular mass (88 kDa), some of the urinary Hp in the AKI patients could have been derived from the systemic circulation via glomerular filtration. However, in this regard, it is notable that the relative increase in urinary Hp concentrations in the AKI vs. the CKD patients was almost exactly paralleled by NGAL, a well-accepted, intrarenally generated AKI biomarker. This implies that the urinary Hp increases in the AKI patients did, indeed, reflect intrarenal Hp synthesis.
In conclusion, this study provides the first experimental and clinical evidence that diverse forms of AKI evoke a rapid, marked, and sustained induction of the renal cortical Hp gene, and that the proximal tubule is the dominant site of this Hp production. Corollaries of this Hp gene induction are increases in both plasma and urinary Hp levels, thereby serving as surrogate markers of this response. The pathophysiological relevance of the resultant marked increases in renal cortical/proximal Hp protein levels to the pathogenesis of evolving AKI remains to be defined. However, that Hp can exert potent anti-oxidant effects (7, 30) and that it can impact both anti-inflammatory (3–5, 13, 14, 25), as well as proinflammatory (28), tissue injury responses suggest that Hp gene induction may well impact AKI pathogenesis and/or outcomes. However, definitive proof for this supposition must await further study.
GRANTS
This work was supported by grants from the National Institute of Diabetes and Digestive and Kidney Diseases (DK38432; DK083310) and the George M. O'Brien Center for Kidney Disease Research (DK079333).
DISCLOSURES
No conflicts of interest, financial or otherwise, are declared by the author(s).
AUTHOR CONTRIBUTIONS
R.A.Z., A.V., and A.C.J. conception and design of research; R.A.Z. and A.C.J. analyzed data; R.A.Z. interpreted results of experiments; R.A.Z. prepared figures; R.A.Z. drafted manuscript; R.A.Z. and A.C.J. edited and revised manuscript; R.A.Z., A.V., and A.C.J. approved final version of manuscript; A.C.J. performed experiments.
ACKNOWLEDGMENTS
The authors thank Kirsten Becker for help with the experimental acute kidney injury experiments, and Marta Santos for assisting with AKI patient enrollment and urine sample collection. We also thank Dr. Bryan Kestenbaum, University of Washington, Seattle, WA, for providing urine samples from patients with CKD.
REFERENCES
- 1. Alper CA, Peters JH, Birth AG, Gardner FH. Haptoglobin synthesis. I. In vivo studies of the production of haptoglobin, fibrinogen, and γ-globulin by the canine liver. J Clin Invest 44: 574–581, 1965 [DOI] [PMC free article] [PubMed] [Google Scholar]
- 2. Alper CA, Raum D, Awdeh ZL, Peterson BH, Taylor PD, Starzl TE. Studies of hepatic synthesis in vivo of plasma proteins, including orosomucoid, transferrin, α1 antitrypsin, C8, and factor B. Clin Immunol Immunopathol 16: 84–89, 1980 [DOI] [PubMed] [Google Scholar]
- 3. Arredouani MS, Kasran A, Vanoirbeek JA, Berger FG, Baumann H, Ceuppens JL. Haptoglobin dampens endotoxin-induced inflammatory effects both in vitro and in vivo. Immunology 114: 263–271, 2005 [DOI] [PMC free article] [PubMed] [Google Scholar]
- 4. Arredouani M, Matthys P, Kasran A, Baumann H, Ceuppen JL. Haptoglobin and the Th1/Th2 balance: hints from in vitro and in vivo studies. Redox Rep 6: 369–371, 2001 [DOI] [PubMed] [Google Scholar]
- 5. Arredouani M, Matthijs P, Van Hoeyveld E, Kasran A, Baumann H, Ceuppens JL, Stevens E. Haptoglobin directly affects T cells and suppresses T helper cell type 2 cytokine release. Immunology 108: 144–151, 2003 [DOI] [PMC free article] [PubMed] [Google Scholar]
- 6. Asleh R, Levy AP. In vivo and in vitro studies establishing haptoglobin as a major susceptibility gene for diabetic vascular disease. Vasc Health Risk Manag 1: 19–28, 2005 [DOI] [PMC free article] [PubMed] [Google Scholar]
- 7. Blum S, Asaf R, Guetta J, Miller-Lotan R, Asleh R, Kremer R, Levy NS, Berger FG, Aronson D, Fu X, Zhang R, Hazen SL, Levy AP. Haptoglobin genotype determines myocardial infarct size in diabetic mice. J Am Coll Cardiol 49: 82–87, 2007 [DOI] [PubMed] [Google Scholar]
- 8. Bonventre JV, Zuk A. Ischemic acute renal failure: an inflammatory disease? Kidney Int 66: 480–485, 2004 [DOI] [PubMed] [Google Scholar]
- 9. Boretti FS, Buehler PW, D'Agnillo F, Kluge K, Glaus T, Butt OI, Jia Y, Goede J, Pereira CP, Maggiorini M, Schoedon G, Alayash AI, Schaer DJ. Sequestration of extracellular hemoglobin within a haptoglobin complex decreases its hypertensive and oxidative effects in dogs and guinea pigs. J Clin Invest 119: 2271–2280, 2009 [DOI] [PMC free article] [PubMed] [Google Scholar]
- 10. Brock M, Trenkmann M, Gay RE, Gay S, Speich R, Huber LC. MicroRNA-18a enhances the interleukin-6-mediated production of the acute-phase proteins fibrinogen and haptoglobin in human hepatocytes. J Biol Chem 286: 40142–40150, 2011 [DOI] [PMC free article] [PubMed] [Google Scholar]
- 11. Chen YC, Lee CC, Huang CY, Huang HB, Yu CC, Ho YC, Su YC. Haptoglobin polymorphism as a risk factor for chronic kidney disease: a case-control study. Am J Nephrol 33: 510–514, 2011 [DOI] [PubMed] [Google Scholar]
- 12. Conway BR, Savage DA, Brady HR, Maxwell AP. Association between haptoglobin gene variants and diabetic nephropathy: haptoglobin polymorphism in nephropathy susceptibility. Nephron Exp Nephrol 105: e75–e79, 2007 [DOI] [PubMed] [Google Scholar]
- 13. El-Ghmati SM, Arredouani M, Van Hoeyveld EM, Ceuppens JL, Stevens EA. Haptoglobin interacts with the human mast cell line HMC-1 and inhibits its spontaneous proliferation. Scand J Immunol 55: 352–358, 2002 [DOI] [PubMed] [Google Scholar]
- 14. Galicia G, Maes W, Verbinnen B, Kasran A, Bullens D, Arredouani M, Ceuppens JL. Haptoglobin deficiency facilitates the development of autoimmune inflammation. Eur J Immunol 39: 3404–342, 2009 [DOI] [PubMed] [Google Scholar]
- 15. Giannakis E, Samuel CS, Hewitson TD, Boon WM, Macris M, Reeve S, Lawrence J, Ian Smith A, Tregear GW, Wade JD. Aberrant protein expression in plasma and kidney tissue during experimental obstructive nephropathy. Proteomics Clin Appl 3: 1211–1224, 2009 [DOI] [PubMed] [Google Scholar]
- 16. Kato GJ. Haptoglobin halts hemoglobin's havoc. J Clin Invest 119: 2140–2142, 2009 [DOI] [PMC free article] [PubMed] [Google Scholar]
- 17. Kim H, Baumann H. The carboxyl-terminal region of STAT3 controls gene induction by the mouse haptoglobin promoter. J Biol Chem 272: 14571–14579, 1997 [DOI] [PubMed] [Google Scholar]
- 18. Korrapati MC, Shaner BE, Schnellmann RG. Recovery from glycerol-induced acute kidney injury is accelerated by suramin. J Pharmacol Exp Ther 341: 126–136, 2012 [DOI] [PMC free article] [PubMed] [Google Scholar]
- 19. Lim YK, Jenner A, Bin Ali A, Wang Y, IHong Hsu S, Chong SM, Baumman H, Halliwell B, Lim SK. Haptoglobin reduces renal oxidative DNA and tissue damage during phenylhydrazine-induced hemolysis. Kidney Int 58: 1033–1044, 2000 [DOI] [PubMed] [Google Scholar]
- 20. Nakhoul FM, Miller-Lotan R, Awaad H, Asleh R, Levy AP. Hypothesis–haptoglobin genotype and diabetic nephropathy. Nat Clin Pract Nephrol 3: 339–344, 2007 [DOI] [PubMed] [Google Scholar]
- 21. Oh MK, Park HJ, Kim NH, Part SJ, Park IY, Kim IN. Hypoxia inducibe factor-1α enhances haptoglobin gene expression by improving binding of STAT3 to the promoter. J Biol Chem 286: 8857–8865, 2011 [DOI] [PMC free article] [PubMed] [Google Scholar]
- 22. Peters JH, Alper CA. Haptoglobin synthesis. II. Cellular localization studies. J Clin Invest 45: 314–320, 1965 [DOI] [PMC free article] [PubMed] [Google Scholar]
- 23. Pintera J, Tomásěk V. The protective influence of haptoglobin on hemoglobinuric kidney. II. Microscopic observations and clinical aspect. Int Z Klin Pharmakol Ther Toxikol 4: 371–377, 1970 [PubMed] [Google Scholar]
- 24. Polticelli F, Bocedi A, Minervini G, Ascenzi P. Human haptoglobin structure and function–a molecular modelling study. FEBS J 275: 5648–5656, 2008 [DOI] [PubMed] [Google Scholar]
- 25. Quaye IK. Haptoglobin, inflammation disease. Trans R Soc Trop Med Hyg 102: 735–742, 2008 [DOI] [PubMed] [Google Scholar]
- 26. Sadrzadeh SM, Bozorgmehr J. Haptoglobin phenotypes in health and disease. Am J Clin Pathol 121: S97–S104, 2004 [DOI] [PubMed] [Google Scholar]
- 27. Sakata S, Yoshioka N, Atassi MZ. Human haptoglobin binds to human myoglobin. Biochim Biophys Acta 873: 312–315, 1986 [DOI] [PubMed] [Google Scholar]
- 28. Shen H, Song Y, Colangelo CM, Wu R, Bruce C, Scabia G, Galan A, Maffei M, Goldstein DR. Haptoglobin activates innate immunity to enhance acute transplant rejection in mice. J Clin Invest 122: 383–387, 2012 [DOI] [PMC free article] [PubMed] [Google Scholar]
- 29. Tadagavadi RK, Reeves WB. Endogenous IL-10 attenuates cisplatin nephrotoxicity: role of dendritic cells. J Immunol 185: 4904–4911, 2010 [DOI] [PMC free article] [PubMed] [Google Scholar]
- 30. Tseng CF, Lin CC, Huang HY, Liu HC, Mao SJ. Antioxidant role of human haptoglobin. Proteomics 4: 2221–2228, 2004 [DOI] [PubMed] [Google Scholar]
- 31. Uskoković A, Dinić S, Mihailović M, Grdović N, Arambaǐć J, Vidaković M, Bogojević D, Ivanović-Matić S, Martinović V, Petrović M, Poznanoví G, Grigorov I. STAT3/NF-κB interactions determine the level of haptoglobin expression in male rats exposed to dietary restriction and/or acute phase stimuli. Mol Biol Rep 39: 167–176, 2012 [DOI] [PubMed] [Google Scholar]
- 32. Vercellotti GM, Balla G, Balla J, Nath K, Eaton JW, Jacob HS. Heme and the vasculature: an oxidative hazard that induces antioxidant defenses in the endothelium. Artif Cells Blood Substit Immobil Biotechnol 22: 207–213, 1994 [DOI] [PubMed] [Google Scholar]
- 33. Vernochet C, Davis KE, Scherer PE, Farmer SR. Mechanisms regulation repression of haptoglobin production by peroxisome proliferative-activated receptor-γ ligands in adipocytes. Endocrinology 151: 586–594, 2010 [DOI] [PMC free article] [PubMed] [Google Scholar]
- 34. Ware LB, Johnson AC, Zager RA. Renal cortical albumin gene induction and urinary albumin excretion in response to acute kidney injury. Am J Physiol Renal Physiol 300: F628–F638, 2011 [DOI] [PMC free article] [PubMed] [Google Scholar]
- 35. Wobeto VP, Garcia PM, Zaccariotto TR, Sonati Mde F. Haptoglobin polymorphism and diabetic nephropathy in Brazilian diabetic patients. Ann Hum Biol 36: 437–441, 2009 [DOI] [PubMed] [Google Scholar]
- 36. Yoshioka T, Sugimoto T, Ukai T, Oshiro T. Haptoglobin therapy for possible prevention of renal failure following thermal injury: a clinical study. J Trauma 25: 281–288, 1985 [DOI] [PubMed] [Google Scholar]
- 37. Zager RA, Johnson AC, Becker K. Acute unilateral ischemic renal injury induces progressive renal inflammation, lipid accumulation, histone modification, and “end-stage” kidney disease. Am J Physiol Renal Physiol 301: F1334–F1345, 2011 [DOI] [PMC free article] [PubMed] [Google Scholar]
- 38. Zager RA, Johnson AC, Lund S, Hanson S. Acute renal failure: determinants and characteristics of the injury-induced hyperinflammatory response. Am J Physiol Renal Physiol 291: F546–F556, 2006 [DOI] [PubMed] [Google Scholar]
- 39. Zager RA, Schimpf BA, Gmur DJ, Burke TJ. Phospholipase A2 activity can protect renal tubules from oxygen deprivation injury. Proc Natl Acad Sci U S A 90: 8297–82301, 1993 [DOI] [PMC free article] [PubMed] [Google Scholar]


