

Abstract
Gene regulation at functional elements (e.g., enhancers, promoters, insulators) is governed by an interplay of nucleosome remodeling, histone modifications, and transcription factor binding. To enhance our understanding of gene regulation, the ENCODE Consortium has generated a wealth of ChIP-seq data on DNA-binding proteins and histone modifications. We additionally generated nucleosome positioning data on two cell lines, K562 and GM12878, by MNase digestion and high-depth sequencing. Here we relate 14 chromatin signals (12 histone marks, DNase, and nucleosome positioning) to the binding sites of 119 DNA-binding proteins across a large number of cell lines. We developed a new method for unsupervised pattern discovery, the Clustered AGgregation Tool (CAGT), which accounts for the inherent heterogeneity in signal magnitude, shape, and implicit strand orientation of chromatin marks. We applied CAGT on a total of 5084 data set pairs to obtain an exhaustive catalog of high-resolution patterns of histone modifications and nucleosome positioning signals around bound transcription factors. Our analyses reveal extensive heterogeneity in how histone modifications are deposited, and how nucleosomes are positioned around binding sites. With the exception of the CTCF/cohesin complex, asymmetry of nucleosome positioning is predominant. Asymmetry of histone modifications is also widespread, for all types of chromatin marks examined, including promoter, enhancer, elongation, and repressive marks. The fine-resolution signal shapes discovered by CAGT unveiled novel correlation patterns between chromatin marks, nucleosome positioning, and sequence content. Meta-analyses of the signal profiles revealed a common vocabulary of chromatin signals shared across multiple cell lines and binding proteins.
The multimeric structure of informational macromolecules (DNA, RNA, and protein) and their obligatory directional synthesis imbues the genome with local, inherent polarity. The polarity of transcription units is determined at the promoter by the signals that instruct RNA polymerase to engage DNA in one particular orientation, such that RNA synthesis can proceed in the correct direction. At RNA polymerase II promoters, which are responsible for the transcription of protein-coding and lncRNA genes, two types of protein–DNA interactions correlate with the direction of transcription: (1) the binding of transcription factors in the promoter region and (2) the positioning of nucleosomes in a statistically stereotypical pattern around a complex consisting of the bound RNA polymerase, its general cofactors, and promoter-specific transcription factors (Yuan et al. 2005; Mavrich et al. 2008). In addition, certain histone modifications are deployed asymmetrically at promoters. For example, nucleosomes that bear the H3K4me3 modification can occupy the first location immediately ‘downstream’ from the transcription start site, with a signal present, but progressively decaying, upstream as well as further downstream (e.g., Barski et al. 2007; Valouev et al. 2011).
In many organisms and cell types, genome-wide mapping of transcription factor binding sites (TFBSs) and chromatin modifications by ChIP-seq experiments has suggested the generality of such relationships across the eukaryotic genome (Barski et al. 2007; Lee et al. 2007; Mavrich et al. 2008; Schones et al. 2008; Valouev et al. 2011; Zhou et al. 2011). A popular and highly effective method for visualizing and quantifying relationships among genomic signals is the so-called aggregation plot (AP) (Jee et al. 2011). The AP is almost universally used in genomic studies to illustrate and quantify characteristics of gene-regulatory functional elements (Wang et al. 2012). In a typical AP, the signal around several predefined anchor sites in the genome, all aligned at the location of a shared feature (such as a TFBS or a transcription start site) is averaged for each position within a window around the core feature. If across a substantial fraction of the aligned sites the signal behaves similarly in location and relative magnitude around the core feature, then the AP will reveal statistically significant signal fluctuations or patterns with specific symmetry characteristics around the core feature. For example, nucleosome positioning and the H3K4me3 histone modification, as well as the nucleosome-free region and RNA polymerase II positioning, occur sufficiently stereotypically around transcription start sites (TSSs) that the asymmetries and signal variations are readily apparent in a traditional AP (e.g., Barski et al. 2007; Lee et al. 2007; Mavrich et al. 2008; Schones et al. 2008; Valouev et al. 2011). For an AP to display such asymmetric signals, the alignment of features (e.g., TSSs) has to be robust, and some other data is utilized to provide the correct orientation. For example, in the case of APs around TSSs, for each TSS contributing to the AP, the aligning location is given by its single TSS coordinate, and the orientation is given by the direction of transcription emanating from that TSS.
Features that can be aligned, but for which there exists no external information regarding their orientation, can produce APs with strong and obligatorily symmetric signals. For example, strong symmetric signals of positioned nucleosomes are present around CTCF (Fu et al. 2008) and REST (Valouev et al. 2011) binding sites. A tempting conclusion from such APs is that the feature (e.g., REST binding) influences the biological function whose signal is measured (e.g., nucleosome positioning) equally to its ‘left’ and to its ‘right’ and that there is no directionally acting function performed by or correlated with the feature. However, this circular reasoning leads one to overlook the possibility that there is indeed a directional signal (which is either caused by or correlated with the feature), but that the lack of any information regarding the feature's orientation results in artificial symmetry. A simple hypothetical scenario illustrates this point: Consider a feature around which nucleosomes are always strongly positioned to its right but never to its left. If one is unaware of ‘right’ and ‘left’ and simply aggregates the features in random orientations, then half of the time the positioned nucleosome will appear to the right of the feature, and half of the time to the left. In the resulting AP, there will be symmetric and equally strong nucleosome positioning peaks around the feature.
Even if the orientation of a feature is known, the specific spatial properties of a signal around the feature may vary. For example, transcription factors engage in context-specific binding at subsets of their binding sites. These context-specific co-binding events, and the influence of other genomic features such as proximity to promoters, will often exhibit diverse chromatin modification and nucleosome positioning landscapes (Hu et al. 2011). Even if the profiles of the functional mark at such locations were appropriately oriented, a traditional AP that averages over all binding sites would combine these diverse profiles into a misleading aggregate that would obscure the underlying heterogeneity, and one will miss the opportunity to discover the diversity of sites.
With these considerations in mind, we set out to develop novel methodology that would allow us to analyze a large number of functional genomics data sets from the ENCODE Consortium in order to detect consistent, global, and functionally important signal asymmetries and feature relationships among TSSs, DNA-binding proteins (transcription factors and other transcriptional machinery), histone modifications, and nucleosome positioning. TSSs as well as the locations of transcription factor binding served as the aligned feature, while histone modifications and nucleosome positioning served as the signal whose shape, magnitude, and asymmetry was to be discovered and analyzed. Locations of transcription factor binding were taken from ENCODE ChIP-seq experiments and subsequent peak calling (The ENCODE Project Consortium 2012; Gerstein et al. 2012). Signals around the sites analyzed came from ENCODE histone modification ChIP-seq experiments (The ENCODE Project Consortium 2012; MM Hoffman, J Ernst, SP Wilder, A Kundaje, RS Harris, M Libbrecht, B Giardine, JA Bilmes, E Birney, RC Hardison, et al., in prep.) as well as two nucleosome positioning data sets specifically generated for this study (Table 1).
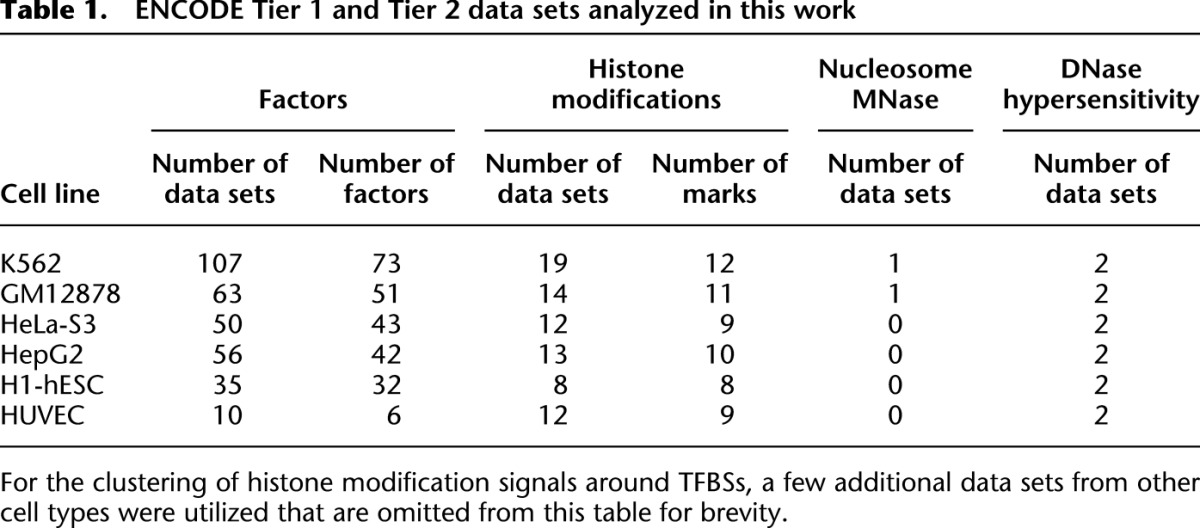
Table 1.
ENCODE Tier 1 and Tier 2 data sets analyzed in this work
Our analyses revealed that asymmetries of chromatin modifications and nucleosome positioning are a pervasive feature at TFBSs, not only at promoters but, surprisingly, equally strongly at nonpromoter sites. We detected relationships between the patterns of different chromatin marks that cannot be found by standard aggregation. We observed that the local signals of chromatin modification can be grouped across all TFBSs, cell types, and chromatin marks into a limited set of distinct shapes, suggesting a common vocabulary of chromatin modification patterns. Finally, we find widespread correlations and anticorrelations of chromatin marks around the binding sites of specific transcription factors and at promoters, which suggests that TFBSs often coincide with switch points of chromatin state.
Results
A novel method for the discovery of heterogeneous and asymmetric signal subpopulations and their associations
We developed novel methodology for relating functional elements (such as TFBSs or TSSs) and their associated signals (such as histone modifications or nucleosome positioning) and for discovering meaningful and robust signal patterns around these loci. We call our software package that implements this methodology the Clustered AGgretation Tool (CAGT). Key steps in CAGT are: (1) automatic grouping of feature sites (TFBSs, binding sites of transcriptional machinery, or TSSs) according to the strength of the associated chromatin modification or nucleosome positioning signal into “magnitude categories”; (2) automatic unsupervised clustering of sites according to the signal shape; and (3) optionally, automatic “flipping” of shapes to properly orient underlying asymmetries and cluster them accordingly if there is no other information available that might orient the feature, such as the direction of transcription at TSSs. These steps are illustrated on the basis of H3K27ac signal at CTCF binding sites in K562 (Fig. 1).
Figure 1.

Schematic of the steps followed by CAGT in order to group the signal profiles around a set of genomic features into distinct and coherent clusters. The steps are illustrated using H3K27ac signal profiles around CTCF binding sites in the K562 cell line. (1) We start by extracting the H3K27ac signal intensity profiles in a window (±500 bp) around each feature (CTCF binding site) and aligning all signals at the core of the feature (summit of the CTCF peak). The grayscale plot at the bottom is a traditional aggregation plot obtained by averaging all signal profiles. The bold line is the mean intensity, while the shaded area around it corresponds to the 10th and 90th percentiles of the signal. (2) The sites are divided into high and low signals based on the peak intensity of each H3K27ac signal profile around each site. (3) High signal sites are standardized to zero mean and unit standard deviation and clustered with the k-medians algorithm. This step typically leads to a large number of compact clusters, some of which may be redundant with similar average patterns. (4) In the final step, similar clusters, as well as clusters that are mirror images of each other, are merged using hierarchical agglomerative clustering, resulting in a small number of distinct, nonredundant, compact clusters (see Methods for details).
Nucleosome positioning around transcription start sites is highly heterogeneous
We first focused on nucleosome positioning signals around TSSs. Positioning around TSSs and promoters, and their correlation with transcription, has been well-studied previously (Fu et al. 2008; Mavrich et al. 2008; Schones et al. 2008; Shivaswamy et al. 2008; Jiang and Pugh 2009; Kaplan et al. 2009; Rando and Chang 2009; Segal and Widom 2009; Radman-Livaja and Rando 2010; Valouev et al. 2011). The current consensus on promoter configuration involves a nucleosome-free region upstream of RNA polymerase II, which in turn is bound to the promoter upstream of the so-called +1 nucleosome. We used 15,736 TSSs from the GENCODE v7 annotations (Harrow et al. 2012) as anchor points for CAGT analysis in K562 and GM12878, the two cell lines for which we had nucleosome positioning data. We excluded TSSs of bidirectional promoters to reduce confounding effects on the nucleosome positioning signal (see Methods). Because the results from both cell lines were highly similar, we limit our discussion to K562.
CAGT analysis revealed 17 clusters of distinct nucleosome positioning patterns. Eleven of these clusters contained >2% of the TSSs each and comprised a total of 89.56% of the TSSs studied (Fig. 2A; Supplemental Fig. S1). Broadly, the clusters fall into two categories: those in which there is strong positioning upstream of the TSS, and those that have strong positioning downstream. Surprisingly, no cluster had equally strong positioning on both sides of the TSSs, suggesting that the canonical pattern of a modest but detectable positioning signal emanating bidirectionally from the promoter is an averaging artifact of standard APs (Fig. 2A, first panel).
Figure 2.

(A) Nucleosome positioning patterns around TSSs in K562. The first panel is a traditional aggregation plot of the nucleosome positioning signal in a window of size 1001 bp centered on each of 15,736 GENCODE TSSs. The bold line is the mean signal across all TSSs, while the shaded area around it corresponds to the 10th and 90th percentiles. The rest of the panels show the patterns uncovered by CAGT, ordered by the percentage of TSSs that follow each pattern. Patterns corresponding to <2% of TSSs are not shown. All TSSs are reoriented so that the direction of transcription is from left to right. Plots are colored according to the third quartile of the expression of TSSs in the corresponding cluster, as measured by CAGE tags. (B) Box-plots of the expression of TSSs following each of the patterns shown in A.
To reveal correlations with transcriptional activity, we quantified expression levels based on CAGE tags for each cluster (Fig. 2B). The most prevalent cluster, comprising 20.64% of TSSs, had low levels of gene expression as measured by CAGE (Djebali et al. 2012) and exhibited no strong positioning for 900 bp around the TSS, consistent with previous analyses that used standard APs (Schones et al. 2008; Valouev et al. 2011). Other clusters that were associated with low gene expression had no positioning upstream, but pronounced and often somewhat distant positioning downstream from the TSSs. On the contrary, two clusters with high expression that together comprise 19.79% of TSSs (clusters 3 and 5) had strongly positioned nucleosomes ∼250–350 bp upstream of the TSS, but much weaker positioning downstream. A similar phenomenon has been observed in yeast, where highly expressed genes often lack a well-positioned +1 nucleosome (Zaugg and Luscombe 2011). Finally, two additional clusters (9 and 10), comprising 6.35% of TSSs, had strongly positioned nucleosomes downstream, at positions consistent with the canonical +1 assignment. Clusters with particularly pronounced nucleosome positioning peaks, either upstream of or immediately downstream from the TSS (clusters 3, 5, 9, and 10) had significantly higher expression than all other clusters (P < 0.001).
Most of the clusters that exhibited strong positioning upstream of the TSS (1, 2, 3, 5), as well as cluster 4, which also has a relatively high upstream peak, were significantly enriched in CpG promoters (P < 0.0001). The enrichment was more pronounced for clusters 1 and 2 (P ∼0), which have very low signal downstream from the TSS. Finally, we examined the enrichment of TF binding in each of the TSS clusters. Each TSS was extended upstream and downstream by 100 bp, and TF-binding locations for 73 distinct binding proteins were obtained from 105 ChIP-seq experiments in K562. The clusters with the highest expression (3 and 10) had significant overlap (P < 0.01), with the largest number of data sets (45 and 28, respectively), followed by clusters 9 and 5. Low-expression clusters (1, 2, 4, 6, and 11) showed little to no enrichment in TF binding. Interestingly, CTCF and the members of the cohesin complex RAD21 and SMC3 were enriched in cluster 3, but not in clusters 9 and 10. REST, on the other hand, was only enriched in cluster 10. Clusters with high expression and high signal downstream (9 and 10) were also enriched in the TATA-associated proteins TBP and GTF2B.
Our results from these unsupervised analyses suggest that nucleosome positioning at TSSs is more heterogeneous than previously appreciated, and also that transcriptional activity is one, but not the only contributing factor to how nucleosomes are positioned around a TSS.
Highly diverse nucleosome positioning around TFBSs
The richness of the ENCODE ChIP-seq data provides an unprecedented opportunity to understand the relationship between transcription factor binding sites and nucleosome positioning. We extracted 1001 bases of the nucleosome positioning data around the summit coordinate of each peak for all transcription factors (and other DNA-binding proteins, such as RNA Polymerase II, RAD21, etc.) that had been assayed in GM12878 and K562 (see Supplemental Section S.3 and Supplemental Fig. S2 for a discussion on using peak summits instead of motif locations as anchor points). On each of these 148 data sets, CAGT grouped the nucleosome signal for each binding protein into a small number of shapes. The vast majority of shapes were clearly asymmetric, indicating that around TFBSs, nucleosome positioning generally exhibits polarity. The only notable exceptions were the proteins of the CTCF/cohesin complex (RAD21, SMC3, and CTCF) as well as the zinc-finger containing protein, ZNF143, for which 40%–80% of the fraction of binding sites from these TF ChIP-seq data sets showed roughly symmetrically positioned nucleosomes (Supplemental Fig. S3). However, even these factors had some sites with asymmetric patterns of positioning. The majority of other factors had very few symmetric positioning patterns.
To quantify the diversity of nucleosome positions around TFBSs, and to compare positions between cell types, we computed distances between TFBSs and the nearest positioned nucleosome. Specifically, for each factor, we determined the fraction of its TFBSs that belonged to a nucleosome positioning shape cluster and then plotted this quantity as a function of the distance between the TFBS and the nucleosome positioning peak. We performed this analysis for each factor that was assayed in both GM12878 and K562 (Fig. 3A). Each factor, with the exception of the cohesin complex (CTCF, RAD21, SMC3), exhibits considerable heterogeneity. There is some similarity between the two cell types in the distributions of distances for each factor (note the paired error bars in Fig. 3A), but overall the similarity is limited.
Figure 3.

(A) Distribution of distances between the TF binding site and the closest nucleosome for all TFs assayed in both GM12878 and K562. For each TF in each cell line, we used the median signal of the clusters to compute the distance between the TF binding site and the closest nucleosome positioning peak. The area of each dot is proportional to the fraction of peaks of the TF with the given distance between the binding site and the closest nucleosome dyad. The vertical line extends from the first to the third quartile of distances for each TF. (B) Nucleosome positioning patterns uncovered by CAGT around REST binding sites in K562. (Top, left) A traditional aggregation plot, averaging the signal over all 14,144 REST sites. The rest of the panels show the CAGT clusters in order of prevalence, with the percentage of REST peaks in each shown in the header. Two clusters containing <2% of REST peaks each are omitted from the figure. Note the large diversity of nucleosome positioning shapes, with distances between the binding site and the closest nucleosome positioning peak varying widely from 10 bp (P_17) to 300 bp (P_4).
We highlight the full range of discovered patterns for two representative factors, REST (in K562, Fig. 3B) and EBF1 (in GM12878, Supplemental Fig. S4). In a standard AP (Fig. 3B, first panel), the 1 kb around REST peak exhibits weak but detectable symmetric nucleosome positioning, as described before. CAGT clearly exposes the symmetry as an artifact, with >90% of sites exhibiting asymmetric nucleosome positioning and only patterns 5 (P_5) and 16 (P_16) (Fig. 3B) exhibiting the “classic” symmetry. Interestingly, the two symmetric clusters were enriched for ChIP-seq peaks of different co-associating TFs. P_5 is enriched for RAD21 peaks, while P_16 is enriched for JUN, JUND, and FOS peaks (Supplemental Fig. S16C). EBF1, which in a standard AP would not be associated with positioned nucleosomes at all (note flat line in Supplemental Fig. S4, panel ‘all’), in fact exhibits a large diversity of nucleosome positioning shapes around its binding sites. These case studies are representative of the vast majority of factors, no matter what their function. Heterogeneity and asymmetry in nucleosome positioning appear to be the rule for protein–DNA interactions.
Positioned nucleosomes around TFBSs occupy container sites
We have previously shown that in vitro reconstituted nucleosomes exhibit particularly strong positioning when they occupy container sites (Valouev et al. 2011). Container sites are characterized by a GC-rich core of about 150 bases, which serves to attract a nucleosome, and AT-rich flanks, which repel the nucleosome and therefore lock it into a statistically preferred position, centered on the GC-rich core (Johnson et al. 2006; Segal et al. 2006; Peckham et al. 2007; Tillo et al. 2010; Tsankov et al. 2011). To investigate whether container sites are present in the vicinity of TFBSs, we investigated the relationship between the cluster-specific shapes of nucleosome positioning and the underlying sequences' base composition.
Comparison of the nucleosome positioning signal in the 1 kb around TFBSs with GC content revealed that container sites are a pervasive feature in the vicinity of TFBSs (Fig. 4; Supplemental Fig. S5). The first nucleosome immediately flanking the TFBS often occupies a container site, as evidenced by low GC content flanking a high-GC-content, core-sized (150 bp) region on which the nucleosome peak is centered. Transcription factors that tend to occupy regions with low GC content consistently show the most dramatic correlation between their neighboring nucleosomes and GC content, and the strongest container site characteristics of the ∼250 bp of the region occupied by the nucleosome core plus the two flanking linkers (Fig. 4A). Transcription factors that occupy high-GC sites show a less-pronounced effect, but small local maxima in GC content precisely coinciding with the summit of the nucleosome peak are still evident (Fig. 4B,C). This observation is clearer for transcription factors for which many peaks were called as the plots become less noisy with the increasing numbers of sites that contribute to a cluster (Supplemental Fig. S5).
Figure 4.

Examples of nucleosome positioning clusters around TFBSs and relationship to GC content. For each TF, the first panel of the top row is a traditional aggregation plot, where the signal is averaged over all sites. The total number of sites is shown in the header. The remaining panels of the top row show the mean nucleosome positioning signal in the five largest clusters discovered by CAGT, with the fraction of peaks in each cluster shown in the header. Each panel in the second row shows the mean GC content of all sites used in the panel above it. If a site was “flipped” during the last step of CAGT (see Fig. 1), then the corresponding GC signal was also flipped accordingly. GC content was computed using a sliding window of 21 bp. The small arrows indicate container sites. (A) SPI1 in GM12878; (B) TCF12 in GM21878; (C) EGR1 in K562.
We hypothesized that this extensive phenomenon has not been described previously because it is not visible in a standard AP. To test this idea, we generated standard APs by aggregating all sites into the same plot (Fig. 4, first column of plots). A comparison between this standard AP and the clustered and oriented shape profiles (Fig. 4) supports our hypothesis that methodological limitations have obscured these signals in previous analyses and adds further support to the idea that CAGT uncovers previously unappreciated heterogeneity in chromatin structure around TFBSs.
Asymmetries of chromatin modifications around transcription factor binding sites
We next set out to quantify asymmetries of histone modifications, again around TFBSs. Due to the way ENCODE produces histone modification data via random shearing of chromatin as opposed to MNase digestion, the shape profiles of these data are not as highly resolved as those of the nucleosome positioning data. Nonetheless, we observed dramatic and unexpected heterogeneity and asymmetry of histone modification signals, using a total of 4277 quantifications of 12 different chromatin marks around the binding sites of 112 DNA-binding proteins in five cell types (GM12878, K562, HeLa-S3, HepG2, and H1-hESC). For example, in K562, 73 distinct binding proteins and 12 types of histone modifications were assayed (Table 1), some of them in more than one replicate from different labs, giving a total of more than 1600 profile sets for this cell type alone. All results are available online in a searchable database (http://anshul.kundaje.net/projects/cagt). Some case studies that demonstrate the heterogeneity of the chromatin landscape around DNA-binding proteins are discussed in the Supplement (Section S.4) and in Supplemental Figure S6.
For each of 11 chromatin modification marks, as well as for H2A.Z, DNase, and nucleosome positioning, we calculated the fraction of binding sites of each factor that were assigned to CAGT clusters exhibiting asymmetry. We then made a histogram of the asymmetry fractions over all factors for each mark (Fig. 5A–F). The DNase hypersensitivity assay serves as a control because DNase cuts only at open chromatin right next to the bound factor and, consequently, many factors exhibit predominantly symmetric DNase signal around their binding sites. In contrast, the distribution of asymmetry fractions for nucleosome positioning is strikingly different, with >90% of factors exhibiting pronounced asymmetry of nucleosome positioning around >90% of their binding sites (Fig. 5A). The only notable exceptions are the members of the CTCF/cohesin complex, which show predominantly, though not exclusively, symmetric positioning of nucleosomes around their binding sites (Supplemental Fig. S3). The chromatin marks and H2A.Z also have mostly asymmetric signal around TFBSs. Marks that associate with gene bodies (Fig. 5B), promoter-associated marks (Fig. 5C), enhancer-enriched marks (Fig. 5D), and repressive marks (Fig. 5E,F) all have highly similar distributions, with a mean of 80%–90% of asymmetric sites.
Figure 5.

Widespread asymmetry of chromatin marks around TFBSs. (A–F) Fraction of TF peaks with asymmetric patterns for each chromatin mark. For each combination of TF and mark, we computed the fraction of high signal binding sites in asymmetric CAGT clusters. Results were averaged over all available data sets for the same TF and mark in all cell lines. Some examples for factors that contribute to the specific data point are shown, with arrows pointing to the asymmetry fraction of the factor. For example, in ∼85% of NRF1 binding sites with high H3K9ac signal, the shape of the modification is asymmetric around the binding site. (A) DNase and nucleosome positioning and their contrasting asymmetry frequency distributions. (B) Gene body marks. (C) Promoter-associated marks. (D) Enhancer-associated marks. (E) Repressive marks that exhibited moderate signal around binding sites. (F) Repressive marks that exhibited generally weak signal around binding sites. (G) For each combination of TF and mark, we computed the number of proximal and distal binding sites in symmetric and asymmetric CAGT clusters and identified which one of the four groups, symmetric proximal, symmetric distal, asymmetric proximal, and asymmetric distal, contained the largest number of binding sites. Results were averaged over all available data sets for the same TF and mark in all cell lines. The height of each bar shows the number of TFs for which the corresponding group was the most prevalent. The “Missing” part corresponds to the TFs that were not assayed for that mark.
These results demonstrate that asymmetry is widespread across binding proteins, chromatin marks, and cell lines. A possible explanation for the observed asymmetric patterns is that they result from interactions between the transcriptional machinery and other binding proteins near the transcription start site. To examine whether asymmetry is limited to binding sites near TSSs, we distinguished proximal and distal binding sites. For each pair of binding protein and chromatin mark, we computed the number of proximal and distal binding sites that had a symmetric or asymmetric shape for the mark (Fig. 5G). If asymmetric patterns were observed exclusively near TSSs, then proteins that bind proximally to TSSs would exhibit asymmetric patterns, while TFs that tend to bind distally would have most of their peaks in the distal and symmetric group. Surprisingly, however, even for distal TFs, the majority of peaks show asymmetric patterns for all histone marks, as well as for nucleosome positioning. DNase was the only assay for which distal sites showed a clear preference for symmetric patterns. Three case studies of TFs with different preferences for proximal binding illustrate this conclusion (Supplemental Fig. S7). In all cases, a large part of the overall asymmetry is contributed by the distal sites.
A common repertoire of chromatin shapes around transcription factor binding sites
Given the tremendous heterogeneity in chromatin signals around binding sites for each factor, two possible models regarding the generality of our observations present themselves. Either each factor has its own characteristic clusters that are distinct from those of other factors, or there is a common and limited chromatin ‘language’ repertoire shared between the binding sites of different factors. To ask which of these mutually exclusive hypotheses holds, we ran CAGT for each mark on the combined list of all binding sites of all available factors at once to generate “meta-clusters.”
We started by analyzing nucleosome positioning in the vicinity of TFBSs using combined data from all factors assayed in GM12878 and K562 (the two cell lines for which we have nucleosome positioning data). CAGT identified 12 nucleosome positioning clusters from the totality of all DNA-binding factor data in these two cell lines (Fig. 6A; first row of Fig. 6B). In accordance with the results of the previous sections, the majority of these clusters is asymmetric and the distance between the TFBS and the nearest well-positioned nucleosome varies from 30 bp to >400 bp. The two clusters with the largest distance between the TFBS and the nearest nucleosome are enriched in TSS-proximal factors (e.g., EGR1, SIN3A, RDBP, POLR2A; P < 0.001).
Figure 6.

(A) Asymmetric nucleosome positioning meta-clusters across all TFs in GM12878 and K562. Clusters are numbered according to their size, and labeled with the approximate distance between the binding site and the center of the nearest well-positioned nucleosome. Each panel shows the mean signal over all binding sites (for all TFs and for both cell lines) that were assigned to that cluster. (B) The two symmetric nucleosome meta-clusters not shown in A. For each of these two clusters, we also show the mean signal of other chromatin marks averaged over the binding sites in that cluster. Sites in cluster 12 exhibit remarkably higher signals of active marks. For both clusters 7 and 12, the signal of the associated chromatin marks appears highly symmetric, but this is an artifact of aggregating the chromatin mark signal according to the clustering and orientation of the nucleosome signal. (C) For each TF that was enriched in either cluster 7 or cluster 12 (P < 0.001), we computed the fraction of binding sites in each of these clusters. Cluster 7 is enriched for the members of the CTCF/cohesin complex, while cluster 12 is enriched for enhancer-associated TFs.
CAGT identified two symmetric clusters, with different spacing between the nucleosomes flanking the TFBS (Fig. 6B). To examine the functional differences between these two clusters, we plotted the signal of other chromatin marks around the subset of sites assigned to each cluster. Interestingly, binding sites with larger spacing between nucleosomes (cluster 12) were characterized by a significantly higher signal of active chromatin marks (Fig. 6B). Cluster 7 was highly enriched for binding sites of the components of the CTCF/cohesin complex (RAD21, SMC3, CTCF), as well as the zinc-finger containing protein, ZNF143 (P < 0.001). These factors had >20% of their binding sites in cluster 7 and almost no sites in cluster 12. Cluster 12 was enriched for a much broader set of factors, with enhancer-associated factors showing the strongest associations (Fig. 6C).
Similar meta-clustering over all DNA-binding proteins in all Tier 1 and Tier 2 cell lines for each of the available histone modifications revealed that the majority of the discovered meta-shapes are asymmetric (Fig. 7). This highlights the fact that asymmetry of histone modifications is a ubiquitous phenomenon across all assayed DNA-binding proteins and cell types (with the single prominent exception of the CTCF/cohesin complex). For each histone modification, the meta-clusters were ranked based on support for that cluster, which we approximate by the number of TFBSs that are members of each meta-cluster. We found that the meta-clusters with similar shapes across the different modifications had similar rank-order. For example, Pattern 1, which is present for all histone marks except H3K79me2, corresponds to the most prevalent meta-shape (rank 1) for H3K27ac, all H3K4 methylations, H3K9ac, H3K9me1, and H4K20me1, and the second most prevalent shape for all other marks. Similarly, Pattern 2 is highly ranked for several histone modifications. Thus, different chromatin modifications, even those with opposing functions, such as repressive methylations and activating acetylations, exhibit similar patterns around TFBSs.
Figure 7.

CAGT meta-clusters for all histone modifications across all binding proteins in all Tier 1 and Tier 2 ENCODE cell lines. Each row contains the clusters discovered by CAGT in the merged data sets for the corresponding modification. The clusters for each mark are numbered according to their size, with cluster 1 for each mark containing the most TFBSs (see the numbers at the top, left corner of each shape plot). Clusters for different modifications are arranged to bring similar shapes in the same column. Five columns containing three or fewer shapes are not shown.
Spatial relationships among marks at factor binding sites
The existence of similar patterns of different chromatin marks around factor binding sites does not necessarily mean that the same sites bear a mixture of chromatin marks or that these marks are deposited on the same side of the binding site. Given the results so far, these are possibilities, but it is equally possible that factor binding sites tend to be surrounded by histone modifications that are anticorrelated, with one modification being prevalent on one side of the binding site, and another prevalent on the opposite side. We refer to these two scenarios as correlated and anticorrelated, respectively.
To explore these two models, we analyzed the colocalization and relative orientation of patterns of different types of chromatin marks using a targeted multivariate analysis approach. First, as before, we used CAGT to cluster and reorient the signals for each chromatin mark around factor binding sites. We call this reference profile the “target-mark.” Then, for all binding sites that belong to each target-mark cluster, we computed a standard AP for each of the other chromatin marks (termed “partner-marks”). We note that for these analyses, the symmetry properties of the aggregate profiles of the partner-marks need to be interpreted like those of a traditional AP: An asymmetric aggregate pattern of a partner-mark can only be caused by predominantly asymmetric patterns around the individual binding sites. However, a symmetric partner-mark pattern could be due to an aggregation over groups of asymmetric patterns with opposite orientation (and therefore be “pseudo-symmetric”) or be due to true underlying symmetry.
First, we examined the correlation between the asymmetry of nucleosome positioning (target-mark) and histone modification patterns (partner-marks) around TFBSs. We found that predominantly TSS-proximal binding TFs, such as SIN3A, show a moderate correlation of asymmetry of nucleosome positioning and histone modifications (Fig. 8A; Supplemental Fig. S8B). However, several other TFs, such as SP1 in GM12878, show colocalization of asymmetric patterns of nucleosome positioning with pseudo-symmetric patterns of histone modifications (e.g., H3K9ac), indicating that nucleosome positioning asymmetry does not entirely determine the patterns of chromatin marks, and that poorly positioned nucleosomes can also be associated with equally enriched levels of histone marks (Fig. 8B; Supplemental Fig. S8A). At CTCF binding sites, we found colocalization of asymmetric patterns of histone modifications and symmetric patterns of nucleosome positioning, indicating differential modifications of the well-positioned nucleosomes (Supplemental Section S.5; Supplemental Fig. S8C).
Figure 8.

(A,B) The top row shows the most prevalent nucleosome positioning clusters around SIN3A and SP1 sites, respectively, in GM12878. The remaining rows show the signal of histone modifications, averaged over all sites in the corresponding clusters. TSS-proximal TFs, such as SIN3A, exhibit correlated nucleosome positioning and histone modification patterns. Such correlations, however, are not evident for TFs that tend to bind more distally from TSSs (e.g., SP1). (C) Clusters of H3K4me1 signal around POLR2A sites in HepG2 and the corresponding H3K4me3 signal. There is a clear anticorrelation between the two histone marks. (D) For all CAGT runs around TFBSs, we considered all TSS-proximal sites that were assigned to asymmetric clusters, and counted how many times the direction of transcription of the TSS closest to a site agreed with (configuration (1)) or opposed (configuration (2)) the direction of the asymmetry pattern (from low to high signal) of the cluster to which the site was assigned. We are showing the log10-ratio of the two counts, aggregated over all CAGT runs for the same mark. Values >0 (corresponding to ratios >1) imply that the mark tends to increase in the direction of transcription, while values <0 imply that the mark tends to increase in the opposite direction.
Core promoter regions enriched for POLR2A binding sites are typically characterized as having elevated levels of H3K4me3 and depleted levels of H3K4me1 (Heintzman et al. 2007; Hon et al. 2009). To further understand promoter dynamics, we analyzed the asymmetry correlations between H3K4me1 (target-mark) and H3K4me3 (partner-mark) at POLR2A sites in six cell lines (Fig. 8C; Supplemental Fig. S9). Over half of the POLR2A peaks in each cell line showed significant H3K4me1 signal levels. The H3K4me1 patterns were strongly anticorrelated with the corresponding patterns of H3K4me3, indicating that both modifications can coexist around POLR2A sites, but on opposite sides of the binding sites. Other TSS-proximal TFBSs also showed consistent enrichment and anticorrelation of H3K4me1 and H3K4me3 (Supplemental Fig. S10A). The six cell lines behave virtually identically, indicating that this relationship is universal (Supplemental Fig. S9). Additional asymmetry correlations that we discovered are described in the Supplement (Section S.6; Supplemental Figs. S11–S14).
Finally, we used a complementary approach to summarize the asymmetry correlation of different chromatin marks around all TSS-proximal TFBSs. For all CAGT runs around TFBSs, we considered all TSS-proximal binding sites that were assigned to asymmetric clusters of each chromatin mark. At each TFBS, the direction of asymmetry (from low to high signal) of a particular mark can be in the same (configuration 1) or in the opposite direction (configuration 2) as the direction of transcription of the nearest TSS. For each chromatin mark, we computed the ratio of TFBSs in configuration 1 with those in configuration 2. Eight of the 12 chromatin marks showed transcription-oriented asymmetry, with H3K79me2 and H3K4me3 having the strongest positive bias (Fig. 8D). H3K4me1, H3K9me3, H3K9me1, and H2A.Z patterns were anticorrelated with the direction of transcription. Hence, H3K4me1 and H3K4me3 were once again found to be anticorrelated with each other, as were H3K27ac and H3K4me1. Interestingly, the different types of repressive marks, H3K27me3 and H3K9me3, were also found to show anticorrelated behavior around TSSs.
Discussion
Previous studies that have combined different chromatin signals to classify the genome into segments occupied by specific combinations of chromatin marks and functional elements have revealed general, global correlations with functional implications (Hon et al. 2008; Ernst and Kellis 2010; MM Hoffman, J Ernst, SP Wilder, A Kundaje, RS Harris, M Libbrecht, B Giardine, JA Bilmes, E Birney, RC Hardison, et al., in prep.). CAGT is methodologically distinct from the approaches used in these studies, which simultaneously summarize a large number of different association patterns over a large number of functional marks into a few clusters to reveal the most prominent global relationships. Instead, CAGT uses a bottom-up approach for analyzing high-resolution patterns of functional marks at targeted genomic locations. It respects various latent features of the data and is able to reveal hidden asymmetries and heterogeneity of specific chromatin marks. It also reveals a variety of robust correlation and anticorrelation relationships between patterns of colocalized marks at different types of binding sites.
Relationships between factor binding and chromatin landscape would ideally be determined by conducting multiple ChIP-seqs on the same single cells and repeating this many times to separate signal from noise, but this is currently technically infeasible. Instead, the ENCODE Consortium performed thousands of assays separately, on pools of large numbers of cells. Initial analyses of the ChIP-seq data produced peak calls and signal tracks for each individual experiment, which could then be used in integrative analyses such as the ones we present here. To round out the ChIP-seq data, we produced high-depth nucleosome positioning data by MNase digestion and sequencing from two of the main ENCODE cell lines.
Because analysis of each individual factor binding site separately would be noisy and neither feasible nor easily interpretable, we turned to aggregation as a means to increase signal, decrease noise, and classify sites according to the data. Standard aggregation assumes that the signal around all sites exhibits homogeneity in magnitude, shape, and orientation. CAGT overcomes this limitation by using clustering to identify subsets of sites with similar behavior. The noise removal and two-step clustering procedures of CAGT led to robust and biologically meaningful clusters as evidenced by, for example, their relationship with gene expression (Fig. 2), GC content (Fig. 4), distinct asymmetry fractions (Fig. 5A–F), proximity to TSSs (Fig. 5G), and functional specificity (Fig. 6). Underscoring the technical robustness of our results, we recovered several known or expected relationships, such as the symmetric patterns of DNase at the majority of TFBSs and the substantial symmetry of nucleosome positioning around the CTCF/cohesin complex (Fig. 5A).
Our analyses revealed unexpected and novel diversity, as well as pervasive asymmetry of chromatin modification signals and nucleosome positioning around factor binding sites and TSSs. The fact that these phenomena are so widespread and universal indicates that distal regulatory sites, especially enhancers that likely constitute the majority of such sites, possess inherent orientation that is specified by the chromatin remodeling machinery. The specific orientation and asymmetry may be of structural importance for the interaction of these sites with other functional elements such as promoters.
We also find that factors bind in a variety of chromatin contexts, suggesting a greater diversity of function for each factor than previously recognized. For example, proximal CTCF sites are associated with enriched asymmetric H3K27ac marks and asymmetric nucleosome positioning and may be involved in promoter function, but nucleosome positioning around distal CTCF sites is symmetric. In general, most factors bind both promoter-distally and promoter-proximally, and their sites harbor a diversity of chromatin modifications. Often, functionally distinct marks are detected in the same sites, reflecting either actual coincidence of the marks or heterogeneity of the cell population.
We find that patterns of chromatin signals are shared among functionally different modifications and see that there is a limited vocabulary of patterns, which collectively define a “signal language” of chromatin around transcription factor binding sites (Fig. 7). The limited number of shapes is not entirely surprising, given that many chromatin features are (1) locally determined by functional elements, which are generally not very large (a few hundred bases at most), and (2) constrained by the length of the DNA wrapped around a nucleosome plus the linker, which is also about 200 bases in total. Given this constrained space, shape diversity cannot be unlimited. It is striking, however, that the most common meta-shapes (which represent the totality of each chromatin mark around all assayed DNA-binding proteins) are shared by virtually all histone modifications, with highly correlated rank-order of their frequency. This may ultimately be due to the limited number of biochemical mechanisms that govern chromatin modification and remodeling.
Going beyond the characterization of single marks at factor binding sites, we then used multivariate association analysis on the CAGT-derived shapes to elucidate contextual effects and functional relationships among chromatin marks. These analyses revealed novel correlations and anticorrelations between histone modifications, open chromatin, and nucleosome positioning (Fig. 8; Supplemental Figs. S8–S14). For example, coincident chromatin marks are often anticorrelated and, in many cases, transcription factor binding coincides with chromatin switch points, where one mark is enriched on one side of the binding site and another on the other side.
In summary, we provide a comprehensive characterization of the patterns of histone modifications, nucleosome positioning (with the original data presented here), and sequence composition around the binding sites of >100 human transcription factors in a large variety of cell types, genome wide. We discovered that heterogeneity and asymmetry of chromatin marks around factor binding sites is the norm, likely reflecting functional asymmetries in promoters and enhancers alike. Transcription factors and other DNA-binding proteins can occupy distinct classes of binding sites, with each class exhibiting characteristic chromatin modification patterns and asymmetry signals. A substantial fraction of TFBSs as well as POLR2A binding sites mark switch points, where chromatin signals are different and even opposed on the two sides of the binding site. Given that each regulatory element in the genome has a distinct function, the complexities that we describe here play out a millionfold in the regulatory genomics of an organism according to rules that we are only now beginning to unravel.
Methods
Nucleosome positioning data sets
All procedures for generating MNase-seq data sets for K562 and GM12878 were performed as described previously (Valouev et al. 2011, and references therein). Briefly, chromatin was isolated, mononucleosomal fragments were generated by MNase digestion and gel-purified, linkers were added, and library PCR was performed. Aliquots of the library were subjected to emulsion PCR according to the standard SOLiD protocol (Life Technologies), and several separate 35-bp, single-end sequencing runs were performed on the SOLiD V4 platform to generate a total of 3,741,618,497 for K562 and 4,078,911,370 reads for GM12878. The SOLiD reads were mapped in color-space with the DNAnexus probabilistic mapper (https://dnanexus.com). The DNAnexus mapper measures and propagates mapping uncertainty by including both quality values and mismatches in the alignment score calculation. The scores are then scaled across all possible mappings of the read to estimate the posterior probability for alignment to each genomic location. Reads corresponding to posterior probability of correct mapping >0.9 were reported. A total of 1,845,550,856 confidently mapped reads were obtained for K562, and 1,929,303,627 for GM12878. Raw and processed data can be downloaded from the UCSC ENCODE portal http://genome.ucsc.edu/ENCODE.
Transcription factor binding locations
The ENCODE Consortium has generated over 400 high-quality ChIP-seq data sets spanning 119 transcription factors in ∼70 human cell-lines (The ENCODE Project Consortium 2012; Gerstein et al. 2012). For each TF ChIP-seq data set, high-confidence regions of binding (peaks) were identified using a uniform processing pipeline as described in Gerstein et al. (2012). We used the ChIP-seq peak summits as anchor points around which to analyze the signal patterns of various functional marks using CAGT.
Normalized signal tracks of functional marks
Alongside the TF ChIP-seq data, the ENCODE Consortium has also generated genome-wide profiles of open-chromatin (DNase-seq), nucleosome occupancy (MNase-seq), and several key histone modifications (H3K4me3, H3K4me1, H3K4me2, H3K27ac, H3K9ac, H3K9me1, H3K9me3, H3K27me3, H3K36me3, H3K79me2, H4K20me1) and histone variants (H2A.Z) based on ChIP-seq assays in several of these same cell-lines (The ENCODE Project Consortium 2012). These data sets were also uniformly processed to produce genome-wide normalized signal coverage tracks at base-pair resolution as described in MM Hoffman, J Ernst, SP Wilder, A Kundaje, RS Harris, M Libbrecht, B Giardine, JA Bilmes, E Birney, RC Hardison, et al., in prep. Briefly, uniquely mapped sequencing reads were shifted and extended to the appropriate estimated fragment lengths in a strand-specific manner, depending on the characteristics of the data set and data type. Fragment coverage at each genomic location was computed and appropriately smoothed using kernel smoothing. Signal across replicates of a data set were combined. The signal at each base pair was normalized to account for the total number of mapped reads in all replicates, local mappability within the smoothing window, and the mappable size of the human genome. Signal values at low mappability and unreliable artifact locations in the genome were filtered and represented as missing data. The normalized signal value at each genomic location represents a signal fold change with respect to the expected coverage based on a uniform distribution of an equivalent number of mappable reads across all mappable locations on both strands on the genome. Background signal values (noise) typically had values in the range of from 0 to threefold. In CAGT analysis, signal values were extracted in windows around specific sets of anchor points in the genome. We typically sampled signal values every 10 bp in order to reduce the computational burden without any noticeable loss in resolution.
Combining replicates
Many of the ENCODE data sets were generated in replicates, often coming from different labs, and sometimes using different experimental protocols or antibodies for the same target protein. All replicates from the same lab that were using the same antibody were pooled for both peak calling and signal extraction. However, data sets from different labs or using different antibodies were not merged. Therefore, even after merging of replicates from the same lab, there were often multiple data sets for the same target protein and the same type of mark, all of which were used in separate CAGT runs. However, when computing statistics over all TFs (e.g., Figs. 3, 5), we wanted to avoid overrepresentation of TFs with more data sets than others. For this reason, we averaged over all data sets for the same TF, weighting each of them by the number of binding sites in it. A list of all of the data sets used in the Figures is given in Supplemental Table 1.
GC content
To obtain the GC content we computed the fraction of G and C nucleotides in sliding windows of size 21 bp (10 bp upstream to 10 bp downstream) centered at each location of the genome, using the reference human sequence (GRCh37). To make GC plots for specific CAGT clusters, we extracted the GC content around the sites (TFBSs, TSSs) contained in the cluster. If the signal of a site was “flipped” at the last step of CAGT (see Fig. 1), then the corresponding GC content signal was also “flipped” accordingly.
Transcription start sites
We considered a TFBS proximal if it lies within 1 kb upstream of or downstream from a GENCODE.v7 TSS (Harrow et al. 2012) and distal otherwise. For the analysis of nucleosome positioning around TSSs, we used a subset of 19,175 GENCODE TSSs that also have supporting tags in at least one of the ENCODE CAGE libraries. To reduce the confounding effect of bidirectional promoters on the study of nucleosome positioning patterns and their relation to expression, we excluded from our analysis all pairs of TSSs that were on opposite strands and at most 1 kb upstream of each other. This filtering resulted in a list of 15,736 TSSs. We took the expression of each TSS to be the TPM (Tags Per Million) count of the corresponding CAGE cluster in the cell lines studied. The GENCODE TSSs and CAGE expression values were provided by the ENCODE Consortium (Djebali et al. 2012; The ENCODE Project Consortium 2012). To compare the expression values in different TSS clusters, we used the Wilcoxon test with a Bonferroni correction. To compute the enrichment of TSS clusters in CpG promoters, we counted the number of TSSs in each cluster that overlapped any CpG island by at least 1 bp, and used the Fisher exact test with Bonferroni correction. CpG islands were downloaded from the UCSC Genome Browser. The enrichment in TF binding was computed in a similar fashion, with the only difference being that TSSs were extended by 100 bp upstream and downstream before computing overlaps.
Clustered aggregation plots (CAGT)
The input to CAGT is a genome-wide, continuous track of a functional signal (e.g., nucleosome occupancy, histone modification, GC content), together with a set of M genomic locations of interest or “anchor points” (e.g., binding sites of a transcription factor, TSSs) (Fig. 1). The signal in an L-bp window centered at each location is extracted, resulting in a collection of fixed-length profiles of signal values X = { [x1, …, xL] }. Averaging the signal values at each of the L positions across all signal profiles would result in a traditional aggregation plot (Jee et al. 2011).
Our goal, however, is to partition the set of M anchor points into K compact clusters such that each cluster represents anchor points that show similar patterns (shapes) of the functional signal profiles and different clusters have distinct patterns (shapes). The type of patterns and the number of clusters K is not known a priori. In CAGT, we define the distance between any two signal profiles as one minus the Pearson correlation coefficient between them. Therefore, two signal vectors that are highly correlated (i.e., have a similar shape) will have a small distance and will be considered “similar” to each other, even if there is a difference in their absolute signal intensities.
At the same time, we want to learn clusters of anchor points that are enriched for the functional signal and avoid learning patterns that are simply an artifact of noise (overall low signal). Hence, before proceeding with the clustering, we filter out anchor points whose signal profiles have variance below a threshold V or q-th percentile below Q. We found that such locations usually correspond to genomic regions around which the functional signal was significantly depleted or where the data quality was questionable (e.g., mappability artifacts). We empirically set V = 0.0001 and q = 99. The low signal threshold Q was empirically set to 0.05 for nucleosome positioning data (typical signal range of up to sixfold), twofold for DNase-seq data and fourfold for all histone marks.
CAGT involves two phases of clustering. First, k-medians, a variation of the k-means algorithm, is used to obtain a relatively large set of tight but potentially redundant clusters i.e., each cluster is individually compact (i.e., has low intra-cluster variance), but we can and often do obtain multiple clusters that show similar patterns. In the second phase, CAGT uses hierarchical agglomerative clustering to merge redundant clusters. Optionally, this step can also consider flipped (reversed) versions of each shape profile, in order to merge clusters that are mirror images of each other. This is useful in situations where the anchor points do not have explicit genomic directionality (strandedness), but the functional signal could have hidden directionality. For example, this is the case with TF ChIP-seq peak summits (as opposed to TSSs which have an implicit directionality). A more detailed description of the CAGT procedure is given in the Supplement (Section S.1). We evaluated our two-step clustering approach on the H3K27ac signal around CTCF sites in K562 (Supplemental Section S.2; Supplemental Fig. S15). Our results suggest that CAGT produces robust and reproducible clusters.
Metaclustering
To obtain a unified index of shapes for each functional mark over all ENCODE TF data sets and cell lines, one would ideally merge all data sets for this mark and run CAGT on the resulting set of signals. However, this would involve clustering several million profiles. Hence, a time and memory-efficient solution was to run CAGT on the intermediate k-median centroids obtained from the first phase of CAGT on the individual TF data sets. These centroids sufficiently capture the variability present in each data set and are therefore a highly representative summary of the original signal profiles. All members of each of the k-median-based clusters were then assigned to the “meta-cluster” to which the corresponding centroid was assigned. To compute enrichments of meta-clusters in TFs (e.g., Fig. 6C), we counted the number of sites of each TF falling in each meta-cluster and used a Fisher exact test with Bonferroni correction.
Defining symmetric and asymmetric shapes
To split clusters into symmetric and asymmetric, we compared the left half of each cluster's centroid with the mirrored (reversed) version of the right half. A cluster was defined as symmetric if the two halves had correlation larger than 0.75 (similar in shape) and root mean squared deviation <1.1 (similar in magnitude). We found that these cutoffs gave results that greatly matched our intuition about which shapes should be called symmetric.
Multivariate analysis of pattern coassociation of multiple functional marks
In all figures that show the association of patterns of two or more types of signals (e.g., Figs. 4, 8; Supplemental Figs. S5, S8–S14), the first row represents the “target-mark” on which CAGT analysis was performed, i.e., the clusters represent distinct patterns of the target-mark learned by CAGT. To create the panels of the remaining associated “partner-marks” in the remaining rows, we take the sites that belong to each cluster of the target-mark and plot the mean signal of each partner-mark. The individual signal profiles of the partner-marks are reoriented based on the clustering results on the target-mark. We note that this is different from applying CAGT individually on each of the partner-marks. The panels for the partner-marks in these multivariate plots can be composed of heterogeneous groups of patterns. Hence, these should be interpreted conservatively in the same way as a traditional AP.
Data access
The raw and aligned sequenced reads as well as the signal tracks for the nucleosome data can be downloaded from the NCBI Gene Expression Omnibus (GEO) (http://www.ncbi.nlm.nih.gov/geo/) using accession number GSE35586. These can also be accessed at the UCSC ENCODE data portal http://genome.ucsc.edu/ENCODE using accession numbers wgEncodeEH000921 and wgEncodeEH000922. Raw and aligned reads for all the transcription factor and chromatin data sets are also available at the UCSC ENCODE data portal http://genome.ucsc.edu/ENCODE. The CAGT code package is available for download at http://code.google.com/p/cagt. The CAGT portal for ENCODE data (with links to all processed data, clustering results, visualizations, and supplemental data) will be available at http://anshul.kundaje.net/projects/cagt. Input/output data and results are also available as Supplemental Material.
Acknowledgments
A.K., A.S., and S.B. were partially supported by an ENCODE analysis subcontract. S.B., S.K.P., and M.L. were supported in part by the National Science Foundation under Grant No. 0640211. S.K.P. was partially supported by a fellowship from the American Association of University Women. D.R. and M.S. were supported by an ENCODE production grant.
Footnotes
[Supplemental material is available for this article.]
Article and supplemental material are at http://www.genome.org/cgi/doi/10.1101/gr.136366.111.
Freely available online through the Genome Research Open Access option.
References
- Barski A, Cuddapah S, Cui K, Roh TY, Schones DE, Wang Z, Wei G, Chepelev I, Zhao K 2007. High-resolution profiling of histone methylations in the human genome. Cell 129: 823–837 [DOI] [PubMed] [Google Scholar]
- Djebali S, Davis CA, Merkel A, Dobin A, Lassmann T, Mortazavi AM, Tanzer A, Lagarde J, Lin W, Schlesinger F, et al. 2012. Landscape of transcription in human cells. Nature (in press). [DOI] [PMC free article] [PubMed] [Google Scholar]
- The ENCODE Project Consortium 2012. An integrated encyclopedia of DNA elements in the human genome. Nature (in press). [DOI] [PMC free article] [PubMed] [Google Scholar]
- Ernst J, Kellis M 2010. Discovery and characterization of chromatin states for systematic annotation of the human genome. Nat Biotechnol 28: 817–825 [DOI] [PMC free article] [PubMed] [Google Scholar]
- Fu Y, Sinha M, Peterson CL, Weng Z 2008. The insulator binding protein CTCF positions 20 nucleosomes around its binding sites across the human genome. PLoS Genet 4: e1000138 doi: 10.1371/journal.pgen.1000138 [DOI] [PMC free article] [PubMed] [Google Scholar]
- Gerstein MB, Kundaje A, Hariharan M, Landt SG, Yan K-K, Cheng C, Mu XJ, Khurana E, Rozowsky J, Alexander R, et al. 2012. Architecture of the human regulatory network derived from ENCODE data. Nature (in press). [DOI] [PMC free article] [PubMed] [Google Scholar]
- Harrow J, Frankish A, Gonzalez JM, Tapanari E, Diekhans M, Kokocinski F, Aken BL, Barrell D, Zadissa A, Searle S, et al. 2012. GENCODE: The reference human genome annotation for The ENCODE Project. Genome Res (this issue). doi: 10.1101/gr.135350.111 [DOI] [PMC free article] [PubMed] [Google Scholar]
- Heintzman ND, Stuart RK, Hon G, Fu Y, Barrera LO, Van Calcar S, Qu C, Ching KA, Wang W, Weng Z, et al. 2007. Distinct and predictive chromatin signatures of transcriptional promoters and enhancers in the human genome. Nat Genet 39: 311–318 [DOI] [PubMed] [Google Scholar]
- Hon G, Ren B, Wang W 2008. ChromaSig: A probabilistic approach to finding common chromatin signatures in the human genome. PLoS Comput Biol 4: e1000201 doi: 10.1371/journal.pcbi.1000201 [DOI] [PMC free article] [PubMed] [Google Scholar]
- Hon G, Hawkins RD, Ren B 2009. Predictive chromatin signatures in the mammalian genome. Hum Mol Genet 18: R195–R201 [DOI] [PMC free article] [PubMed] [Google Scholar]
- Hu G, Schones DE, Cui K, Ybarra R, Northrup D, Tang Q, Gattinoni L, Restifo NP, Huang S, Zhao K 2011. Regulation of nucleosome landscape and transcription factor targeting at tissue-specific enhancers by BRG1. Genome Res 21: 1650–1658 [DOI] [PMC free article] [PubMed] [Google Scholar]
- Jee J, Rozowsky J, Yip KY, Lochovsky L, Bjornson R, Zhong G, Zhang Z, Fu Y, Wang J, Weng Z, et al. 2011. ACT: Aggregation and correlation toolbox for analyses of genome tracks. Bioinformatics 27: 1152–1154 [DOI] [PMC free article] [PubMed] [Google Scholar]
- Jiang C, Pugh BF 2009. Nucleosome positioning and gene regulation: Advances through genomics. Nat Rev Genet 10: 161–172 [DOI] [PMC free article] [PubMed] [Google Scholar]
- Johnson SM, Tan FJ, McCullough HL, Riordan DP, Fire AZ 2006. Flexibility and constraint in the nucleosome core landscape of Caenorhabditis elegans chromatin. Genome Res 16: 1505–1516 [DOI] [PMC free article] [PubMed] [Google Scholar]
- Kaplan N, Moore IK, Fondufe-Mittendorf Y, Gossett AJ, Tillo D, Field Y, LeProust EM, Hughes TR, Lieb JD, Widom J, et al. 2009. The DNA-encoded nucleosome organization of a eukaryotic genome. Nature 458: 362–366 [DOI] [PMC free article] [PubMed] [Google Scholar]
- Lee W, Tillo D, Bray N, Morse RH, Davis RW, Hughes TR, Nislow C 2007. A high-resolution atlas of nucleosome occupancy in yeast. Nat Genet 39: 1235–1244 [DOI] [PubMed] [Google Scholar]
- Mavrich TN, Jiang C, Ioshikhes IP, Li X, Venters BJ, Zanton SJ, Tomsho LP, Qi J, Glaser RL, Schuster SC, et al. 2008. Nucleosome organization in the Drosophila genome. Nature 453: 358–362 [DOI] [PMC free article] [PubMed] [Google Scholar]
- Peckham HE, Thurman RE, Fu Y, Stamatoyannopoulos JA, Noble WS, Struhl K, Weng Z 2007. Nucleosome positioning signals in genomic DNA. Genome Res 17: 1170–1177 [DOI] [PMC free article] [PubMed] [Google Scholar]
- Radman-Livaja M, Rando OJ 2010. Nucleosome positioning: How is it established, and why does it matter? Dev Biol 339: 258–266 [DOI] [PMC free article] [PubMed] [Google Scholar]
- Rando OJ, Chang HY 2009. Genome-wide views of chromatin structure. Annu Rev Biochem 78: 245–271 [DOI] [PMC free article] [PubMed] [Google Scholar]
- Schones DE, Cui K, Cuddapah S, Roh TY, Barski A, Wang Z, Wei G, Zhao K 2008. Dynamic regulation of nucleosome positioning in the human genome. Cell 132: 887–898 [DOI] [PMC free article] [PubMed] [Google Scholar]
- Segal E, Widom J 2009. From DNA sequence to transcriptional behavior: A quantitative approach. Nat Rev Genet 10: 443–456 [DOI] [PMC free article] [PubMed] [Google Scholar]
- Segal E, Fondufe-Mittendorf Y, Chen L, Thastrom A, Field Y, Moore IK, Wang JP, Widom J 2006. A genomic code for nucleosome positioning. Nature 442: 772–778 [DOI] [PMC free article] [PubMed] [Google Scholar]
- Shivaswamy S, Bhinge A, Zhao Y, Jones S, Hirst M, Iyer VR 2008. Dynamic remodeling of individual nucleosomes across a eukaryotic genome in response to transcriptional perturbation. PLoS Biol 6: e65 doi: 10.1371/journal.pbio.0060065 [DOI] [PMC free article] [PubMed] [Google Scholar]
- Tillo D, Kaplan N, Moore IK, Fondufe-Mittendorf Y, Gossett AJ, Field Y, Lieb JD, Widom J, Segal E, Hughes TR 2010. High nucleosome occupancy is encoded at human regulatory sequences. PLoS ONE 5: e9129 doi: 10.1371/journal.pone.0009129 [DOI] [PMC free article] [PubMed] [Google Scholar]
- Tsankov A, Yanagisawa Y, Rhind N, Regev A, Rando OJ 2011. Evolutionary divergence of intrinsic and trans-regulated nucleosome positioning sequences reveals plastic rules for chromatin organization. Genome Res 21: 1851–1862 [DOI] [PMC free article] [PubMed] [Google Scholar]
- Valouev A, Johnson SM, Boyd SD, Smith CL, Fire AZ, Sidow A 2011. Determinants of nucleosome organization in primary human cells. Nature 474: 516–520 [DOI] [PMC free article] [PubMed] [Google Scholar]
- Wang J, Zhuang J, Iyer S, Lin XY, Whitfield TW, Greven MC, Pierce BG, Dong X, Kundaje A, Cheng Y, et al. 2012. Sequence features and chromatin structure around the genomic regions bound by 119 human transcription factors. Genome Res (this issue). doi: 10.1101/gr.139105.112. [DOI] [PMC free article] [PubMed] [Google Scholar]
- Yuan GC, Liu YJ, Dion MF, Slack MD, Wu LF, Altschuler SJ, Rando OJ 2005. Genome-scale identification of nucleosome positions in S. cerevisiae. Science 309: 626–630 [DOI] [PubMed] [Google Scholar]
- Zaugg JB, Luscombe NM 2011. A genomic model of condition-specific nucleosome behavior explains transcriptional activity in yeast. Genome Res 22: 84–94 [DOI] [PMC free article] [PubMed] [Google Scholar]
- Zhou VW, Goren A, Bernstein BE 2011. Charting histone modifications and the functional organization of mammalian genomes. Nat Rev Genet 12: 7–18 [DOI] [PubMed] [Google Scholar]