

Background: Metabolic pathway operation and NAPDH homeostasis in non-growing bacteria is unknown.
Results: Jointly with known metabolic reactions newly discovered metabolic cycles balance the catabolic NADPH production.
Conclusion: We propose the first quantitative NADPH balancing model under non-growing conditions.
Significance: NADPH balancing is significantly different between resting and growing bacteria, reflecting microbial survival strategies during environmental challenges.
Keywords: Mass Spectrometry (MS), Metabolic Tracers, Metabolism, Metabolomics, Redox Regulation
Abstract
In their natural habitat, microorganisms are typically confronted with nutritional limitations that restrict growth and force them to persevere in a stationary phase. Despite the importance of this phase, little is known about the metabolic state(s) that sustains it. Here, we investigate metabolically active but non-growing Bacillus subtilis during nitrogen starvation. In the absence of biomass formation as the major NADPH sink, the intracellular flux distribution in these resting B. subtilis reveals a large apparent catabolic NADPH overproduction of 5.0 ± 0.6 mmol·g−1·h−1 that was partly caused by high pentose phosphate pathway fluxes. Combining transcriptome analysis, stationary 13C-flux analysis in metabolic deletion mutants, 2H-labeling experiments, and kinetic flux profiling, we demonstrate that about half of the catabolic excess NADPH is oxidized by two transhydrogenation cycles, i.e. isoenzyme pairs of dehydrogenases with different cofactor specificities that operate in reverse directions. These transhydrogenation cycles were constituted by the combined activities of the glyceraldehyde 3-phosphate dehydrogenases GapA/GapB and the malic enzymes MalS/YtsJ. At least an additional 6% of the overproduced NADPH is reoxidized by continuous cycling between ana- and catabolism of glutamate. Furthermore, in vitro enzyme data show that a not yet identified transhydrogenase could potentially reoxidize ∼20% of the overproduced NADPH. Overall, we demonstrate the interplay between several metabolic mechanisms that concertedly enable network-wide NADPH homeostasis under conditions of high catabolic NADPH production in the absence of cell growth in B. subtilis.
Introduction
Bacteria are continuously confronted with changing environmental conditions and have therefore evolved a rich repertoire of metabolic pathways to utilize the energy and elemental sources necessary to ensure survival and promote growth (1). A frequent environmental condition is depletion of essential nutrients that causes populations to enter a so-called stationary phase (2). Several stationary phase phenomena such as persistence (3), increased stress resistance (4, 5), and, in the case of Bacillus subtilis, differentiation into spores (6) are the focus of intense research. Metabolism of stationary phase cells, in contrast, is not well characterized, although we generally know that cells do not shut down their metabolism but typically continue to consume energy sources when absence of other essential nutrients precludes growth (7). This metabolically active but non-growing state is referred to as resting cells (8) and is expected to play an important role in ecological processes (9).
This resting state with carbon excess can be induced by depleting any essential chemical element, but occurs most frequently in response to limited supply of the macroelements nitrogen and phosphate and the trace element iron. For the common soil bacterium B. subtilis, nitrogen frequently limits growth because its availability depends, among others, on climate, soil properties, constraints to biological nitrogen fixation, decomposition of litter and competition with other species (10–13). Experimentally, carbon excess conditions are typically studied in continuous cultures under nitrogen or phosphate limitation (14, 15), often using 13C-flux analysis to characterize intracellular metabolism (16–18). In contrast to these still growing cultures, however, essentially nothing is known about the magnitude and distribution of metabolic fluxes in resting cells. How are the consumed carbon and energy sources catabolized and which processes recycle the generated energy and redox equivalents in the absence of biomass formation?
In principle, methods of 13C-flux analysis allow to quantify energy, redox cofactor, and biosynthetic building blocks fluxes (19, 20). The vast majority of the current 13C-flux methods, however, are applicable only to growing cells because the 13C-labeling patterns are detected in protein-bound amino acids (21–23). As there is little or no de novo protein biosynthesis in resting cells, we used a recently developed mass spectrometry (MS) method that detects the 13C-labeling patterns directly in metabolic intermediates (24). An advantage over previous techniques (25–29) is that we detect the 13C-labeling pattern not only in intact but also in fragmented carbon backbones of the intermediates that reveal indispensable intramolecular 13C-label positions for stationary 13C-flux analysis (19, 22, 30). We apply this new LC-MS/MS method to quantify intracellular fluxes in nitrogen starvation-induced resting B. subtilis cultures. In particular, we focus on the question of how B. subtilis recycles its catabolic NADPH formation in the absence of anabolic NADPH requirements? To identify potential NADPH consuming processes during nitrogen starvation, we started from genome-wide transcriptome data and tested various emerging hypotheses with stationary 13C-flux analysis of metabolic deletion mutants, specific 2H-labeling experiments, and in vitro enzyme assays. Therefore, we quantified the contribution of different NADPH consuming mechanisms that enable B. subtilis to counteract an apparent NADPH overproduction and ensure redox homeostasis.
EXPERIMENTAL PROCEDURES
Bacterial Strains, Growth Conditions, and Media
The strains used in this study are listed in Table 1. For all experiments, frozen glycerol stocks were used to inoculate 5 ml of Luria-Bertani (LB) medium, supplemented when required with 0.5 mg liter−1 erythromycin, 5 mg liter−1 kanamycin, 100 mg liter−1 spectinomycin, or 0.25 mg liter−1 phleomycin. After 5 h of incubation at 37 °C and 300 rpm on a gyratory shaker, 5 ml of M9 minimal medium was inoculated at 1000- to 4000-fold dilutions as precultures. M9 medium precultures at optical densities at 600 nm (A600) of 1–2 were then used to inoculate a 70-ml M9 batch culture in a 1-liter baffled shake flask to a maximal A600 of 0.03. The M9 minimal medium consisted per liter of deionized water: 8.5 g of Na2HPO4·2 H2O, 3.0 g of KH2PO4, 1 g of NH4Cl, 0.5 g of NaCl and was adjusted to pH 7 before filter sterilization. The following components were filter sterilized separately and then added (per liter of final medium): 1 ml of 1 m MgSO4, 1 ml of 0.1 m CaCl2, 1 ml 0.05 m FeCl3 containing 0.1 m citric acid, 20 ml of glucose 25% (w/v), 1 ml of tryptophan 5% (w/v), and 10 ml of a trace element solution containing (per liter) 170 mg of ZnCl2, 100 mg MnCl2·4H2O, 60 mg of CoCl2·6H2O, 60 mg Na2MoO4·2H2O, and 43 mg CuCl2·2H2O.
TABLE 1.
B. subtilis strains
| Strain | Genotype | Source or Ref. |
|---|---|---|
| 168CAa | Wild-type, trpC2 | Laboratory stock |
| BSB168b | Wild-type | trp+ derivative of Marburg 168 (64) |
| BBA9006 | PgapB-gfp/spec | 65 |
| GM1500 | trpC2 gapB′::pMUTIN2(ery) | 32 |
| GM1608 | trpC2 ytsJ′::pEC23-kan | 41 |
| GM2975 | Δyqfl::phleo | chr. DNA PS1632 (49) → BSB168 |
| GM2976 | Δyqfl::phleo, PgapB-gfp/spec | chr. DNA PS1632 (49) → BBA9006 |
| GTD107 | trpC2 gapB′::pMUTIN(ery) ytsJ′::pEC23-kan | chr. DNA GM1500 → GM1608 |
| PS1679 | trpC2 Δ (ccpN-yqfL)::phleo | 49 |
a Used strain for transcript analysis, enzyme assays, and 13C- and 2H-labeled experiments.
b Used strain for monitoring kinetics of PgapB promoter activity.
For nitrogen starvation, a M9 batch culture was grown in a shake flask to an A600 between 1.5 and 2, and 50 ml of culture broth were centrifuged for 1 min at room temperature and 15 min at 500 × g. The supernatant was discarded, and residual liquid removed by tapping on paper tissue, followed by immediate resuspension of the cell pellet in 25 ml of nitrogen starvation medium, transfer to a 500-ml flask and incubation at 37 °C and 300 rpm on a gyratory shaker. The nitrogen starvation medium contained per liter of deionized water: 8.5 g of Na2HPO4·2 H2O, 3.0 g of KH2PO4, 0.5 g of NaCl and adjusted pH 7. The following components were added separately (per liter of final medium) 10 ml of 1 m MgSO4, 10 ml of 0.1 m CaCl2, and 20 ml of glucose 25% (w/v), followed by filter sterilization. M9 minimal medium and nitrogen starvation medium had the same ionic strength and were used with 5 g/liter final glucose concentration, if not stated differently.
For the 13C-labeled enrichment experiment in resting cells, 100% [U-13C]glucose (>99% isotopic purity; Cambridge Isotope Laboratories, Andover, MA) was added to a nitrogen starving B. subtilis culture growing initially on 4 g/liter naturally labeled glucose for 1.5 h. At the time of 13C-tracer addition, a final mixture of 50% (w/w) [U-13C] and 50% naturally labeled glucose at a final concentration of 6.8 g/liter was obtained to ensure a good response of all isotopologues in LC-MS/MS analysis. The enrichment experiment was conducted in a bioreactor at 37 °C and 0.1 bar of overpressure with a volume of 0.7 liters in a 1.5-liter vessel (Bioengineering AG, Wald, Switzerland), equipped with pH, temperature, dissolved oxygen probes, exhaust gas analyzer (GA4, DASGIP AG, Jülich, Germany), and a mass flow controller (red-y smart controller GSC, Vögtlin Instruments AG, Aesch, Switzerland). A constant airflow with 1 volume per volume and minute and an agitation speed of 1000 rpm was set to ensure dissolved oxygen levels above 50% throughout the process.
For 13C-flux analysis, a mixture of 80% (w/w) [1-13C] and 20% (w/w) [U-13C]glucose was used (both >99% isotopic purity; Cambridge Isotope Laboratories, Andover, MA). This mixture was chosen to provide meaningful data to resolve the flux branching between glycolysis and pentose phosphate pathway from the positional label in [1-13C]glucose and to resolve the tricarboxylic acid (TCA) cycle flux from the uniformly labeled [U-13C]glucose (22). For deuterium labeling experiments, 100% [4-2H]glucose was used (>99% isotopic purity; Omicron Biochemicals, South Bend, IN).
Physiological Parameters and Enzymatic Assays
Cell growth was determined spectrophotometrically at 600 nm. Glucose, acetoin, citrate, α-ketoglutarate, succinate, fumarate, malate, pyruvate, and acetate concentrations in the supernatant were measured by the signals of a refractive index and diode array detector on a HPLC (Agilent 1100), using a Aminex HPX-87H column at a temperature of 60 °C with 5 mm H2SO4 as eluent. Supernatant samples were prepared by centrifugation of 1 ml of culture broth for 3 min at 4 °C and 14,000 × g. Specific growth rates were calculated by linear regression of A600 over time. Specific uptake and secretion rates were calculated by linear regression of consumed substrate or product concentration versus biomass concentration. Cell viability was estimated by plating dilutions of culture aliquots on LB solid medium and colony counting after 18 h of incubation at 37 °C. The sporulation frequency was estimated by determining the proportion of heat-resistant colony forming units with the same method, except that the culture sample was incubated 15 min at 80 °C before plating the different dilutions. Both viability and sporulation frequency were determined just before, 3 h after, and 18 h after induction of nitrogen starvation.
For enzymatic assays of glyceraldehyde-3-phosphate dehydrogenase and transhydrogenase activity, cells were harvested during mid-exponential growth of batch cultures or after ∼5.5 h of nitrogen starvation by centrifugation at 4 °C and washed twice with 0.9% NaCl. Biomass pellets were kept at −80 °C until further analysis. For disruption, cells were 10-fold concentrated in lysis buffer (100 mm Tris-HCl, pH 7.5, 5 mm MgCl2, 1 mm dithiothreitol, and 4 mm PMSF) and twice passed through a French press cell at 4 °C. Cell-free lysates were obtained by centrifugation at 23,000 × g and 10 min at 4 °C. For the enzymatic assays, 0.1 ml of the cell-free lysate was used with reaction buffer in a total volume of 1 ml at 25 °C (31). Reaction buffers were prepared as described elsewhere (32). For glyceraldehyde-3-phosphate dehydrogenase activity, the reduction of NAD(P)+ was monitored at 340 nm, whereas for transhydrogenase activity, reduction of 3-acetylpyridine adenine dinucleotide+ and oxidation of NADPH were spectrophotometrically measured at 400 and 310 nm simultaneously to exclude interferences in the adsorption of both NADPH and 3-acetylpyridine adenine dinucleotide (31). Protein concentration was determined using Coomassie Plus Protein Reagent (Pierce) according to the manufacturer's instructions.
Transcript Sampling and Data Analysis
For transcript analysis, cultures were grown in duplicate to the desired A600 with <10% deviation in A600 as described above. Samples for mRNA extraction were prepared by adding 30 ml of culture broth to 15 ml of crushed ice filled with killing buffer containing 20 mm Tris-HCl at pH 7.5, 5 mm MgCl2, and 20 mm NaN3. For rapid harvest, this mixture was centrifuged for 3 min at 8300 × g and 4 °C, the supernatant immediately discarded and cells frozen in liquid N2 and stored at −80 °C.
RNA extraction was performed precisely as described elsewhere (33). For labeling and hybridization, we used the strand specific conditions by NimbleGen as described by Rasmussen et al. (34), and raw data treatment was done as described by Nicolas et al. (35). We used MultiExperiment Viewer software MeV (version 4.6.1) for principal component analysis. Differential analysis was carried out separately for each comparison between the two culture conditions, by considering only genes with 2-fold or more differential expression at a threshold of 5-fold above background expression (i.e. a value of 1000) under at least one condition.
Mass Spectrometric 13C-labeling Pattern Analysis
For quantification of 13C-labeling pattern in metabolic intermediates, rapid quenching of metabolic activity was necessary to avoid artifacts caused by the high exchange rates and small pool sizes of metabolites (19, 36). For this purpose, 10 ml of culture broth of mid-exponential batch cultures or nitrogen starving resting cultures after a 5.5-h incubation were mixed with 40 ml of an aqueous −40 °C cold 60% (v/v) methanol solution containing 10 mm ammonium acetate, pH 7.5 (37), directly followed by centrifugation at −20 °C and 15,500 × g for 1 min. The supernatant was immediately removed, and cell pellets were frozen in liquid nitrogen. To assure sufficient biomass between 10 and 20 mg cell dry weight for extraction, two 10-ml culture aliquots were independently quenched and pooled.
To extract metabolites, quenched cell pellets were extracted three times with 0.5 ml of a 78 °C hot 60% (v/v) aqueous ethanol solution containing 10 mm ammonium acetate for 1 min and centrifuged at −10 °C for 3 min at 14,000 × g. The pooled extracts were dried in a SpeedVac at 0.12 millibars and 30 °C and stored at −80 °C until further analysis. For subsequent LC-MS/MS analysis of isotopologue distributions, dried pellets were resuspended in 60 μl of deionized water, 8 μl of which were injected into using conditions published elsewhere (24).
For 13C-labeling pattern analysis in free intracellular amino acids by gas chromatography (GC) MS, the obtained metabolite extract was further processed following a previously established protocol (24). Briefly, after drying the ethanolic extract in a vacuum centrifuge, 20 μl of dimethylformamide (Fluka, Switzerland) was added. After resuspension, 15 μl of supernatant was used with 15 μl of N-(tert-butyldimethylsilyl)-N-methyl-trifluoroacetamide (Sigma) for derivatization at 85 °C for 1 h. For analysis of 13C-patterns in derivatized amino acids, published GC-MS settings were used (22).
13C-constrained Metabolic Flux Analysis
To estimate intracellular carbon fluxes, we used network-wide stationary isotopologue balancing (22, 38). This procedure relies on the steady state 13C-pattern in metabolic intermediates that we obtained by LC-MS/MS (24) and measured extracellular rates of substrate consumption and product formation. These measured data are quantitatively connected to intracellular fluxes through a stoichiometric model of atom transitions between metabolic intermediates in central metabolism (i.e. an isotopologue model). The network-wide distribution of intracellular fluxes was then estimated indirectly with a computational procedure that iteratively improves the fit between simulated mass isotope patterns and extracellular rates and the actually measured data. For the model, we used the recently published reaction reversibilities for B. subtilis (39). The publicly available software 13CFLUX (38) was used for flux computation and error estimation, following the principles of model construction, fitting, quality evaluation of the obtained fit, and error estimation described elsewhere in a detailed step-by-step tutorial (22). The 13C-flux fits were independently verified through 2H-label experiments, enzyme assays, and transcriptome data. To calculate NADPH production, we summed the estimated carbon fluxes through the NADPH-dependent reactions of glucose-6-phosphate dehydrogenase (Zwf), the 6-phosphogluconate dehydrogenase isoenzyme (GndA) (40), isocitrate dehydrogenase (Icd), and initially also malic enzyme isoenzyme (YtsJ) (41), assuming 100% specificity for NADP+, except for Zwf and GndA that were recently shown to be only ∼90% specific (31).
Kinetics of gapB Derepression upon Shift to Nitrogen Starvation
Strains carrying a PgapB-gfpmut3 transcriptional fusion were grown under vigorous shaking at 37 °C in test tubes with M9 medium until an A600 of about unity. After centrifugation, cells were immediately resuspended to the same A600 in either the same medium or in medium lacking the nitrogen source. 100 μl of these resuspensions were placed in 96-well cell culture plates (CELLSTAR, Greiner bio-one) and incubated under constant shaking at 37 °C in a SynergyTM II microplate reader (Biotek). The A600 and fluorescence (excitation, 485/20 nm; emission, 528/20 nm) were measured every 7 min in triplicate cultures. After correction for medium background fluorescence and autofluorescence of the parental strain (i.e. without the PgapB-gfpmut3 fusion), gapB promoter activity was estimated from the GFP concentration measured as fluorescence units per A600 at each time point.
RESULTS
Steady State Physiology in Nitrogen Starvation-induced Resting B. subtilis
To characterize metabolism in nitrogen starving, resting B. subtilis without de novo biomass formation, we grew the wild-type strain in a bioreactor batch culture in glucose minimal medium until mid-exponential phase to an A600 of 1.6. Upon harvesting and resuspending in fresh medium without a nitrogen source, the culture immediately ceased to grow (supplemental Fig. S1) but maintained metabolic activity with a constant glucose uptake rate of 1.9 mmol·g−1·h−1 for at least 5.5 h (Table 2), i.e. 23% of the uptake rate during exponential growth with 8.2 mmol·g−1·h−1 (Fig. 1) (24).
TABLE 2.
Physiological data of nitrogen starvation-induced resting B. subtilis wild-type and mutant cultures at 5.5 h after resuspension
| Strain | Glucose uptake ratea | Specific production rates |
||
|---|---|---|---|---|
| Acetoin | Citrate | Othersb | ||
| mmol·g−1·h−1 | mmol·g−1·h−1 | |||
| Wild-typec | 1.92 | 0.83 | 0.25 | 0.09 |
| Wild-typed | 1.99 | 0.82 | 0.28 | 0.09 |
| gapBd | 2.32 | 1.06 | 0.41 | 0.16 |
| ytsJd | 1.97 | 0.94 | 0.20 | 0.11 |
| gapB/ytsJd | 1.63 | 0.49 | 0.69 | 0.09 |
a Errors were estimated from two independent wild-type experiments to be within 5% for glucose uptake and acetoin production rate, and within 10% for citrate and the other TCA cycle intermediates.
b Shown are the summed secretion rates of the TCA cycle intermediates α-ketoglutarate, succinate, fumarate, and malate. Acetate and pyruvate were not produced.
c Wild-type strain was grown in bioreactor. Based on the physiological rates and a CO2 production rate of 6.04 mmol·g−1·h−1 in this bioreactor experiment, the carbon balance closed to 98%.
d Strains were grown in shake flask cultures.
FIGURE 1.

Relative distribution of intracellular fluxes in exponentially growing batch (A) and nitrogen starvation-induced resting B. subtilis cultures (B). The 13C-labeling experiment was performed with 20% (w/w) [U-13C] and 80% (w/w) [1-13C]glucose, using LC-MS/MS for 13C-pattern determination in metabolic intermediates. Flux values are normalized to the specific glucose uptake rate of each culture, whereas arrow sizes are relative to the glucose uptake rate of batch-grown B. subtilis wild-type. Boxes refer to the estimated forward and backward fluxes. Errors are S.D. obtained from error propagation using multivariate statistics (22, 38). G6P, glucose 6-phosphate; DHAP, dihydroxyacetone phosphate; E4P, erythrose 4-phosphate; F6P, fructose 6-phosphate; PGA, phosphoglycerate; PEP, phosphoenolpyruvate; P5P, pentose 5-phosphate; S7P, sedoheptulose 7-phosphate.
These physiological data suggested a quasi steady state during nitrogen starvation. To determine the time required for metabolic intermediates to attain isotopic stationarity for 13C-flux analysis, we added uniformly labeled [U-13C]glucose to the resting culture ∼1.5 h after entry into starvation. Because this 13C-tracer addition resulted in a final mixture of 50% [U-13C] and 50% naturally labeled glucose in the medium (supplemental Fig. S1), one hence expects 0.50 ± 0.02 fractional labeling and stable isotopologue distributions in all metabolic intermediates at isotopic steady state. As expected from similar experiments (42–45), we observed different dynamics of label enrichment that were a function of metabolite pool size, fluxes, and the metabolic distance to the label entry (supplemental Fig. S2). Within 3 min, the most rapid isotopic steady state was achieved by glucose-6-phosphate, followed by the intermediates of glycolysis and pentose phosphate pathway within ∼10 min. TCA cycle intermediates exhibited the slowest label enrichment, reaching 95% of the input fractional labeling after 200 min. This isotopologue buffering is probably caused by label exchange with the large pool of unlabeled free amino acids through the transamination reactions of glutamate and aspartate (supplemental Fig. S2) (44, 45). To ensure quasi isotopic stationarity, all of the following 13C-experiments with resting cells were therefore conducted for at least 5.5 h.
13C-flux Analysis Reveals Large NADPH Overproduction in Resting Wild-type B. subtilis
Based on the quasi steady state conditions for nitrogen starvation-induced resting B. subtilis, we quantified absolute intracellular carbon fluxes by network-wide stationary isotopologue balancing (22, 38). In this procedure, an intracellular distribution of fluxes is indirectly estimated in silico from measured 13C-patterns and physiological rates as a best fit to the experimental data with a detailed stoichiometric model of atom transitions in metabolism. Because only little de novo protein biosynthesis occurs in resting cells, we could not rely on standard flux methods (19, 36) that detect 13C-patterns in proteinogenic amino acids and instead determined 13C-patterns of intact and fragmented carbon backbones by targeted LC-MS/MS in metabolic intermediates (24). Exponentially growing shake flask cultures were harvested and resuspended in nitrogen starvation medium containing a mixture of 80% (w/w) [1-13C] and 20% (w/w) [U-13C]glucose that is well suited to resolve glucose fluxes in central carbon metabolism consisting of glycolysis, pentose phosphate pathway, TCA cycle, and anaplerotic and gluconeogenic reactions (22). Judged by the consistent physiological rates in bioreactor and shake flasks, both culture conditions were equivalent (Table 2).
Flux computation based on network-wide isotopologue balancing with 13C-labeling pattern of intermediates (supplemental Table S1) revealed the relative distribution of intracellular fluxes in resting cells to be entirely different from the distribution in exponentially growing cultures (Fig. 1) (24). Although the absolute glycolytic flux was ∼4-fold lower, the relative flux into the TCA cycle was 4-fold increased, and significant futile, ATP-dissipating cycling occurred in the phosphoenolpyruvate, pyruvate, and oxaloacetate triangle of resting cells. The latter two features were also described for very slowly growing carbon- or nitrogen-limited continuous cultures of B. subtilis (17, 45). Rather surprisingly, however, we observed an extraordinarily high flux of 64% of the consumed glucose into the pentose phosphate pathway (Fig. 1B), a pathway normally considered to supply pentoses and NADPH for biomass formation that does not occur in our resting cultures. Summing up all NADPH-producing fluxes through the two reactions of the oxidative pentose phosphate pathway, isocitrate dehydrogenase in the TCA cycle and malic enzyme, the data revealed a large catabolic NADPH production of 5.0 ± 1.5 mmol·g−1·h−1 (Fig. 1B and supplemental Table S1). In contrast to exponential growing cells, however, it is unclear how this catabolic NADPH flux is reoxidized to NADP+. Indeed, in the absence of de novo biomass formation as the major NADPH sink, so far unknown mechanisms must operate in resting cells to balance NADPH formation and consumption (Fig. 1).
Transcriptional Analysis in Nitrogen Starvation-induced Resting B. subtilis
To identify such potential NADPH-consuming processes in resting B. subtilis, we compared the transcriptome of exponential growing and nitrogen-starving cultures. Of 5737 measured transcript levels, ∼40% changed significantly during starvation with 1290 transcripts being at least 2-fold down-regulated and 1099 transcripts being at least 2-fold up-regulated (supplemental Fig. S3 and Table S2). There was no indication of a general stress response because 131 of the 156 measured transcripts in the σB-dependent general stress regulon (4) did not change or were even down-regulated (supplemental Table S2). Likewise, we found no indication of an oxidative stress response because none of the 20 genes that are known to respond to oxidative stress induced by hydrogen peroxide or paraquat (46), including the katalase-coding katA gene, were significantly induced in resting cells (supplemental Fig. S4). Several of the genes that are subject to stringent control (47) were also differentially expressed in nitrogen starvation-induced resting cells, although often to a lesser extent. Moreover, some genes of the RelA regulon were repressed in nitrogen starvation-induced resting cells, although they are under a positive stringent control in amino acid starvation conditions (e.g. the ilvBHC/leuABCD operon, ilvK (ywaA), ald, adeC). This confirmed that both starvation conditions are not equivalent and induce specific, but partially overlapping, responses (48). Although some sporulation genes were up-regulated, there was no coordinated sporulation expression pattern, and sporulation frequency remained low (∼1% of the colony forming units) during several hours (supplemental Fig. S5).
As can be expected from an economic response to reduce biosynthesis and to liberate nitrogen-containing compounds that are not required under nitrogen starvation, we observed two pronounced metabolic gene expression responses: (i) an overall down-regulation of biosynthesis pathways, and (ii) up-regulation of genes involved in uptake, salvage, or degradation of intra- and extracellular nitrogen sources. Generally, these results are consistent with an incomplete set of expression data from the transition of exponential growth to nitrogen starvation (48). The general biosynthetic down-regulation upon nitrogen starvation affected all pathways to the major biomass constituents. The pyrimidine and purine biosynthesis (i.e. the pyrRPBC/AA/AB/KDFE and purEKBCSQLFMNHD operons, and the pyrG, pyrH, purA, purT, guaA, and guaC genes) were almost completely shut-off. Similarly, a strong down-regulation was seen for the biosynthesis pathways to the cell wall components peptidoglycan (mur genes) and teichoic acid (dlt, gga, gta but not the tag genes) and to vitamins and cofactors, e.g. biotin (bioWKFDBI), NAD (nadBCA operon, nadE, nadR, and nifS), pyridoxal phosphate (pdxK), and thiamin (thiC). Although most amino acid biosynthesis genes were >2-fold down-regulated, genes for arginine, asparagine, glutamine, and threonine biosynthesis remained unchanged or were even up-regulated. Despite the general down-regulation of biosynthesis genes, the majority of them were still expressed above the background level.
The expected up-regulation of genes for utilization of extracellular nitrogen sources included the low affinity ammonium transporter amtB (nrgA), the nas genes for utilization of nitrate/nitrite, the dpp genes for degradation/uptake of cell wall peptides, and the app/opp genes for oligopeptide uptake (supplemental Table S2). Up-regulation of nucleotide degradation and salvage pathways included the purine salvage (adeC, adk, apt, deoD, gmk, guaD, hprT, ndk, nrdE, nrdF, pupG, purA, purB, xpt) and degradation pathway genes (deoD, pupG, drm, dra, puc, and ureABC) (supplemental Table S2). Strikingly, the pucABCDE operon was induced from a silent state during exponential growth to the highest absolute transcription signal value observed under nitrogen starvation. In contrast to nucleotides, amino acid degradation exhibited a rather heterogeneous response. Although the asparagine, glutamine, proline and serine degradation genes were typically 2- to 5-fold induced, alanine and aspartate degradation genes were 2- to 4-fold down-regulated, and glycine, isoleucine, leucine, and valine degradation gene expression was virtually shut off. The remaining amino acid degradation genes remained at their exponential growth expression level that was moderate for arginine and very low for glutamate, histidine, threonine, and cystine.
Consistent with the overall reduced metabolic activity in nitrogen starvation-induced resting compared with exponentially growing B. subtilis (Fig. 1 and Fig. 2A), important glycolytic genes such as the ptsGHI operon (3–27-fold), the large cggR-gapA-pgk-tpi-pgm-eno operon (6–10-fold), and the pyruvate dehydrogenase-encoding pdhABCD operon (5–9-fold) were essentially repressed. Likewise, the pentose phosphate pathway and TCA cycle were uniformly down-regulated 2–3-fold. Strikingly, the only up-regulated genes in central metabolism were the gluconeogenic gapB and pckA with 39- and 13-fold higher expression levels in resting cells, respectively (Fig. 2A and supplemental Table S2). Because these genes are normally fully repressed by CcpN in the presence of glucose during exponential growth (49, 50), nitrogen starvation appears to alleviate glucose repression, despite the presence of high glucose concentrations.
FIGURE 2.

A, transcript fold changes in central metabolism of nitrogen starvation-induced resting compared with exponentially growing B. subtilis wild-type cultures. B, kinetics of PgapB promoter activity in B. subtilis wild-type (black circles) and yqfL mutant (open circles) upon entry into nitrogen starvation of PgapB-gfp carrying strains. G6P, glucose 6-phosphate; DHAP, dihydroxyacetone phosphate; E4P, erythrose 4-phosphate; F6P, fructose 6-phosphate; PGA, phosphoglycerate; PEP, phosphoenolpyruvate; P5P, pentose 5-phosphate; S7P, sedoheptulose 7-phosphate; N, nitrogen.
It is noteworthy that the small regulatory RNA SR1 encoding ykzW gene, the only other gene known to be repressed by CcpN under glycolytic conditions (51), was also strongly derepressed (36-fold higher expression) in resting cells (supplemental Table S2). As a positive regulator of gapB/pckA/SR1, YqfL had been shown to modulate CcpN repressor activity (49). Although YqfL appears to play only a modest role during exponential growth, our data2 indicated importance of YqfL under nutritional deficiency, which led us to investigate the potential role of this regulator in derepression of gapB. For this purpose, we determined expression of a PgapB-gfp reporter fusion in wild-type and yqfL mutant during the shift from growth into nitrogen starvation. The PgapB promoter was repressed during exponential growth on glucose and strongly derepressed immediately following the shift to nitrogen starvation. This strong derepression was completely abolished in a yqfL mutant (Fig. 2B). The same YqfL-dependent derepression upon nitrogen starvation was also observed for the Psr1 promoter (data not shown). These results demonstrate the involvement of the YqfL regulator in the derepression.
MalS/YtsJ and GapA/GapB Transhydrogenation Cycles Contribute to NADPH Balancing During Nitrogen Starvation
Important for NADPH metabolism, simultaneous activity of the gluconeogenic, NADPH-dependent glyceraldehyde-3-phosphate dehydrogenase GapB and the glycolytic, NAD+-dependent GapA (32) could potentially constitute a transhydrogenation cycle that interconverts the two redox equivalents. Although gapA was down-regulated in resting cells (Fig. 2A), there was still significant residual expression (supplemental Table S2). Furthermore, the 13C-flux estimates indicated indeed some back-flux from 1,3-bisphosphoglycerate to dihydroxyacetone-P in resting cells (Fig. 1B). Because the global flux fit obtained by isotopologue balancing allows only for an indirect estimation of this exchange, we used deuterium-labeled glucose to directly assess the in vivo back-flux through the GapB-catalyzed reaction against the otherwise glycolytic flux in resting cells. Specifically, we chose [4-2H]glucose because the deuterium atom is split off in the GapA-catalyzed reaction that yields 1,3-bisphosphoglycerate (52, 53). Hence, glycolytic intermediates above the GapA reaction should contain the 2H-label, whereas it will be lost in 1,3-bisphosphoglycerate and downstream metabolites (Fig. 3A). A GapB-catalyzed in vivo back-flux should then reveal itself in higher relative contents of unlabeled metabolites in upper glycolysis upon feeding [4-2H]glucose. Relative to the negative control of a gapB deletion mutant, there was indeed a 15 ± 2% higher 2H-labeled loss in upper glycolysis metabolites (FBP, Fru-6-P, Glc-6-P) of the resting wild-type culture (Fig. 3A).
FIGURE 3.
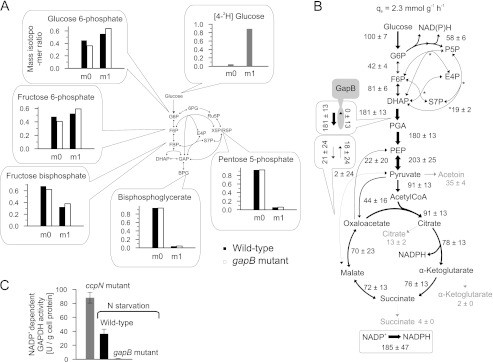
Quasi isotopic steady state 2H-labeled distribution (A), intracellular fluxes (B), and in vitro GapB activity (C) of B. subtilis wild-type and gapB mutant. 2H-Labeling was achieved by feeding 100% [4-2H]glucose to resting wild-type and gapB deletion mutant. Unlabeled molecules are denoted as m0, and single 2H-labeled molecules are labeled as m1. The relative distribution of intracellular fluxes in a nitrogen starvation-induced resting gapB mutant was obtained by LC-MS/MS analysis of 13C-pattern in intermediates upon labeling with 20% (w/w) [U-13C] and 80% (w/w) [1-13C]glucose. Flux values are normalized to the glucose uptake rate, whereas arrow size is relative to glucose uptake rate of an exponentially growing B. subtilis wild-type batch culture (as shown in Fig. 1A). Boxes refer to the forward and backward fluxes. As a positive control, in vitro GapB activity was determined in crude cell extracts of an exponentially growing ccpN mutant (50), where the error bars represent technical replicates. G6P, glucose 6-phosphate; DHAP, dihydroxyacetone phosphate; E4P, erythrose 4-phosphate; F6P, fructose 6-phosphate; PGA, phosphoglycerate; PEP, phosphoenolpyruvate; P5P, pentose 5-phosphate; S7P, sedoheptulose 7-phosphate; N, nitrogen.
To exclude that the relative 2H-labeled loss was caused by significantly different pentose phosphate pathway fluxes that transport mainly unlabeled intermediates (Fig. 3A), we verified similarity of fluxes between resting cultures of wild-type (Fig. 1B) and gapB mutant (Fig. 3B) by 13C-flux analysis. In addition to very similar relative net fluxes in upper glycolysis and pentose phosphate pathway, also the estimated exchange fluxes were similar, and consistently, the global flux fit for the gapB mutant showed an absent GapB flux (supplemental Table S1). Finally, we confirmed GapB activity in resting wild-type cultures by in vitro enzyme assays with cell extracts from an exponentially growing ccpN mutant as a positive control (50) and the resting gapB mutant as the negative control (Fig. 3C). Because all data supported an active gluconeogenic GapB reaction in otherwise glycolytic resting B. subtilis, we assessed the contribution of the GapA/GapB transhydrogenation cycle to overall NADPH balancing from the apparent NADPH overproduction of the resting gapB mutant, again by summing up fluxes through all NADPH-generating reactions. The reduction of the apparent catabolic NADPH overproduction from 5.0 ± 1.5 mmol·g−1·h−1 in the wild-type to 4.7 ± 1.2 mmol·g−1·h−1, in the gapB mutant was disappointingly small and statistically insignificant (Fig. 3B and supplemental Table S1), suggesting that this cycle is either not relevant for redox homeostasis or that it is effectively replaced by another cycle.
A similar potential transhydrogenation cycle could consist of the NAD+- and NADPH-dependent malic enzymes MalS and YtsJ (41) that were both expressed in resting cultures (supplemental Table S2). Akin to the GapA/GapB cycle, we quantified the NADPH balancing capacity of the putative MalS/YtsJ transhydrogenation cycle by 13C-flux analysis from a 80% (w/w) [1-13C] and 20% (w/w) [U-13C]glucose-labeling experiment with the ytsJ mutant. We found only a small reduction in apparent catabolic NADPH overproduction to 4.0 ± 0.5 mmol·g−1·h−1 (Fig. 4A and supplemental Table S1). Because these results showed that the NADPH-dependent malic enzyme YtsJ operated in resting cells in the NADPH-consuming direction from pyruvate to malate, we could improve the confidence of our apparent NADPH overproduction estimate in wild-type to 5.0 ± 0.6 mmol·g−1·h−1 because only the pentose phosphate pathway and TCA cycle fluxes must be considered for NADPH formation (supplemental Table S1).
FIGURE 4.

Relative distribution of intracellular fluxes in nitrogen starvation-induced resting cultures of a B. subtilis ytsJ mutant (A) and ytsJ/gapB double mutant (B). 13C-Labeling pattern were detected by LC-MS/MS in metabolic intermediates from a 20% (w/w) [U-13C] and 80% (w/w) [1-13C]glucose experiment. Flux values are normalized to each cultures glucose uptake rate, whereas arrow sizes are relative to the glucose uptake rate of batch-grown B. subtilis wild-type (shown in Fig. 1A). Boxes refer to the forward and backward fluxes, and gray areas indicate the deleted enzymatic reaction. G6P, glucose 6-phosphate; DHAP, dihydroxyacetone phosphate; E4P, erythrose 4-phosphate; F6P, fructose 6-phosphate; PGA, phosphoglycerate; PEP, phosphoenolpyruvate; P5P, pentose 5-phosphate; S7P, sedoheptulose 7-phosphate.
Because both transhydrogenation cycles might synergistically contribute to NADPH balancing or replace each other, we determined NADPH production in a nitrogen starvation-induced resting culture of the ytsJ/gapB double mutant by 13C-flux analysis. Effective disruption of both transhydrogenation cycles by deleting both NADPH-dependent isoenzymes genes caused high acetoin and citrate production, indicating reduced carbon flux through the NADPH-dependent isocitrate dehydrogenase reaction (Table 2). The apparent catabolic NADPH overproduction of 2.6 ± 0.3 mmol·g−1·h−1 in the ytsJ/gapB double mutant was indeed significantly lower than in either single deletion mutant (Fig. 4B and supplemental Table S1). Thus, the combined activity of both transhydrogenation cycles was capable to balance 2.4 ± 0.3 mmol·g−1·h−1, about half of the apparent catabolic NADPH overproduction in resting B. subtilis.
NADPH Consumption through Simultaneous Anabolism and Catabolism of Amino Acids and a Transhydrogenase Reaction
How does B. subtilis metabolism cope with the remaining apparent NADPH overproduction of 2.6 ± 0.3 mmol·g−1·h−1 in wild-type? Because the transcription data suggested coexistence of de novo biosynthesis and degradation of amino acids, continuous cycling between the NADPH-dependent anabolism and the NAD+-dependent catabolism could result in another NADPH-consuming mechanism (supplemental Fig. S6). If this hypothesis was true, one would expect significant 13C-labeling in certain free amino acids and their precursors in resting cells, which otherwise are expected to be unlabeled because amino acid biosynthesis is not required in the absence of cell growth. Indeed, such in vivo 13C-labeled enrichment (supplemental Fig. S2) was found for the intermediates of one potential glutamate/aspartate cycle that consists of (i) the NADPH-consuming conversion of α-ketoglutarate to glutamate by GltAB, α-ketoglutarate regeneration through AspB-catalyzed glutamate transamination that forms aspartate from oxaloacetate, and (ii) NAD+-dependent aspartate degradation to oxaloacetate by combined activity of ArgG, ArgH, FumC (CitG), and Mdh (Fig. 5). All involved genes were expressed in resting cells (supplemental Table S2). Actually, the genes argG and argH were ∼4-fold up-regulated in resting B. subtilis and are part of the urea cycle that was generally up-regulated (argJ, 1.5×; argB, 1.7×; argC, 2.3×; argD, 2.0×; argF, 1.8×; argG, 4.5×; argH, 3.6×; argI, 0.7×; ureA, 11.2×; ureB, 10.4×; ureC, 8.2×). Additionally, other glutamate and aspartate degradation pathways are possible (supplemental Fig. S6).
FIGURE 5.

Proposed transhydrogenation cycle of glutamate/aspartate biosynthesis/degradation in nitrogen starvation-induced resting B. subtilis.
Because stationary 13C-flux analysis cannot determine the flux through the NADPH-consuming GltAB reaction, we used kinetic flux profiling (28) to estimate the lower bound for the net flux. To determine a reaction flux by kinetic flux profiling, the experimentally determined rate constant of 13C-labeled enrichment, i.e. the ratio of the flux to the total pool size, is multiplied with the intracellular pool size (28). For the NADPH-consuming GltAB reaction, the rate constant was determined by fitting a first-order integrated rate equation to the measured monoisotopic mass time course of glutamate (supplemental Fig. S2), followed by multiplying this rate with the known pool size of glutamate. For the free glutamate pool with a first-order rate of 3.9 ± 0.2 h−1 and an averaged intracellular concentration obtained from different steady state conditions of 77.3 ± 8.6 μmol/g dry cell weight (39), a lower bound of the NADPH-consuming flux of 0.3 ± 0.1 mmol·g−1·h−1 was calculated.
Although this flux through the GltAB reaction would only account for 6 ± 1% of the apparent catabolic NADPH overproduction in resting B. subtilis, the overall contribution of amino acid synthesis to NADPH balancing could be significantly higher because half of the proteinogenic amino acids require NADPH for biosynthesis (supplemental Table S3 and Fig. S6). Because our LC-MS/MS data contained only labeling information for aspartate and glutamate, we determined the 13C-labeled enrichment in free intracellular amino acids after 3.2 h of 13C-labeling in the resting B. subtilis culture (supplemental Fig. S1) also by GC-MS (45). Supporting the hypothesis of significant NADPH consumption by continuous amino acid recycling, we found the free aromatic and branched chain amino acids to be significantly enriched for 13C-labeling (supplemental Table S3). Due to the complexity of amino acid metabolism (supplemental Fig. S6), however, the present data do not allow for a precise quantification of the NADPH consumption by this mechanism, but the 0.3 ± 0.1 mmol·g−1·h−1 NADPH consumption estimated for the GltAB reaction appears to be an underestimate.
Quantification of the NADPH balancing capacity of two combined transhydrogenation cycles and the coupled synthesis/degradation cycle for glutamate/aspartate still left some not yet accounted for apparent NADPH overproduction. Consequently, at least one further mechanism must exist, and the transhydrogenase reaction that directly transfers electrons from NADPH to NAD+ is the most probable candidate (54). Although no genes were annotated for this reaction in B. subtilis, we found significant in vitro transhydrogenase activity in nitrogen starvation-induced resting wild-type that was only marginally lower in exponentially growing cells and similar in the ytsJ/gapB double mutant (Fig. 6A) (31, 55, 56). If this in vitro activity could be exploited in vivo, the transhydrogenase reaction could potentially contribute 1.1 ± 0.1 mmol·g−1·h−1 or ∼21% to NADPH balancing.
FIGURE 6.

Transhydrogenase activity (A) and quantification of NADPH balancing processes in nitrogen starvation-induced resting B. subtilis (B). Transhydrogenase activity was determined in crude cell extracts of exponentially growing B. subtilis wild-type (black bar) and of resting wild-type and ytsJ/gapB double mutant (gray bars), where error bars represent technical replicates. The error bars on the NADPH balancing reactions represent the confidence region of the 13C-flux estimates for the cycles, and the error bars from the in vitro data represent the transhydrogenase activity. U, units.
DISCUSSION
How growth-arrested yet metabolically active bacteria balance their network-wide NADPH redox cofactor fluxes remained unknown because NADPH production and consumption could not be quantified under such conditions. Guided by a global transcript analysis, we identified here the metabolic key mechanisms of B. subtilis to recycle the catabolically produced NADPH into NADH and quantified their relative contribution by a novel method for stationary 13C-flux analysis (24), 2H-labeling experiments, and kinetic flux profiling (28). Based on intracellular carbon flux distributions in B. subtilis wild-type and isogenic deletion mutants in various pathways, we propose the following model of NADPH homeostasis in nitrogen starvation-induced resting B. subtilis (Fig. 6B). Sustained metabolic activity in the absence of cell growth leads to an apparent catabolic NADPH overproduction of 5.0 ± 0.6 mmol·g−1·h−1 that is recycled to NADH by (i) the combined activity of the MalS/YtsJ and GapA/GapB dehydrogenase isoenzyme transhydrogenation cycles, (ii) continuous cycling between anabolism and catabolism of amino acids, and (iii) a transhydrogenase reaction. In particular, the GapA/GapB transhydrogenation cycle was surprising because gapB was considered to be fully repressed by glucose (32, 50). The YqfL-dependent derepression of gapB shown here provides first indication that YqfL could be a sensor of redox imbalance that would influence gapB expression by inhibiting the CcpN repressor activity on gapB. Because transhydrogenation cycles have so far only been shown in higher cells (57, 58), we provide here the first evidence for their in vivo relevance in NADPH balancing of bacteria.
The individual contributions of the above three mechanisms to overall recycling of the catabolically produced NADPH in resting B. subtilis were ∼50% for the two redox cycles, a lower bound of 6% for amino acid cycling, and ∼20% for the transhydrogenase, leaving still an apparent NADPH overproduction of 1.3 ± 0.6 mmol·g−1·h−1 unassigned (Fig. 6B). In principle, the substitution of the three mechanisms for each other, similar to that shown for the two redox cycles, could explain the remaining 25% of apparent NADPH overproduction, and the extent of amino acid cycling between NADPH-requiring anabolism and NADH-producing catabolism could be much larger than the lower bound of 6%. Another potential contributor to redox balancing could be NADPH consumption by detoxification of reactive oxygen species (59, 60), although our transcript data provide no indication for oxidative stress. Lastly, redox cofactor unspecificity of central metabolic enzymes (31) could reduce the amount of catabolically produced NADPH, or, although not reported so far for B. subtilis, a small redox cofactor unspecificity of the respiratory chain could reoxidize some of the overproduced NADPH (61).
In the absence of biosynthetic NADPH requirements, overproduction of NADPH is inevitable in resting cells that continue to catabolize sugars to CO2. The diverse, here described redox cycling mechanisms are a stoichiometric necessity to maintain redox homeostasis in the absence of NADPH requirements for biosynthesis or redox stress. The continued metabolic activity of resting cells ensures reactivity to changing nutritional conditions, a hypothesis that would be consistent with the observation that also very slowly growing B. subtilis under various limitations apparently overproduce NADPH and can restore maximum growth rates as soon as the limitation is reversed (17, 45, 62, 63). The question remains, however, why nitrogen starvation-induced resting B. subtilis metabolism overproduces even more NADPH than would be necessary through the extensive catabolic pentose phosphate pathway fluxes rather than using exclusively the glycolytic pathway.
Supplementary Material
Acknowledgments
We thank K. Kobayashi and N. Ogasawara for generously providing B. subtilis mutants.
Footnotes
This work was supported by European Union BaSysBio Program Grant LSHG-CT-2006-037469.

This article contains supplemental Tables S1–S3 and Figs. S1–S6.
M. Ruhl, D. Le Coq, S. Aymerich, and U. Sauer, unpublished observations.
REFERENCES
- 1. Sonenshein A. L. (2007) Control of key metabolic intersections in Bacillus subtilis. Nat. Rev. Microbiol. 5, 917–927 [DOI] [PubMed] [Google Scholar]
- 2. Navarro Llorens J. M., Tormo A., Martínez-García E. (2010) Stationary phase in gram-negative bacteria. FEMS Microbiol. Rev. 34, 476–495 [DOI] [PubMed] [Google Scholar]
- 3. Hayes C. S., Low D. A. (2009) Signals of growth regulation in bacteria. Curr. Opin. Microbiol. 12, 667–673 [DOI] [PMC free article] [PubMed] [Google Scholar]
- 4. Hecker M., Pané-Farré J., Völker U. (2007) SigB-dependent general stress response in Bacillus subtilis and related gram-positive bacteria. Annu. Rev. Microbiol. 61, 215–236 [DOI] [PubMed] [Google Scholar]
- 5. Hengge-Aronis R. (1993) Survival of hunger and stress: The role of rpoS in early stationary phase gene regulation in E. coli. Cell 72, 165–168 [DOI] [PubMed] [Google Scholar]
- 6. López D., Kolter R. (2010) Extracellular signals that define distinct and coexisting cell fates in Bacillus subtilis. FEMS Microbiol. Rev. 34, 134–149 [DOI] [PubMed] [Google Scholar]
- 7. Sonderegger M., Schümperli M., Sauer U. (2005) Selection of quiescent Escherichia coli with high metabolic activity. Metab. Eng. 7, 4–9 [DOI] [PubMed] [Google Scholar]
- 8. Sandiford B. R., Wooldridge W. R. (1931) “Resting” bacteria. Biochem. J. 25, 2172–2180 [DOI] [PMC free article] [PubMed] [Google Scholar]
- 9. Lewis D. L., Gattie D. K. (1991) The ecology of quiescent microbes. ASM News 57, 27–32 [Google Scholar]
- 10. Vitousek P. M., Howarth R. W. (1991) Nitrogen limitation on land and in the sea: How can it occur? Biogeochemistry 13, 87–115 [Google Scholar]
- 11. Luo Y., Su B., Currie W. S., Dukes J. S., Finzi A. C., Hartwig U., Hungate B., McMurtrie R. E., Oren R., Parton W. J., Pataki D. E., Shaw M. R., Zak D. R., Field C. B. (2004) Progressive nitrogen limitation of ecosystem responses to rising atmospheric carbon dioxide. BioScience 54, 731–739 [Google Scholar]
- 12. Vitousek P. M., Porder S., Houlton B. Z., Chadwick O. A. (2010) Terrestrial phosphorus limitation: Mechanisms, implications, and nitrogen-phosphorus interactions. Ecol. Appl. 20, 5–15 [DOI] [PubMed] [Google Scholar]
- 13. Rennenberg H., Dannenmann M., Gessler A., Kreuzwieser J., Simon J., Papen H. (2009) Nitrogen balance in forest soils: Nutritional limitation of plants under climate change stresses. Plant Biol. 11, 4–23 [DOI] [PubMed] [Google Scholar]
- 14. Botella E., Hübner S., Hokamp K., Hansen A., Bisicchia P., Noone D., Powell L., Salzberg L. I., Devine K. M. (2011) Cell envelope gene expression in phosphate-limited Bacillus subtilis cells. Microbiology 157, 2470–2484 [DOI] [PubMed] [Google Scholar]
- 15. Marzan L. W., Shimizu K. (2011) Metabolic regulation of Escherichia coli and its phoB and phoR genes knock-out mutants under phosphate and nitrogen limitations as well as at acidic condition. Microb. Cell Fact. 10, 39. [DOI] [PMC free article] [PubMed] [Google Scholar]
- 16. Zamboni N., Fischer E., Muffler A., Wyss M., Hohmann H. P., Sauer U. (2005) Transient expression and flux changes during a shift from high to low riboflavin production in continuous cultures of Bacillus subtilis. Biotechnol. Bioeng. 89, 219–232 [DOI] [PubMed] [Google Scholar]
- 17. Dauner M., Storni T., Sauer U. (2001) Bacillus subtilis metabolism and energetics in carbon-limited and excess-carbon chemostat culture. J. Bacteriol. 183, 7308–7317 [DOI] [PMC free article] [PubMed] [Google Scholar]
- 18. Fürch T., Hollmann R., Wittmann C., Wang W., Deckwer W. D. (2007) Comparative study on central metabolic fluxes of Bacillus megaterium strains in continuous culture using 13C-labeled substrates. Bioprocess Biosyst. Eng. 30, 47–59 [DOI] [PubMed] [Google Scholar]
- 19. Sauer U. (2006) Metabolic networks in motion: 13C-based flux analysis. Mol. Syst. Biol. 2, 62. [DOI] [PMC free article] [PubMed] [Google Scholar]
- 20. Zamboni N., Sauer U. (2009) Novel biological insights through metabolomics and 13C-flux analysis. Curr. Opin. Microbiol. 12, 553–558 [DOI] [PubMed] [Google Scholar]
- 21. Wiechert W. (2001) 13C metabolic flux analysis. Metab. Eng. 3, 195–206 [DOI] [PubMed] [Google Scholar]
- 22. Zamboni N., Fendt S. M., Rühl M., Sauer U. (2009) 13C-based metabolic flux analysis. Nat. Protoc. 4, 878–892 [DOI] [PubMed] [Google Scholar]
- 23. Tang Y. J., Martin H. G., Myers S., Rodriguez S., Baidoo E. E., Keasling J. D. (2009) Advances in analysis of microbial metabolic fluxes via 13C isotopic labeling. Mass Spectrom. Rev. 28, 362–375 [DOI] [PubMed] [Google Scholar]
- 24. Rühl M., Rupp B., Nöh K., Wiechert W., Sauer U., Zamboni N. (2012) Collisional fragmentation of central carbon metabolites in LC-MS/MS increases precision of 13C metabolic flux analysis. Biotechnol. Bioeng. 109, 763–771 [DOI] [PubMed] [Google Scholar]
- 25. Kiefer P., Nicolas C., Letisse F., Portais J. C. (2007) Determination of carbon labeling distribution of intracellular metabolites from single fragment ions by ion chromatography tandem mass spectrometry. Anal. Biochem. 360, 182–188 [DOI] [PubMed] [Google Scholar]
- 26. Schaub J., Mauch K., Reuss M. (2008) Metabolic flux analysis in Escherichia coli by integrating isotopic dynamic and isotopic stationary 13C labeling data. Biotechnol. Bioeng. 99, 1170–1185 [DOI] [PubMed] [Google Scholar]
- 27. van Winden W. A., van Dam J. C., Ras C., Kleijn R. J., Vinke J. L., van Gulik W. M., Heijnen J. J. (2005) Metabolic flux analysis of Saccharomyces cerevisiae CEN.PK113–7D based on mass isotopomer measurements of 13C-labeled primary metabolites. FEMS Yeast Res. 5, 559–568 [DOI] [PubMed] [Google Scholar]
- 28. Yuan J., Bennett B. D., Rabinowitz J. D. (2008) Kinetic flux profiling for quantitation of cellular metabolic fluxes. Nat. Protoc. 3, 1328–1340 [DOI] [PMC free article] [PubMed] [Google Scholar]
- 29. Toya Y., Ishii N., Hirasawa T., Naba M., Hirai K., Sugawara K., Igarashi S., Shimizu K., Tomita M., Soga T. (2007) Direct measurement of isotopomer of intracellular metabolites using capillary electrophoresis time-of-flight mass spectrometry for efficient metabolic flux analysis. J. Chromatogr. A 1159, 134–141 [DOI] [PubMed] [Google Scholar]
- 30. Rantanen A., Rousu J., Kokkonen J. T., Tarkiainen V., Ketola R. A. (2002) Computing positional isotopomer distributions from tandem mass spectrometric data. Metab. Eng. 4, 285–294 [DOI] [PubMed] [Google Scholar]
- 31. Fuhrer T., Sauer U. (2009) Different biochemical mechanisms ensure network-wide balancing of reducing equivalents in microbial metabolism. J. Bacteriol. 191, 2112–2121 [DOI] [PMC free article] [PubMed] [Google Scholar]
- 32. Fillinger S., Boschi-Muller S., Azza S., Dervyn E., Branlant G., Aymerich S. (2000) Two glyceraldehyde-3-phosphate dehydrogenases with opposite physiological roles in a nonphotosynthetic bacterium. J. Biol. Chem. 275, 14031–14037 [DOI] [PubMed] [Google Scholar]
- 33. Nicolas P., Mäder U., Dervyn E., Rochat T., Leduc A., Pigeonneau N., Bidnenko E., Marchadier E., Hoebeke M., Aymerich S., Becher D., Bisicchia P., Botella E., Delumeau O., Doherty G., Denham E. L., Fogg M. J., Fromion V., Goelzer A., Hansen A., Härtig E., Harwood C. R., Homuth G., Jarmer H., Jules M., Klipp E., Le Chat L., Lecointe F., Lewis P., Liebermeister W., March A., Mars R. A., Nannapaneni P., Noone D., Pohl S., Rinn B., Rügheimer F., Sappa P. K., Samson F., Schaffer M., Schwikowski B., Steil L., Stülke J., Wiegert T., Devine K. M., Wilkinson A. J., van Dijl J. M., Hecker M., Völker U., Bessières P., Noirot P. (2012) Condition-dependent transcriptome reveals high-level regulatory architecture in Bacillus subtilis. Science 335, 1103–1106 [DOI] [PubMed] [Google Scholar]
- 34. Rasmussen S., Nielsen H. B., Jarmer H. (2009) The transcriptionally active regions in the genome of Bacillus subtilis. Mol. Microbiol. 73, 1043–1057 [DOI] [PMC free article] [PubMed] [Google Scholar]
- 35. Nicolas P., Leduc A., Robin S., Rasmussen S., Jarmer H., Bessières P. (2009) Transcriptional landscape estimation from tiling array data using a model of signal shift and drift. Bioinformatics 25, 2341–2347 [DOI] [PMC free article] [PubMed] [Google Scholar]
- 36. Wiechert W., Schweissgut O., Takanaga H., Frommer W. B. (2007) Fluxomics: Mass spectrometry versus quantitative imaging. Curr. Opin. Plant Biol. 10, 323–330 [DOI] [PMC free article] [PubMed] [Google Scholar]
- 37. de Koning W., van Dam K. (1992) A method for the determination of changes of glycolytic metabolites in yeast on a subsecond time scale using extraction at neutral pH. Anal. Biochem. 204, 118–123 [DOI] [PubMed] [Google Scholar]
- 38. Wiechert W., Möllney M., Petersen S., de Graaf A. A. (2001) A universal framework for 13C metabolic flux analysis. Metab. Eng. 3, 265–283 [DOI] [PubMed] [Google Scholar]
- 39. Kleijn R. J., Buescher J. M., Le Chat L., Jules M., Aymerich S., Sauer U. (2010) Metabolic fluxes during strong carbon catabolite repression by malate in Bacillus subtilis. J. Biol. Chem. 285, 1587–1596 [DOI] [PMC free article] [PubMed] [Google Scholar]
- 40. Zamboni N., Fischer E., Laudert D., Aymerich S., Hohmann H. P., Sauer U. (2004) The Bacillus subtilis yqjI gene encodes the NADP+-dependent 6-P-gluconate dehydrogenase in the pentose phosphate pathway. J. Bacteriol. 186, 4528–4534 [DOI] [PMC free article] [PubMed] [Google Scholar]
- 41. Lerondel G., Doan T., Zamboni N., Sauer U., Aymerich S. (2006) YtsJ has the major physiological role of the four paralogous malic enzyme isoforms in Bacillus subtilis. J. Bacteriol. 188, 4727–4736 [DOI] [PMC free article] [PubMed] [Google Scholar]
- 42. Maier K., Hofmann U., Reuss M., Mauch K. (2008) Identification of metabolic fluxes in hepatic cells from transient 13C-labeling experiments: Part II. Flux estimation. Biotechnol. Bioeng. 100, 355–370 [DOI] [PubMed] [Google Scholar]
- 43. Munger J., Bennett B. D., Parikh A., Feng X. J., McArdle J., Rabitz H. A., Shenk T., Rabinowitz J. D. (2008) Systems-level metabolic flux profiling identifies fatty acid synthesis as a target for antiviral therapy. Nat. Biotechnol. 26, 1179–1186 [DOI] [PMC free article] [PubMed] [Google Scholar]
- 44. Nöh K., Grönke K., Luo B., Takors R., Oldiges M., Wiechert W. (2007) Metabolic flux analysis at ultra short time scale: Isotopically non-stationary 13C labeling experiments. J. Biotechnol. 129, 249–267 [DOI] [PubMed] [Google Scholar]
- 45. Rühl M., Zamboni N., Sauer U. (2010) Dynamic flux responses in riboflavin overproducing Bacillus subtilis to increasing glucose limitation in fed-batch culture. Biotechnol. Bioeng. 105, 795–804 [DOI] [PubMed] [Google Scholar]
- 46. Mostertz J., Scharf C., Hecker M., Homuth G. (2004) Transcriptome and proteome analysis of Bacillus subtilis gene expression in response to superoxide and peroxide stress. Microbiology 150, 497–512 [DOI] [PubMed] [Google Scholar]
- 47. Eymann C., Homuth G., Scharf C., Hecker M. (2002) Bacillus subtilis functional genomics: Global characterization of the stringent response by proteome and transcriptome analysis. J. Bacteriol. 184, 2500–2520 [DOI] [PMC free article] [PubMed] [Google Scholar]
- 48. Tam le T., Eymann C., Antelmann H., Albrecht D., Hecker M. (2007) Global gene expression profiling of Bacillus subtilis in response to ammonium and tryptophan starvation as revealed by transcriptome and proteome analysis. J. Mol. Microbiol. Biotechnol. 12, 121–130 [DOI] [PubMed] [Google Scholar]
- 49. Servant P., Le Coq D., Aymerich S. (2005) CcpN (YqzB), a novel regulator for CcpA-independent catabolite repression of Bacillus subtilis gluconeogenic genes. Mol. Microbiol. 55, 1435–1451 [DOI] [PubMed] [Google Scholar]
- 50. Tännler S., Fischer E., Le Coq D., Doan T., Jamet E., Sauer U., Aymerich S. (2008) CcpN controls central carbon fluxes in Bacillus subtilis. J. Bacteriol. 190, 6178–6187 [DOI] [PMC free article] [PubMed] [Google Scholar]
- 51. Licht A., Preis S., Brantl S. (2005) Implication of CcpN in the regulation of a novel untranslated RNA (SR1) in Bacillus subtilis. Mol. Microbiol. 58, 189–206 [DOI] [PubMed] [Google Scholar]
- 52. Zhang B. L., Yunianta, Martin M. L. (1995) Site-specific isotope fractionation in the characterization of biochemical mechanisms. The glycolytic pathway. J. Biol. Chem. 270, 16023–16029 [DOI] [PubMed] [Google Scholar]
- 53. Roger O., Lavigne R., Mahmoud M., Buisson C., Onno B., Zhang B. L., Robins R. J. (2004) Quantitative 2H NMR at natural abundance can distinguish the pathway used for glucose fermentation by lactic acid bacteria. J. Biol. Chem. 279, 24923–24928 [DOI] [PubMed] [Google Scholar]
- 54. Sauer U., Canonaco F., Heri S., Perrenoud A., Fischer E. (2004) The soluble and membrane-bound transhydrogenases UdhA and PntAB have divergent functions in NADPH metabolism of Escherichia coli. J. Biol. Chem. 279, 6613–6619 [DOI] [PubMed] [Google Scholar]
- 55. Bergsma J., Van Dongen M. B., Konings W. N. (1982) Purification and characterization of NADH dehydrogenase from Bacillus subtilis. Eur. J. Biochem. 128, 151–157 [DOI] [PubMed] [Google Scholar]
- 56. Dauner M., Sauer U. (2001) Stoichiometric growth model for riboflavin-producing Bacillus subtilis. Biotechnol. Bioeng. 76, 132–143 [DOI] [PubMed] [Google Scholar]
- 57. Comte B., Vincent G., Bouchard B., Benderdour M., Des Rosiers C. (2002) Reverse flux through cardiac NADP+-isocitrate dehydrogenase under normoxia and ischemia. Am. J. Physiol. Heart Circ. Physiol. 283, H1505–1514 [DOI] [PubMed] [Google Scholar]
- 58. Overkamp K. M., Bakker B. M., Steensma H. Y., van Dijken J. P., Pronk J. T. (2002) Two mechanisms for oxidation of cytosolic NADPH by Kluyveromyces lactis mitochondria. Yeast 19, 813–824 [DOI] [PubMed] [Google Scholar]
- 59. Lushchak V. I. (2011) Adaptive response to oxidative stress: Bacteria, fungi, plants, and animals. Comp. Biochem. Physiol. C Toxicol. Pharmacol. 153, 175–190 [DOI] [PubMed] [Google Scholar]
- 60. Mailloux R. J., Lemire J., Appanna V. D. (2011) Metabolic networks to combat oxidative stress in Pseudomonas fluorescens. Antonie Van Leeuwenhoek 99, 433–442 [DOI] [PubMed] [Google Scholar]
- 61. Auriol C., Bestel-Corre G., Claude J. B., Soucaille P., Meynial-Salles I. (2011) Stress-induced evolution of Escherichia coli points to original concepts in respiratory cofactor selectivity. Proc. Natl. Acad. Sci. U.S.A. 108, 1278–1283 [DOI] [PMC free article] [PubMed] [Google Scholar]
- 62. Sauer U., Hatzimanikatis V., Bailey J. E., Hochuli M., Szyperski T., Wüthrich K. (1997) Metabolic fluxes in riboflavin-producing Bacillus subtilis. Nat. Biotechnol. 15, 448–452 [DOI] [PubMed] [Google Scholar]
- 63. Tännler S., Decasper S., Sauer U. (2008) Maintenance metabolism and carbon fluxes in Bacillus species. Microb. Cell Fact. 7, 19. [DOI] [PMC free article] [PubMed] [Google Scholar]
- 64. Buescher J. M., Liebermeister W., Jules M., Uhr M., Muntel J., Botella E., Hessling B., Kleijn R. J., Le Chat L., Lecointe F., Mäder U., Nicolas P., Piersma S., Rügheimer F., Becher D., Bessieres P., Bidnenko E., Denham E. L., Dervyn E., Devine K. M., Doherty G., Drulhe S., Felicori L., Fogg M. J., Goelzer A., Hansen A., Harwood C. R., Hecker M., Hubner S., Hultschig C., Jarmer H., Klipp E., Leduc A., Lewis P., Molina F., Noirot P., Peres S., Pigeonneau N., Pohl S., Rasmussen S., Rinn B., Schaffer M., Schnidder J., Schwikowski B., Van Dijl J. M., Veiga P., Walsh S., Wilkinson A. J., Stelling J., Aymerich S., Sauer U. (2012) Global network reorganization during dynamic adaptations of Bacillus subtilis metabolism. Science 335, 1099–1103 [DOI] [PubMed] [Google Scholar]
- 65. Ferguson M. L., Le Coq D., Jules M., Aymerich S., Declerck N., Royer C. A. (2011) Absolute quantification of gene expression in individual bacterial cells using two-photon fluctuation microscopy. Anal. Biochem. 419, 250–259 [DOI] [PubMed] [Google Scholar]
Associated Data
This section collects any data citations, data availability statements, or supplementary materials included in this article.