

Background: 95% of amyloid-β in blood plasma binds to albumin with a Kd of 5 micromolar.
Results: Physiological, micromolar levels of albumin inhibit amyloid fiber formation.
Conclusion: Nearly half of Aβ in the CSF will be bound to albumin and inhibited from forming fibers.
Significance: Levels of albumin in CSF must represent a risk factor and therapeutic target in Alzheimer disease.
Keywords: Albumin, Alzheimer Disease, Amyloid, Biophysics, Kinetics, Protein Misfolding, CSF, ThT, Affinity, Fiber Growth
Abstract
Alzheimer disease is a neurodegenerative disorder characterized by extracellular accumulation of amyloid-β peptide (Aβ) in the brain interstitium. Human serum albumin (HSA) binds 95% of Aβ in blood plasma and is thought to inhibit plaque formation in peripheral tissue. However, the role of albumin in binding Aβ in the cerebrospinal fluid has been largely overlooked. Here we investigate the effect of HSA on both Aβ(1–40) and Aβ(1–42) fibril growth. We show that at micromolar cerebrospinal fluid levels, HSA inhibits the kinetics of Aβ fibrillization, significantly increasing the lag time and decreasing the total amount of fibrils produced. Furthermore, we show that the amount of amyloid fibers generated directly correlates to the proportion of Aβ not competitively bound to albumin. Our observations suggest a significant role for HSA regulating Aβ fibril growth in the brain interstitium.
Introduction
Fibrillar amyloid-β (Aβ),2 a 39–43-residue peptide, is the major constituent of extracellular plaques in the brain interstitium of Alzheimer disease (AD) patients. The most prevalent variations are Aβ(1–40) and Aβ(1–42), with Aβ(1–42) being the more amyloidogenic form. Genetic alterations underlying familial AD indicate that Aβ plays a central role in the disease as inherited AD is associated with mutations in Aβ or its increased production (1).
Interestingly, unlike systemic amyloid-related diseases, although Aβ is found in the blood plasma at 0.1–0.5 nm concentrations (2), similar to Aβ levels found in the cerebrospinal fluid (CSF) (3), Aβ amyloid deposits are largely found in the interstitium within the brain. Human serum albumin (HSA) binds 90–95% of the Aβ found in blood plasma (4, 5). HSA is the most abundant protein in blood serum, at a concentration of ∼640 μm (6), but has a markedly reduced concentration in the CSF of typically 3 μm (7). This may explain why Aβ plaques are only observed in the extracellular space of the brain and not the peripheral tissue.
The affinity of monomeric Aβ for HSA has been determined, and a dissociation constant (Kd) of 5–10 μm for both Aβ(1–40) and Aβ(1–42), based upon a 1:1 stoichiometry, has consistently been reported by a number of groups (5, 8, 9). Indeed, with 640 μm concentration of albumin in blood plasma, a Kd of only 30 μm would be sufficiently tight to bind more than 95% of physiological Aβ.
The level of HSA in the CSF (3 μm) and a micromolar affinity (Kd = 5–10 μm) for Aβ suggests that although the majority of Aβ is bound to HSA in the blood, the capacity of albumin to bind Aβ in the brain interstitium will be quite sensitive to changes in HSA levels. Therefore, variations in the capacity of HSA to bind Aβ, through decreased HSA concentration or competition for the Aβ binding site, could play a role in the buildup of toxic Aβ oligomers and fibers within the brain.
There is some debate over whether HSA binds to Aβ monomers or oligomers. Milojevic et al. (10–12) have performed a series of experiments that have produced results consistent with HSA binding to oligomers but not monomers or fibrils. Similarly, it has been suggested that HSA traps Aβ in an oligomeric form (13). Others have suggested that HSA binds monomers of Aβ (5, 8). A study using immobilized Aβ polymers and biotin labeling indicates that HSA can inhibit soluble Aβ addition to immobilized Aβ seeds, suggesting Aβ polymerization inhibition (9).
As HSA interacts with Aβ, we were interested in how HSA might affect the kinetics of fibril formation, fiber nucleation, and elongation. Although it is often suggested that albumin inhibits fiber formation, we know of no direct study of the kinetics of amyloid formation in the presence of CSF levels of albumin. Here we study inhibition of Aβ fibril growth in detail. With an aim to understand fiber formation and kinetics in vivo, we monitored fibril growth rates using physiologically relevant (1–10 μm) and substoichiometric concentrations of HSA to determine the concentration-dependent inhibition of Aβ fibril formation.
EXPERIMENTAL PROCEDURES
Aβ Production and Solubilization
Aβ(1–40) and Aβ(1–42) were purchased commercially from Zinsser Analytic and Cambridge Research Biochemicals, having been synthesized using solid phase Fmoc (N-(9-fluorenyl)methoxycarbonyl) chemistry. The peptides were characterized by 1H NMR and HPLC, which indicated a single peak with the expected molecular mass. Met35 was confirmed to be unoxidized. Lyophilized Aβ(1–40) and Aβ(1–42) were solubilized by dissolving 0.7 mg/ml Aβ in water at pH 10.5 and then rocked gently at 5 °C for 72 h. The concentration of Aβ was determined using the tyrosine absorbance at 280 nm, ε280 = 1280 m−1 cm−1.
Human Serum Albumin
Essentially, fatty acid-free HSA was purchased from Sigma-Aldrich and solubilized in ultra-high quality water (10−18 ohms−1cm−1 resistivity). The concentration was determined using the absorbance at 280 nm, ε280 = 34445 m−1 cm−1.
Fiber Growth Assay
The kinetics of amyloid formation was monitored by the binding of thioflavin T (ThT) to amyloid fibers. ThT fluorescence occurs at 487 nm upon binding to amyloids; thus the ThT signal is related to the amount of amyloid produced. The ThT measurements were conducted on a BMG Galaxy FLUOstar fluorescence 96-well plate reader, using only the central 60 wells to minimize the effect of evaporation. Readings were obtained using an excitation wavelength of 440 nm and emission wavelength of 490 nm. Readings were taken every 30 min for ∼400 h with the well plates being subjected to 30 s of orbital shaking prior to each measurement. 10 μm Aβ was incubated with 20 μm ThT and the required HSA concentration at 30 °C in 160 mm NaCl. 30 mm HEPES buffer was used throughout to maintain pH at 7.4, with variations of 0.05 pH units or less. Ultra-high quality water (10−18 ohms−1cm−1 resistivity) was used at all times.
The data obtained can be fitted to the growth curve using the following equation (14)
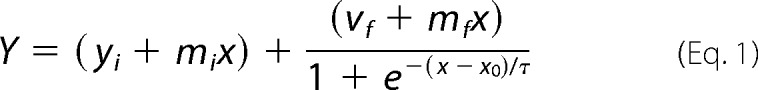 |
where Y is the fluorescence intensity, x is the time, x0 is the time at half-height of fluorescence (t50), and τ is a time constant. This equation can be used to extract a number of empirical parameters including the lag time (tlag = x0 − 2τ), the apparent fiber growth rate (kapp = 1/τ), and the t50. The t50 is influenced by both the nucleation and the elongation phases.
Statistics
Fibril growth curves were presented using KaleidaGraph. Typically, kinetic parameters have been extracted from six raw traces, and the mean values and standard errors were calculated. Analysis of variance (ANOVA) was used to compare the kinetic parameters extracted from curve fitting at different concentrations of HSA. One-way ANOVA with Tukey's HSD post hoc tests was used to reveal significant differences at α = 0.05.
Transmission Electron Microscopy (TEM)
Glow-discharged carbon-coated 300-mesh copper grids were prepared using the droplet method, where 5-μl aliquots of samples from the fiber growth assay were adsorbed for 1 min followed by 5 μl of 2% (w/v) of phosphotungstic acid adjusted to pH 7.4, to negatively stain the sample. Images were recorded on a JEOL JEM-1230 electron microscope operated at 180 kV.
RESULTS
The kinetics of Aβ fibril formation was monitored using ThT, a dye that fluoresces upon binding to amyloid fibrils. The rate of fiber formation of Aβ(1–40) was monitored over time in the presence and absence of increasing concentrations of HSA, using a 96-well plate fluorescence reader. A characteristic fibrillization growth curve was obtained, which has a lag phase and growth phase, due to nucleation and fibril elongation, respectively.
In Fig. 1, we show the fibrillization growth curves obtained from 10 μm Aβ(1–40) in the presence of 0, 3, 5, and 10 μm HSA. Typically, six individual traces were obtained at each albumin concentration, and key kinetic parameters, including the t50, tlag, and kapp, were extracted through fitting the characteristic sigmoidal growth curves (14). For comparison, the average t50 of Aβ fibrillization in the absence of albumin is depicted as a dashed line on each trace. It is clear from Fig. 1 that fibril growth is delayed by all three substoichiometric concentrations of HSA as the elongation phase of the growth curves are all past the average t50 for Aβ(1–40) alone.
FIGURE 1.

Aβ(1–40) fibril growth in the presence of albumin. Fibrillization of 10 μm Aβ(1–40) was monitored using ThT fluorescence. Concentrations of albumin found in the CSF inhibit fiber formation. Here individual traces of Aβ alone (a) and Aβ in the presence of 3 μm (b), 5 μm (c), and 10 μm (d) HSA are shown. The mean t50 for Aβ alone is shown on traces a–d as a dashed line. Fibers were grown in 30 mm HEPES and 160 mm NaCl at pH 7.4 at 30 °C with intermittent agitation. AFU, arbitrary fluorescence units.
There was some variation in the fibril growth kinetics, and so essentially, the identical experiment was repeated on three other separate occasions, an example of which is shown in supplemental Fig. 1. The fibril growth kinetics from these four separate experiments, for Aβ(1–40) fibrillization in the presence of increasing concentrations of HSA, was averaged together to generate large n numbers (n = 24), and the standard errors were calculated, as shown in Fig. 2. Variation in the kinetic parameters for fibril growth recorded on separate days was comparable with variation for individual fiber growth experiments. One-way ANOVA with Tukey's HSD post hoc tests was performed on these data; HSA increased the t50 of Aβ(1–40) fibril growth, but this was only significant (p < 0.05) at half a molar equivalent of HSA (5 μm) and higher. Analysis of the tlag and kapp indicated that HSA prolongs the lag phase of Aβ fibril formation with as little as 1 μm HSA but has no significant effect on the rate of elongation of fibers (kapp) once nucleation has taken place. This means that the effect on the t50 values is exclusively due to the inhibition of fiber nucleation, measured as the lag time (tlag). It is clear that substoichiometric amounts of HSA at concentrations found in the CSF increase the lag time of Aβ(1–40) fiber formation.
FIGURE 2.

Kinetic parameters for Aβ(1–40) fibril growth experiments in the presence of increasing HSA. The mean t50 (a), tlag (b), and kapp (c) values pooled from four separate experiments are shown, with their standard errors (n = 24). Significant differences are shown by connecting lines at α = 0.05. These have been calculated using one-way ANOVA, with Tukey's HSD post hoc tests. The rate of nucleation of fiber formation is significantly reduced by albumin. Fibrillization of 10 μm Aβ(1–40) in 30 mm HEPES and 160 mm NaCl at pH 7.4 at 30 °C was monitored using ThT fluorescence.
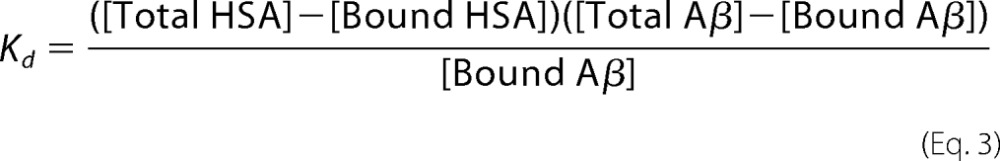
There was also a reduction in the total amount of fibers generated as indicated by the maximal fluorescence signal produced after more than 400 h. From Fig. 1, it is clear that the ThT fluorescence signal for 10 μm HSA present is approximately half the intensity relative to Aβ(1–40) in the absence of HSA. The mean maximum fluorescence intensities and the associated standard errors from the four repeat experiments of Aβ(1–40) fibrillization were also calculated and are shown in Fig. 3a. The trend that can be observed from this is that the maximum fluorescence intensity, or total amount of fibers generated, decreases as the concentration of HSA present increases. This closely agreed with what is known about the Kd of HSA for Aβ. With a Kd of 5 μm and an equimolar mixture of Aβ and HSA (at 10 μm), then 50% of the Aβ molecules will bind to HSA (see supplemental Affinity calculations). Interestingly, at this level of HSA, there was exactly a 50% reduction in total fibers generated for Aβ(1–40) and Aβ(1–42). Using the known dissociation constant between Aβ and HSA (Kd = 5 μm), it is possible to calculate the amount of free and bound Aβ for any concentration of Aβ and HSA by solving simple quadratic equations derived from the equation for the dissociation constant shown below equation 3; see also the supplemental material.
 |
This can be rewritten as shown below.
 |
The strong correlation between the total amount of fiber generated and the predicted amount of available Aβ (not bound to HSA) is striking, as shown in Fig. 3b. In particular, the linear regression gives an R value of 0.998 and a gradient of 1.0.
FIGURE 3.

Competitive effects of albumin on total Aβ fibrils generated. a, the average maximum fluorescence values pooled from four separate experiments of Aβ(1–40) with increasing concentrations of albumin are shown, with their standard errors. Significant differences from Aβ alone are shown by connecting lines at α = 0.05. AFU, arbitrary fluorescence units. b, the correlation between fraction of fibers generated and the calculated fraction of Aβ free to form fibers (not bound to increasing concentrations of HSA), based upon a Kd of 5 μm. There is a strong correlation (r = 0.998) between the percentage fibers generated and the predicted fraction of Aβ not bound to albumin (gradient = 1.04). Fibrillization of 10 μm Aβ(1–40) in 30 mm HEPES and 160 mm NaCl at pH 7.4 at 30 °C was monitored using ThT fluorescence.
To confirm that albumin has indeed inhibited fiber formation, a second detection method was used. Aβ(1–40) was incubated with 10 μm HSA for 400 h as before (Fig. 1), and TEM images were obtained. In the absence of albumin, typical fiber morphology was observed with numerous fibers generated (Fig. 4a). In the presence of albumin, almost no fibers or oligomers could be observed after searching many squares per grid (Fig. 4b).
FIGURE 4.

TEM of Aβ(1–40) fibril growth in the absence (a) and presence (b) of albumin. Aβ forms numerous fibers alone, but very few are formed with HSA present. The scale bar is 100 nm. 10 μm Aβ(1–40) in the presence and absence of 10 μm HSA in 30 mm HEPES and 10 mm NaCl at pH 7.4 was incubated for 400 h at 30 °C with intermittent agitation. Samples are negatively stained with phosphotungstic acid.
Next we wanted to investigate the effect of albumin on Aβ(1–42), the more amyloidogenic Aβ peptide found in plaques. Aβ(1–42) showed similar fibril growth kinetics to Aβ(1–40), as shown in Fig. 5, with all traces in the presence of 5 and 10 μm HSA showing delays in fiber formation relative to Aβ alone. One-way ANOVA with Tukey's HSD post hoc tests showed that HSA significantly (p < 0.05) increased the lag phase and t50 of Aβ(1–42) fibril growth at concentrations over 5 μm (supplemental Fig. 2). Once again, it can be observed that the maximal ThT fluorescence intensity for the fibril growth is reduced in the presence of albumin, indicating that as well as increasing the time required for fibrils to form, the total concentration of fibers formed is also reduced.
FIGURE 5.

Aβ(1–42) fibril growth in the presence of HSA. Fibrillization of 10 μm Aβ(1–42) was monitored using ThT fluorescence. Here individual traces of Aβ alone (a) and Aβ in the presence of 5 μm (b) and 10 μm (c) HSA are shown. The average t50 for Aβ alone is shown on traces a–c as a dashed line. The average t50 values for each concentration of HSA are also shown (d) with their standard errors. Significant differences from Aβ alone are shown by connecting lines at α = 0.05. Physiologically relevant micromolar levels of albumin inhibits Aβ(1–42) fiber formation. Fibers were grown in 30 mm HEPES and 160 mm NaCl at pH 7.4 at 30 °C. AFU, arbitrary fluorescence units.
DISCUSSION
Perhaps because levels of albumin are so much lower in the CSF than the blood plasma, a role for HSA interacting with extracellular Aβ in the brain interstitium has largely been overlooked. However, 3 μm concentration of albumin still represents the major protein component of the CSF. Furthermore, although the affinity of Aβ for HSA is quite modest (Kd = 5 μm), it is clear that ∼40% of Aβ within the CSF will be bound to HSA. Our results show that at physiological levels of albumin, the rate at which fiber formation is nucleated for both Aβ(1–40) and Aβ(1–42) is significantly inhibited. Moreover the total concentration of fiber generated is reduced by HSA; this suggests that HSA binds to Aβ molecules and traps them in a nonfibrillar form so that they are not available to form fibers.
In the presence of physiological micromolar levels of albumin, some but not all Aβ is trapped in a nonfibrillar form of Aβ. Indeed, the total concentration of fibers generated with increasing levels of HSA (Fig. 3) shows a remarkably close agreement with the amount of free and albumin-bound Aβ that would be expected for a Kd of 5 μm. The predicted percentage of free Aβ based on the affinity of HSA for Aβ is shown in Fig. 3b. HSA can bind to Aβ in a nonfibrillar form as the final amount of fibers produced is reduced by the presence of HSA. Our data strongly support HSA interacting with monomeric Aβ to form a 1:1 complex with a Kd of 5 μm. Although binding oligomers of Aβ cannot be ruled out, they must be small, less than five Aβ monomers, as none are observed by TEM. It is notable that a gradient of 1.0 in Fig. 3b (R = 0.998) implies a Kd very close to 5 μm. Albumin binding to the monomeric Aβ effectively reduces the concentration of free Aβ available to form fibers. The lag phase in fibril growth is strongly affected by the Aβ concentration, which would explain the reduction in lag times observed. It seems unlikely that the fiber growth inhibition is due to HSA interacting with Aβ fibers as the fiber elongation growth rates are not reduced once a nucleating seed has formed. This suggests that HSA has a role in preventing the formation of nucleating seeds, but once they are formed, it has less effect in monomer addition to the ends of growing fibers.
There have been a number of protein binding partners of Aβ indicated, in particular, the cellular prion protein (15) but also serum amyloid P (SAP) (16), islet amyloid polypeptide (IAPP) (17), and transthyretin (18). The composition of plaques from the brain supports the idea that HSA interacts with a nonfibrillar/monomeric form of Aβ as HSA is not found within plaques, in contrast to serum amyloid P (19).
HSA is known for its ability to bind many hydrophobic molecules, in particular a number of pharmaceuticals, including warfarin and diazepam, as well as endogenous fatty acids (6). A crystal structure of HSA with fatty acids bound has indicated the location of hydrophobic pockets formed within HSA (20), which may be where part of the hydrophobic C-terminal residues of Aβ could bind to HSA. It has been suggested that there are pharmaceutical and endogenous hydrophobic molecules that could compete with Aβ binding to HSA (9). Albumin is also responsible for the transport of the labile pool of Cu2+ ions in blood plasma (21). Of note, the Aβ-Cu2+ interaction and its role in AD have received significant interest (22–24), and Cu2+ may be transferred from Aβ to HSA (25), meaning that albumin could have two mechanisms by which it inhibits fiber formation.
The concentration of HSA that will delay the fibrillization of Aβ is of interest, in particular, the level where HSA has a significant effect on Aβ fiber formation in vitro, as it is strikingly similar to the extracellular albumin levels found in vivo. HSA is found at a concentration of ∼3 μm in the cerebrospinal fluid and brain interstitium (26). Although HSA is at substantially lower levels than in blood plasma, 3 μm still represents a major constituent of the CSF and the brain interstitium. With 0.1–1 nm Aβ and a 5 μm Kd for albumin, we can assume that 37% of Aβ will be bound to albumin in the CSF. Considerable variations in CSF levels of albumin (1–5 μm) have been reported (27). A reduction to 1 μm levels of albumin will lead to 83% of the Aβ remaining free in solution (see supplemental Affinity Calculations). Thus a decrease in the concentration of HSA could cause an increase in the amount of amyloid fibrils produced and as such lead to the buildup of amyloid plaques. It may therefore be possible that a small change in HSA in the CSF and interstitium may represent a significant risk factor in AD. However, both elevated and reduced levels of albumin have been reported in AD patients (28, 29). It has been noted that Aβ plaques are only ever observed in the brain and not the peripheral tissue, probably because HSA concentrations are of a much higher magnitude (640 μm) in the blood plasma (26). Interestingly, serum albumin levels, in vivo, decrease with age, which is also a known risk factor in AD (30). Furthermore, levels of albumin are often reduced in association with inflammation, also linked with AD.
In conclusion, although the affinity of Aβ for HSA is not thought to be remarkable (Kd = 5 μm), it follows that with levels of albumin in the CSF and brain interstitium of 3 μm, 40% of Aβ in the CSF will be bound to albumin. We show that this Aβ bound to albumin is trapped in a nonfibrillar form, thus reducing the amount of Aβ available to form fibers. Furthermore, based on our fiber growth studies, small variations in albumin in CSF are therefore likely to regulate the amount of extracellular fibril formation in the CSF and brain interstitium. Currently, HSA is showing promise in a phase II clinical trial, using an albumin plasma exchange schedule to reduce levels of Aβ in blood plasma (31). A reduction of the Aβ pool in plasma will, in turn, reduce Aβ levels in the CSF as Aβ is in a dynamic equilibrium and is able to cross the blood-brain barrier (32).
Supplementary Material
Acknowledgments
We thank Graham McPhail and Kristina Zubow for help with TEM and Steven Le Comber for helpful discussion.
This work was supported by a Biotechnology and Biological Sciences Research Council (BBSRC) Quota studentship.

This article contains supplemental Affinity Calculations and Figs. 1 and 2.
- Aβ
- amyloid-β
- AD
- Alzheimer disease
- ANOVA
- analysis of variance
- CSF
- cerebrospinal fluid
- HSA
- human serum albumin
- HSD
- honestly significant difference
- kapp
- apparent growth rate
- SAP
- serum amyloid protein
- t50
- time at half-height of fluorescence
- tlag
- lag time
- TEM
- transmission electron microscopy
- ThT
- thioflavin T.
REFERENCES
- 1. Hardy J., Selkoe D. J. (2002) The amyloid hypothesis of Alzheimer disease: progress and problems on the road to therapeutics. Science 297, 353–356 [DOI] [PubMed] [Google Scholar]
- 2. Seubert P., Vigo-Pelfrey C., Esch F., Lee M., Dovey H., Davis D., Sinha S., Schlossmacher M., Whaley J., Swindlehurst C. (1992) Isolation and quantification of soluble Alzheimer β-peptide from biological fluids. Nature 359, 325–327 [DOI] [PubMed] [Google Scholar]
- 3. Lame M. E., Chambers E. E., Blatnik M. (2011) Quantitation of amyloid-β peptides Aβ(1–38), Aβ(1–40), and Aβ(1–42) in human cerebrospinal fluid by ultra-performance liquid chromatography-tandem mass spectrometry. Anal. Biochem. 419, 133–139 [DOI] [PubMed] [Google Scholar]
- 4. Biere A. L., Ostaszewski B., Stimson E. R., Hyman B. T., Maggio J. E., Selkoe D. J. (1996) Amyloid-β peptide is transported on lipoproteins and albumin in human plasma. J. Biol. Chem. 271, 32916–32922 [DOI] [PubMed] [Google Scholar]
- 5. Kuo Y. M., Kokjohn T. A., Kalback W., Luehrs D., Galasko D. R., Chevallier N., Koo E. H., Emmerling M. R., Roher A. E. (2000) Amyloid-β peptides interact with plasma proteins and erythrocytes: implications for their quantitation in plasma. Biochem. Biophys. Res. Commun. 268, 750–756 [DOI] [PubMed] [Google Scholar]
- 6. Carter D. C., Ho J. X. (1994) Structure of serum albumin. Adv. Protein Chem. 45, 153–203 [DOI] [PubMed] [Google Scholar]
- 7. Stevens R. W., Elmendorf D., Gourlay M., Stroebel E., Gaafar H. A. (1979) Application of fluoroimmunoassay to cerebrospinal fluid immunoglobulin G and albumin. J. Clin. Microbiol. 10, 346–350 [DOI] [PMC free article] [PubMed] [Google Scholar]
- 8. Rózga M., Kłoniecki M., Jabłonowska A., Dadlez M., Bal W. (2007) The binding constant for amyloid Aβ40 peptide interaction with human serum albumin. Biochem. Biophys. Res. Commun. 364, 714–718 [DOI] [PubMed] [Google Scholar]
- 9. Bohrmann B., Tjernberg L., Kuner P., Poli S., Levet-Trafit B., Näslund J., Richards G., Huber W., Döbeli H., Nordstedt C. (1999) Endogenous proteins controlling amyloid-β peptide polymerization: possible implications for β-amyloid formation in the central nervous system and in peripheral tissues. J. Biol. Chem. 274, 15990–15995 [DOI] [PubMed] [Google Scholar]
- 10. Milojevic J., Esposito V., Das R., Melacini G. (2007) Understanding the molecular basis for the inhibition of the Alzheimer Aβ-peptide oligomerization by human serum albumin using saturation transfer difference and off-resonance relaxation NMR spectroscopy. J. Am. Chem. Soc. 129, 4282–4290 [DOI] [PubMed] [Google Scholar]
- 11. Milojevic J., Melacini G. (2011) Stoichiometry and affinity of the human serum albumin-Alzheimer Aβ peptide interactions. Biophys. J. 100, 183–192 [DOI] [PMC free article] [PubMed] [Google Scholar]
- 12. Milojevic J., Raditsis A., Melacini G. (2009) Human serum albumin inhibits Aβ fibrillization through a “monomer-competitor” mechanism. Biophys. J. 97, 2585–2594 [DOI] [PMC free article] [PubMed] [Google Scholar]
- 13. Reyes Barcelo A. A., Gonzalez-Velasquez F. J., Moss M. A. (2009) Soluble aggregates of the amyloid-β peptide are trapped by serum albumin to enhance amyloid-β activation of endothelial cells. J. Biol. Eng. 3, 5–12 [DOI] [PMC free article] [PubMed] [Google Scholar]
- 14. Uversky V. N., Li J., Fink A. L. (2001) Metal-triggered structural transformations, aggregation, and fibrillation of human α-synuclein: a possible molecular NK between Parkinson disease and heavy metal exposure. J. Biol. Chem. 276, 44284–44296 [DOI] [PubMed] [Google Scholar]
- 15. Laurén J., Gimbel D. A., Nygaard H. B., Gilbert J. W., Strittmatter S. M. (2009) Cellular prion protein mediates impairment of synaptic plasticity by amyloid-β oligomers. Nature 457, 1128–1132 [DOI] [PMC free article] [PubMed] [Google Scholar]
- 16. Likó I., Mák M., Klement E., Hunyadi-Gulyás E., Pázmány T., Medzihradszky K. F., Urbányi Z. (2007) Evidence for an extended interacting surface between β-amyloid and serum amyloid P component. Neurosci. Lett. 412, 51–55 [DOI] [PubMed] [Google Scholar]
- 17. Andreetto E., Yan L. M., Tatarek-Nossol M., Velkova A., Frank R., Kapurniotu A. (2010) Identification of hot regions of the Aβ-IAPP interaction interface as high-affinity binding sites in both cross- and self-association. Angew. Chem. Int. Ed. Engl. 49, 3081–3085 [DOI] [PubMed] [Google Scholar]
- 18. Buxbaum J. N., Ye Z., Reixach N., Friske L., Levy C., Das P., Golde T., Masliah E., Roberts A. R., Bartfai T. (2008) Transthyretin protects Alzheimer mice from the behavioral and biochemical effects of Aβ toxicity. Proc. Natl. Acad. Sci. U.S.A. 105, 2681–2686 [DOI] [PMC free article] [PubMed] [Google Scholar]
- 19. Coria F., Castaño E., Prelli F., Larrondo-Lillo M., van Duinen S., Shelanski M. L., Frangione B. (1988) Isolation and characterization of amyloid P component from Alzheimer disease and other types of cerebral amyloidosis. Lab. Invest. 58, 454–458 [PubMed] [Google Scholar]
- 20. Curry S., Mandelkow H., Brick P., Franks N. (1998) Crystal structure of human serum albumin complexed with fatty acid reveals an asymmetric distribution of binding sites. Nat. Struct. Biol. 5, 827–835 [DOI] [PubMed] [Google Scholar]
- 21. Patel S. U., Sadler P. J., Tucker A., Viles J. H. (1993) Direct detection of albumin in human blood plasma by proton NMR spectroscopy. Complexation of nickel2+. J. Am. Chem. Soc. 115, 9285–9286 [Google Scholar]
- 22. Sarell C. J., Wilkinson S. R., Viles J. H. (2010) Substoichiometric levels of Cu2+ ions accelerate the kinetics of fiber formation and promote cell toxicity of amyloid-β from Alzheimer disease. J. Biol. Chem. 285, 41533–41540 [DOI] [PMC free article] [PubMed] [Google Scholar]
- 23. You H., Tsutsui S., Hameed S., Kannanayakal T. J., Chen L., Xia P., Engbers J. D., Lipton S. A., Stys P. K., Zamponi G. W. (2012) Aβ neurotoxicity depends on interactions between copper ions, prion protein, and N-methyl-d-aspartate receptors. Proc. Natl. Acad. Sci. U.S.A. 109, 1737–1742 [DOI] [PMC free article] [PubMed] [Google Scholar]
- 24. Viles J. H. (2012) Metal ions and amyloid fiber formation in neurodegenerative diseases. Copper, zinc and iron in Alzheimer's, Parkinson's and Prion disease. Coord. Chem. Rev., in press [Google Scholar]
- 25. Perrone L., Mothes E., Vignes M., Mockel A., Figueroa C., Miquel M. C., Maddelein M. L., Faller P. (2010) Copper transfer from Cu-Aβ to human serum albumin inhibits aggregation, radical production and reduces Aβ toxicity. ChemBioChem 11, 110–118 [DOI] [PubMed] [Google Scholar]
- 26. Licastro F., Morini M. C., Davis L. J., Biagi R., Prete L., Savorani G. (1993) Studies of blood-brain-barrier permeability and of intrathecal IgG synthesis in patients with Alzheimer's Disease and multi-infarct dementia. Adv. Biosci. 87, 283–284 [Google Scholar]
- 27. Christenson R. H., Behlmer P., Howard J. F., Jr., Winfield J. B., Silverman L. M. (1983) Interpretation of cerebrospinal fluid protein assays in various neurologic diseases. Clin. Chem. 29, 1028–1030 [PubMed] [Google Scholar]
- 28. Elovaara I., Maury C. P., Palo J. (1986) Serum amyloid A protein, albumin, and prealbumin in Alzheimer disease and in demented patients with Down syndrome. Acta Neurol. Scand. 74, 245–250 [DOI] [PubMed] [Google Scholar]
- 29. Elovaara I., Palo J., Erkinjuntti T., Sulkava R. (1987) Serum and cerebrospinal fluid proteins and the blood-brain barrier in Alzheimer disease and multi-infarct dementia. Eur. Neurol. 26, 229–234 [DOI] [PubMed] [Google Scholar]
- 30. Klonoff-Cohen H., Barrett-Connor E. L., Edelstein S. L. (1992) Albumin levels as a predictor of mortality in the healthy elderly. J Clin Epidemiol. 45, 207–212 [DOI] [PubMed] [Google Scholar]
- 31. Boada M., Ortiz P., Anaya F., Hernández I., Muñoz J., Núñez L., Olazarán J., Roca I., Cuberas G., Tárraga L., Buendia M., Pla R. P., Ferrer I., Páez A. (2009) Amyloid-targeted therapeutics in Alzheimer disease: use of human albumin in plasma exchange as a novel approach for Aβ mobilization. Drug News Perspect. 22, 325–339 [DOI] [PubMed] [Google Scholar]
- 32. Mackic J. B., Weiss M. H., Miao W., Kirkman E., Ghiso J., Calero M., Bading J., Frangione B., Zlokovic B. V. (1998) Cerebrovascular accumulation and increased blood-brain barrier permeability to circulating Alzheimer amyloid-β peptide in aged squirrel monkey with cerebral amyloid angiopathy. J. Neurochem. 70, 210–215 [DOI] [PubMed] [Google Scholar]
Associated Data
This section collects any data citations, data availability statements, or supplementary materials included in this article.