

Background: Translation factor SelB was reported to have similar structure in the GTP, GDP, and apo forms.
Results: Heat capacities of SelB interactions with GTP, GDP, GTPγS, and GDPNP are grossly different.
Conclusion: SelB, like other GTPases, is switched by GTP binding and hydrolysis.
Significance: Nonhydrolyzable GTP analogs may induce protein conformations that differ from the authentic GTP-bound form.
Keywords: G Proteins, Isothermal Titration Calorimetry, Selenocysteine, Thermodynamics, Translation Elongation Factors
Abstract
SelB is a specialized translation factor that binds GTP and GDP and delivers selenocysteyl-tRNA (Sec-tRNASec) to the ribosome. By analogy to elongation factor Tu (EF-Tu), SelB is expected to control the delivery and release of Sec-tRNASec to the ribosome by the structural switch between GTP- and GDP-bound conformations. However, crystal structures of SelB suggested a similar domain arrangement in the apo form and GDP- and GTP-bound forms of the factor, raising the question of how SelB can fulfill its delivery function. Here, we studied the thermodynamics of guanine nucleotide binding to SelB by isothermal titration calorimetry in the temperature range between 10 and 25 °C using GTP, GDP, and two nonhydrolyzable GTP analogs, guanosine 5′-O-(γ-thio)triphosphate (GTPγS) and guanosine 5′-(β,γ-imido)-triphosphate (GDPNP). The binding of SelB to either guanine nucleotide is characterized by a large heat capacity change (−621, −467, −235, and −275 cal × mol−1 × K−1, with GTP, GTPγS, GDPNP, and GDP, respectively), associated with compensatory changes in binding entropy and enthalpy. Changes in heat capacity indicate a large decrease of the solvent-accessible surface area in SelB, amounting to 43 or 32 amino acids buried upon binding of GTP or GTPγS, respectively, and 15–19 amino acids upon binding GDP or GDPNP. The similarity of the GTP and GDP forms in the crystal structures can be attributed to the use of GDPNP, which appears to induce a structure of SelB that is more similar to the GDP than to the GTP-bound form.
Introduction
Selenocysteine (Sec)2 is the 21st genetically encoded amino acid identified in selected proteins in all three kingdoms of life (1, 2). Sec is found mainly in the active site of redox enzymes, where it is directly involved in catalysis (3). In bacteria, Sec is encoded by the UGA stop codon in combination with a specific hairpin structure on the mRNA, the Sec insertion sequence. Sec-tRNASec is delivered to the ribosome by a specialized translation factor, SelB, a 69-kDa GTP-binding protein that consists of four domains and recognizes both Sec-tRNASec and the Sec insertion sequence (2). SelB shares significant sequence similarity with other translation factors that deliver aminoacyl-tRNA to the ribosome, such as EF-Tu and eIF2/eIF5B (4, 5). Domains I, II, and III of SelB have the same secondary elements as the respective domains of EF-Tu and are highly conserved among all organisms. Domain I binds guanine nucleotides, and domains I, II, and III together provide most of the contact surface for Sec-tRNASec binding. Domain IV of SelB, which consists of four winged-helix motifs and recognizes the Sec insertion sequence element, has no analogs in other translational GTPases and differs in bacteria, archaea, and eukarya (6).
Despite the structural similarities of the nucleotide-binding domains of SelB and EF-Tu, their nucleotide-binding properties are markedly different. SelB from Escherichia coli binds GTP with higher affinity than GDP and does not require a nucleotide exchange factor (7). In contrast, EF-Tu binds GTP much more weakly than GDP (values of Kd for GTP and GDP are 60 and 1 nm, respectively) (8). Spontaneous dissociation of GDP from EF-Tu is very slow (0.002 s−1) and accelerated by 5 orders of magnitude by the nucleotide exchange factor EF-Ts (8). Furthermore, the arrangement of domains I–III in EF-Tu changes dramatically upon GTP hydrolysis (9, 10), which is used to control aminoacyl-tRNA binding and delivery to the ribosome (11, 12). In contrast, crystal structures suggested that domains I–III in SelB from the archaeon Methanococcus maripaludis adopt similar, GTP-like conformations in the presence of the GTP analog GDPNP or GDP or in the absence of guanine nucleotides (13). This finding is difficult to reconcile with the 6 orders of magnitude differences in the binding affinity of Sec-tRNASec to SelB·GTP and SelB·GDP (14), which prompted us to probe the conformational changes of SelB upon binding of different guanine nucleotides in solution.
In principle, a number of techniques can be used to probe conformational rearrangements of proteins upon ligand binding. Among them, isothermal titration calorimetry (ITC) is an underexploited method to estimate structural changes by measuring the heat released or absorbed during complex formation. This enthalpy change determined at different temperatures allows calculating the heat capacity change, which, in turn, provides information about conformational changes of macromolecules upon binding their ligands. Thus, ITC provides a sensitive method to draw the link between the thermodynamic data and structural rearrangement of the molecules (15, 16). Here, we utilized ITC to estimate the magnitude of conformational changes in SelB upon binding of different guanine nucleotides.
EXPERIMENTAL PROCEDURES
Protein Expression and Purification
SelB containing a C-terminal hexahistidine tag was expressed and purified according to Refs. 17 and 18 with minor modifications. Previous biochemical analysis of the purified wild type and His-tagged proteins showed that the tag does not influence the interaction of SelB with guanine nucleotides, Sec insertion sequence elements, and Sec-tRNASec (14, 18) and is fully functional in mediating UGA read-through in vivo (18). E. coli BL21 cells were transformed with the pT7SelBH6 plasmid and grown in LB medium supplemented with 100 mg/ml ampicillin at 37 °C until A260 = 0.6. Cells were induced with isopropyl-1-thio-β-d-galactopyranoside (0.5 mm), grown for 3 h, harvested by centrifugation, and opened by EmulsiFlex C3 (Avestin) in buffer A (20 mm HEPES, pH 8.0, 500 mm NaCl, 5 mm MgCl2, 10% glycerol, 4 mm 2-mercaptoethanol, 0.1 μm PMSF, 1 crystal of DNase I (Sigma), and 1 tablet of Complete EDTA-free protease inhibitor (Roche Applied Science)). Cell debris were removed by centrifugation at 30,000 × g for 30 min. Cleared lysate was loaded onto a 5-ml Protino nickel-iminodiacetic acid column (Macherey-Nagel), and the protein was purified under nondenaturing conditions according to the manufacturer's protocol. The protein solution was dialyzed against buffer B (50 mm HEPES, pH 7.5, 300 mm KCl, 5 mm MgCl2, 10% glycerol, 4 mm 2-mercaptoethanol), frozen in liquid nitrogen, and stored at −80 °C. The concentration of SelB was determined by absorbance at 280 nm (ϵSelB = 81,080 m−1cm−1 (18)). The preparation of SelB used for the experiments was free of GTP and GDP, as determined by HPLC analysis (19). The protein purity was better than 95% according to SDS-PAGE.
Isothermal Titration Calorimetry
The thermodynamic parameters of SelB binding to different guanine nucleotides were measured using a MicroCal ITC200 instrument (MicroCal, LLC, Northampton, MA). Experiments were carried out in buffer C (50 mm HEPES, pH 7.5, 30 mm KCl, 70 mm NH4Cl, 7 mm MgCl2, 10% glycerol, 4 mm 2-mercaptoethanol). 2-μl aliquots of ligands were injected into the 0.2-ml cell containing the protein solution to achieve a complete binding isotherm. Protein concentrations in the cell ranged from 15 to 45 μm, and ligand concentrations in the syringe ranged from 150 to 700 μm. The heat of dilution was measured by injecting the ligand into buffer without protein or by additional injections of ligand after saturation; the values obtained were subtracted from the observed heat of reaction to obtain the effective heat of binding. The resulting titration curves were fitted using MicroCal Origin software, assuming one set of sites. Affinity constants (Ka), binding stoichiometry (N), and enthalpy changes (ΔH) were determined by a nonlinear regression fitting procedure. The Gibbs energy (ΔG) and the entropy changes (ΔS) were calculated from
To investigate the protonation effects on SelB interactions with GTP, experiments were performed in three buffer systems with different ionization enthalpy (5.7, 0.9, and 11.4 kcal/mol) as described (20): buffer C, buffer D (50 mm K2HPO4, pH 7.5, 100 mm KCl, 7 mm MgCl2, 10% glycerol, 4 mm 2-mercaptoethanol), and buffer E (50 mm Tris-HCl, pH 7.5, 30 mm KCl, 70 mm NH4Cl, 7 mm MgCl2, 10% glycerol, 4 mm 2-mercaptoethanol).
Size-exclusion Chromatography
The separation of apo form and nucleotide-bound forms of SelB was performed on a Waters BioSuite 250, 5-μm HR SEC column, equilibrated with buffer C without glycerol containing 50 μm respective guanine nucleotide. 300 pmol of protein or protein-ligand complex was applied to the column, and the elution profile was monitored by tryptophan fluorescence (λexcitation = 280 nm, λemission = 355 nm).
RESULTS
ITC Measurements with SelB
The thermodynamic parameters of SelB binding to guanine nucleotides were measured for GTP, GDP, GTPγS, and GDPNP (Table 1). GTPγS and GDPNP are commonly used nonhydrolyzable GTP analogs, of which GDPNP was utilized to determine the crystal structure (13). A typical set of ITC data for nucleotide binding to SelB in HEPES buffer at 25 °C is shown in Fig. 1. Guanine nucleotides were bound in an exothermic reaction with one molecule of guanine nucleotide bound to one SelB.
TABLE 1.
Thermodynamic parameters of SelB binding to guanine nucleotides at different temperatures
Kd, dissociation constant; calculated as 1/Ka; Ka, affinity constant; standard deviation did not exceed ± 15%; ΔH, enthalpy change; standard deviation did not exceed ± 8%; ΔG, Gibbs energy; calculated from the equation ΔG = RTlnKd; TΔS, entropy change; calculated from the equation ΔG = ΔH − TΔS.
| Ligand | T | Kd | ΔH | ΔG | TΔS |
|---|---|---|---|---|---|
| °C | μm | kcal/mol | kcal/mol | kcal/mol | |
| GTP | 10 | 0.6 | −9.0 | −8.0 | −1.0 |
| 15 | 0.9 | −11.2 | −8.0 | −3.2 | |
| 20 | 1.5 | −15.3 | −7.8 | −7.5 | |
| 25 | 3.7 | −18.0 | −7.4 | −10.6 | |
| GTPγS | 10 | 0.19 | −10.1 | −8.7 | −1.4 |
| 15 | 0.34 | −12.7 | −8.5 | −4.2 | |
| 20 | 0.45 | −15.0 | −8.5 | −6.5 | |
| 25 | 0.83 | −17.1 | −8.3 | −8.8 | |
| GDPNP | 10 | 1.7 | −6.3 | −7.5 | −1.2 |
| 15 | 2.1 | −7.8 | −7.5 | −0.3 | |
| 20 | 2.9 | −8.6 | −7.4 | −1.2 | |
| 25 | 4.0 | −9.9 | −7.4 | −2.6 | |
| GDP | 10 | 4.8 | −3.1 | −6.9 | 3.8 |
| 15 | 7.9 | −4.6 | −6.7 | 2.1 | |
| 20 | 13 | −5.7 | −6.6 | 0.9 | |
| 25 | 20 | −8.1 | −6.4 | −1.7 |
FIGURE 1.

SelB interaction with guanine nucleotides measured by ITC. Upper and lower panels, titration curves (upper panels) and binding isotherms (lower panels) of SelB interaction with GTP (A), GTPγS (B), GDPNP (C), and GDP (D) at 25 °C in HEPES buffer.
Many protein-ligand interactions proceed with a concomitant uptake or release of protons. Whenever binding is coupled to changes in the net protonation state of the system, the heat of protonation/deprotonation will contribute to the overall heat of binding, and the observed enthalpy will depend on the ionization enthalpy of the buffer (21). To examine the contribution of the heat of buffer ionization to complex formation, the interaction of SelB with GTP was studied in phosphate, HEPES, and Tris buffers over a wide range of temperatures (Fig. 2A). These buffers were chosen because they are commonly used in biochemical experiments with translation factors and have grossly different proton ionization heats (20). The binding stoichiometry for SelB and GTP was 1:1 in HEPES and Tris buffers, but was slightly lower (0.8 mol of ligand per mol of SelB) in phosphate buffer, probably due to an effect on the activity of SelB. The binding constants were almost the same (less than 15% difference) in the three buffers (data not shown). The dependence of the observed change in binding enthalpy of SelB·GTP interaction on the proton ionization enthalpy of buffers provides information on whether the binding is coupled to the uptake or release of protons as the same changes in the protonation state of the system result in different heat effects in different buffers (Fig. 2B) (15). The slope of the plot yields the net number of protons coupled to the binding reaction, 0.2–0.3 for the three buffers used, and the Y-intercept yields the biochemical binding enthalpy change at the given temperature, ΔH°′ (20). The latter represents the true heat released upon complex formation when the complex formation is not affected by buffer ionization heat because the intercept gives the heat value for the reaction in a hypothetical buffer with the proton ionization heat equal to 0. The biochemical enthalpy changes were used to calculate the biochemical heat capacity (Table 2) (Fig. 2C), and the latter was compared with the heat capacity obtained in other buffers. The heat capacities were the same within standard error (Table 2), suggesting that buffer ionization does not have a significant impact on the binding of SelB to GTP. Further studies were carried out in HEPES buffer, which is compatible with our earlier experiments.
FIGURE 2.

Effect of buffers on the binding enthalpy of SelB-GTP interaction. A, binding enthalpy of GTP to SelB in phosphate buffer (●), HEPES buffer (○), and Tris buffer (■) as a function of temperature. B, dependence of binding enthalpy of SelB-GTP interaction on the buffer proton-ionization enthalpy at 10 °C (●), 15 °C (○), 20 °C (■), and 25 °C (□). The values for ΔHion for the three buffers used are from Ref. 20. C, temperature dependence of the biochemical binding enthalpy of GTP to SelB. Standard deviations of measurements are given by error bars (in some cases not visible because they are smaller than symbol size).
TABLE 2.
Heat capacity changes and accessible surface area for SelB binding to guanine nucleotides
ΔCp, heat capacity change; obtained as ΔH/dT; ΔASAap and ΔASAp, changes in apolar and polar solvent-accessible surface areas assuming that all the changes were conferred by either apolar (AAap) or polar (AAp) residues, respectively.
| Ligand | Buffer | ΔCp | ΔASAap | ΔASAp | AAap | AAp |
|---|---|---|---|---|---|---|
| cal × mol−1 × K−1 | Å2 | Å2 | ||||
| GTP | HEPES | −621 ± 48 | 1380 | 2388 | 41 | 43 |
| GTPγS | −467 ± 17 | 1038 | 1796 | 31 | 32 | |
| GDPNP | −235 ± 15 | 522 | 904 | 15 | 16 | |
| GDP | −275 ± 16 | 611 | 1058 | 18 | 19 | |
| GTP | Biochemical | −536 ± 50 | ||||
| GTP | Tris | −568 ± 63 | ||||
| GTP | Phosphate | −511 ± 49 |
Affinities of GTP, GDP, GTPγS, and GDPNP to SelB at Different Temperatures
Affinities of guanine nucleotide binding to SelB were measured at 10, 15, 20, and 25 °C, and the results are summarized in Table 1 as equilibrium dissociation constants (Kd). The affinity of guanine nucleotides to SelB decreased with increased temperature (10–25 °C): 6-fold for GTP, 2-fold for GDPNP, and 4-fold for GTPγS and GDP. Thus, the affinity of SelB to GTP was almost 3-fold higher than to GDPNP at 10 °C (0.6 and 1.7 μm), but at 25 °C, the affinities were practically the same (3.7 and 4.0 μm). The comparison of SelB affinities to GTP and GDP at different temperatures also revealed some reduction in the affinity difference at higher temperatures (7.6-fold at 10 °C versus 5.3-fold at 25 °C), which was, however, not as dramatic as the temperature-dependent change in the affinity difference for GTP/GDPNP. Surprisingly, the affinity of the SelB·GTPγS complex was 3–4-fold higher than that of the SelB·GTP complex at all temperatures studied (Table 1).
Energetics of Complex Formation between SelB and Guanine Nucleotides
The interaction of SelB with guanine nucleotides has a significant exothermic heat effect (−18.0, −17.1, −9.9, and −8.1 kcal × mol−1 with GTP, GTPγS, GDPNP, and GDP at 25 °C, respectively) (Table 1). Binding is driven by favorable negative changes in binding enthalpy and opposed by unfavorable entropic contributions (−10.6, −8.8, −2.6, and −1.7 kcal × mol−1 with GTP, GTPγS, GDPNP, and GDP at 25 °C, respectively). In the temperature range of 10–25 °C, ΔH and TΔS were temperature-dependent, whereas ΔG was almost insensitive due to enthalpy-entropy compensation.
ΔH plotted versus temperature yields a straight line with a slope representing the heat capacity (ΔCp) (Table 2) (Fig. 3) (15); the latter can be used to estimate the surface area change of SelB upon forming a complex. The removal of surface area of the protein from the contact with solvent was shown to be associated with a negative ΔCp as the behavior of the solvent is significantly different in bulk and on the surface of the macromolecule (22, 23). Thus, for any process in which water is released from the surface, ΔCp is proportional to the size of the surface involved in the process (21). The change in the solvent-accessible surface area (ΔASA) is the difference of ASA of the final and initial states; the value of ΔASA is negative for the binding of a ligand to a macromolecule, assuming that the protein closes on its ligand upon complex formation (15, 16). ΔASA is divided into apolar (ΔASAap) and polar (ΔASAp) components depending on which amino acids are buried upon interaction. Studies of the dissolution of solid model compounds suggested the following relationship between ΔCp and ΔASA (24, 25)
where Δcap and Δcp (0.45 and −0.26, respectively) are the elementary apolar and polar contributions per mole of Å2 empirically determined by ACCESS (Presnell SR) and suitable for ΔCp calculations based on ASAs (21). ΔASAap and ΔASAp were calculated assuming that all the changes are conferred by either apolar or polar residues, respectively (Table 2). The values for the buried area were converted into the amount of amino acids that were removed from the surface using the average ASA for apolar (34 Å2) and polar (56 Å2) amino acids (26).
FIGURE 3.

Heat capacity changes upon SelB interaction with guanine nucleotides. A, temperature dependence of binding enthalpy changes upon SelB interactions with GTP (●), GTPγS (○), GDPNP (■), and GDP (□). Standard deviations of measurements are given by error bars, which are smaller than the symbol size. B, bar representation of heat capacity changes upon SelB interactions with guanine nucleotides.
GTP binding to SelB caused a large change in heat capacity, −621 cal × mol−1 × K−1, with an estimated alteration in the accessible surface area ranging from 1380 to 2388 Å2, corresponding to 41–43 amino acids. With GTPγS, the change in heat capacity was somewhat smaller, −467 cal × mol−1 × K−1; the corresponding protein area buried upon SelB·GTPγS complex formation was 1038–1796 Å2, and the number of buried amino acid residues was 31–32. The smallest changes were observed with GDP and GDPNP. The heat capacity change was relatively small (−275 and −235 cal × mol−1 × K−1, respectively), corresponding to an apparent buried area in the range of 522–1058 Å2 and to 15–19 amino acids that have changed their interaction partners upon protein-ligand interaction.
To further verify the differences in SelB conformations upon binding of GTP, GDP, and nonhydrolyzable analogs, we analyzed the chromatographic mobility of SelB and the respective complexes by size-exclusion chromatography. The separation of molecules is based on differences in the hydrodynamic volume, which allowed us to distinguish different conformations of SelB. The apparent hydrodynamic radii of SelB in apo form and nucleotide-bound forms were significantly different, providing a clear separation of all five forms of SelB (Fig. 4). The order of elution follows the magnitude of conformational changes in SelB that were derived from the ITC data, with the complexes eluting in the order SelB·GTP, SelB·GTPγS, SelB·GDP, SelB·GDPNP, and SelB-apo. The differences between the GTP, GDP, and apo forms are particularly clear.
FIGURE 4.
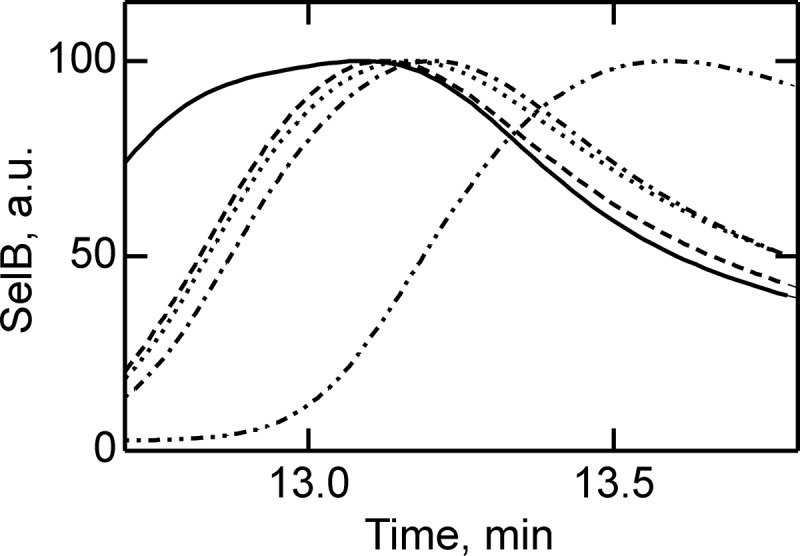
Separation of apo form and nucleotide-bound forms of SelB by size-exclusion chromatography. Elution profiles of SelB·GTP (——), SelB·GTPγS (– – –), SelB·GDP (····), SelB·GDPNP (·–·–·–), and SelB (··–··–··–) were monitored by intrinsic tryptophan fluorescence (λexcitation = 280 nm, λemission = 355 nm). a. u., arbitrary units.
The total entropic contribution in ligand binding is composed of three major components (24): (i) the solvation term (ΔSsolv), which is the entropy change resulting from the release of solvent or changes in the structure of the solvent when a complex is formed from two molecules in solution; (ii) the configurational term (ΔSconf), which reflects the restriction of the amino acid side chains and the polypeptide backbone; and (iii) the rotational/translational entropy term (ΔSr/t) that describes the loss of rotational and translational degrees of freedom, as expressed by the equation
The solvation term can be approximated for any temperature by
where TS is the temperature at which there is no significant solvent contribution to the entropy change; from extrapolation, TS = 112 °C (27). Empirical and theoretical models suggest that the rotational/translational entropy term ΔSr/t contributes approximately −8 cal × mol−1 × K−1 for a bimolecular binding event (28). Because ΔS value is experimentally measured, and ΔSsolv and ΔSr/t can be estimated, ΔSconf is calculated from Equation 4.
The results of the deconvolution of entropy changes are summarized in Table 3. Solvent reorganization provided a substantial gain in binding entropy due to water release. After subtracting from ΔS the favorable ΔSsolv term and the small unfavorable ΔSr/t, a large unfavorable entropic contribution ΔSconf remained. With GDP and GDPNP as a ligand, the absolute values of ΔSsolv and ΔSconf are very similar and cancel each other (70 and −68 cal × mol−1 × K−1 for GDP and 60 and −61 cal × mol−1 × K−1 for GDPNP), resulting in a very small total entropy change (−5.6 and −8.6 cal × mol−1 × K−1, respectively). In contrast, with GTP and GTPγS, the favorable ΔSsolv is overcompensated by the large unfavorable ΔSconf, suggesting that these reactions proceed at a cost of an unfavorable entropy change (−35.6 and −29.6 cal × mol−1 × K−1 for GTP and GTPγS, respectively). An unfavorable ΔSconf may originate from (i) the loss of mobility of amino acid side chains that are in direct contact with the substrate, and (ii) an increasing degree of folding or tightening of domains, particularly in the area of substrate binding. On the assumption that only minor configurational entropic contributions of the guanine nucleotide take place upon binding, one can estimate the number of amino acids (Xres) of SelB participating in the interaction (Table 3)
where −4.3 cal × mol−1 × K−1 is the average configurational entropy change per amino acid residue obtained from the thermodynamic database for the folding/unfolding of monomeric proteins (29). The recalculation of the configurational entropic component suggested that 43 amino acids were affected by GTP binding to SelB, 33 were affected by GTPγS binding, and 14 and 16 were affected by GDPNP and GDP, respectively. These numbers are in excellent agreement with those obtained from the changes in the accessible surface area of formed complexes (Table 2) and provide consistent estimations of the magnitude of the conformational changes of SelB taking place upon binding of different guanine nucleotides.
TABLE 3.
Deconvolution of entropy changes for SelB binding to guanine nucleotides at 25 °C
ΔStot, total entropy change; ΔSsolv, ΔSconf, and ΔSr/t, solvation, configurational, and rotational/translational components of the total entropy change; AA, amino acids affected upon interaction.
| Ligand | ΔStot | ΔSsolv | ΔSconf | ΔSr/t | AA |
|---|---|---|---|---|---|
| cal × mol−1 × K−1 | cal × mol−1 × K−1 | cal × mol−1 × K−1 | cal × mol−1 × K−1 | ||
| GTP | −35.6 | 159.1 | −186.7 | −8 | 43 |
| GTPγS | −29.6 | 119.6 | −141.2 | −8 | 33 |
| GDPNP | −8.6 | 60.2 | −60.8 | −8 | 14 |
| GDP | −5.6 | 70.4 | −68.1 | −8 | 16 |
DISCUSSION
In this work, we probed the conformational changes of SelB from E. coli upon binding of different guanine nucleotides using ITC, which allows monitoring of the interactions of the factor in solution at physiological buffer conditions. From the heat capacity change, the change in the solvent-exposed area was calculated, which, in turn, provided insights into the magnitude of the conformational rearrangement in the protein upon complex formation (21).
GTP binding to SelB caused a large change in heat capacity, suggesting a major structural rearrangement corresponding to 41–43 amino acids that altered their contacts upon binding. With GTPγS, the conformational changes were somewhat smaller, indicating that 31–32 amino acids were affected by complex formation. The smallest changes were observed with GDP and GDPNP with 15–19 amino acids that changed their interaction partners upon interaction with SelB. An almost identical conformation of SelB in the presence of GDP and GDPNP is in line with the crystal structures of SelB·GDP and SelB·GDPNP from M. maripaludis (13), which revealed that the protein in these complexes adopts similar conformations. That the apo form had the same conformation (13) is inconsistent with the present results. Most importantly, the ITC measurements indicate that the structures of the GTP- and GDP-bound forms of SelB are different and that about 25 amino acids rearrange during the GTP-GDP conformational switch.
Another important result of this work is the clear functional difference between the nonhydrolyzable GTP analogs. Although it is usually assumed that all nonhydrolyzable GTP analogs can readily substitute for GTP, our findings suggest that a careful analysis of different GTP analogs is required to find the one that resembles the natural substrate most closely. The affinity of SelB for GDPNP is only two times lower than for GTP, but the values of both enthalpy and entropy changes resembled more those of GDP binding. Furthermore, SelB·GDPNP has a 10-fold lower affinity for Sec-tRNASec when compared with SelB·GTP (14), supporting the notion that GDPNP is not an authentic GTP analog for SelB. On the other hand, binding of GTPγS to SelB is surprisingly tight with a Kd value 3–4 times smaller than that of SelB·GTP. Because other thermodynamic parameters are comparable for GTPγS and GTP complexes of SelB, we conclude that GTPγS is a better GTP analog for SelB than GDPNP. The general implication of these findings is that nonhydrolyzable GTP analogs are not in all cases faithful replacements for GTP, and thus, results obtained with the help of these analogs, including crystal structures, have to be interpreted with caution. In fact, crystal structures suggested that the overall domain arrangements in SelB (13), IF2/eIF5B (30), or EF-G (31–33) are essentially identical in the apo form and GDP- and GDPNP-bound forms; the observed limited conformational changes in the switch 1 and 2 regions were confined to the immediate vicinity of the γ-phosphate. In contrast, the ITC results indicate a large difference between the GTP-bound and apo forms, corresponding to rearrangements upon GTP binding of about 42 amino acids in SelB, 58 amino acids in IF2 (34), and 19 amino acids in EF-G (35). The use of GDPNP, rather than GTP, in the structural work might explain these discrepancies.
Our data indicate that SelB can adopt three discrete conformations that are clearly distinct from each other: the apo form, which is the most open form of the protein, the closed GTP-bound form; and the GDP-bound form, which is the intermediate between the apo form and the GTP-bound form. Given the high concentration of GTP in the cell and the high rate of nucleotide binding to SelB, the apo form is most probably short lived and therefore unlikely to play a functional role, whereas the transition between the GTP to GDP form is essential for the function of SelB on the ribosome. The heat capacity change associated with the GTP-to-GDP switch is 346 cal × mol−1 × K−1, which is larger than that estimated for EF-G (35) and IF2 (34), 250 and 290 cal × mol−1 × K−1, respectively. Part of this rearrangement was suggested to come from alterations in the switch 1 and switch 2 regions of the factors, by analogy to the well documented structural changes observed in EF-Tu and other GTPases (36). However, given the large number of amino acid residues that change their partner during complex formation, i.e. about 25 amino acids in SelB, other structural changes, e.g. in the contacts between domains, are likely to contribute as well. Thus, in contrast to the results of structural studies (13), the ITC analysis suggests that the GTP- and GDP-bound forms of SelB are different and that the factor is likely to follow the functional and structural cycle typical for many other GTPases. Upon interaction with GTP SelB adopts a specific compact conformation that facilitates extremely tight binding of Sec-tRNASec (Kd = 0.2 pm) (14). This unusually high affinity is required to protect utterly labile Sec-tRNASec from destruction by hydrolysis or oxidation and deliver it to the ribosome. After GTP hydrolysis, SelB changes its conformation to increase the dissociation rate of Sec-tRNASec by 6 orders of magnitude (14), which appears sufficiently high to allow for rapid transfer of tRNA from the factor to the ribosome. Thus, the conformational rearrangements of SelB are crucial for Sec delivery and incorporation on the ribosome translating mRNA coding for selenoproteins.
Acknowledgments
We thank August Böck for generous gifts of components of selenocysteine insertion system and plasmid constructs and Wolfgang Wintermeyer for critically reading the manuscript.
This work was supported by grants from the Deutsche Forschungsgemeinschaft and by the funding of the Max Planck Society.
- Sec
- selenocysteine
- Sec-tRNASec
- selenocysteyl-tRNA
- EF-Tu
- elongation factor Tu
- ITC
- isothermal titration calorimetry
- GTPγS
- guanosine 5′-O-(γ-thio)triphosphate
- GDPNP
- guanosine 5′-(β,γ-imido)-triphosphate
- ΔCp
- heat capacity
- ΔASA
- solvent-accessible surface area
- ΔSsolv
- solvation entropy term
- ΔSconf
- configurational entropy term
- ΔSr/t
- rotational/translational entropy term.
REFERENCES
- 1. Allmang C., Krol A. (2006) Selenoprotein synthesis: UGA does not end the story. Biochimie 88, 1561–1571 [DOI] [PubMed] [Google Scholar]
- 2. Yoshizawa S., Böck A. (2009) The many levels of control on bacterial selenoprotein synthesis. Biochim. Biophys. Acta 1790, 1404–1414 [DOI] [PubMed] [Google Scholar]
- 3. Johansson L., Gafvelin G., Arnér E. S. (2005) Selenocysteine in proteins: properties and biotechnological use. Biochim. Biophys. Acta 1726, 1–13 [DOI] [PubMed] [Google Scholar]
- 4. Hilgenfeld R., Böck A., Wilting R. (1996) Structural model for the selenocysteine-specific elongation factor SelB. Biochimie 78, 971–978 [DOI] [PubMed] [Google Scholar]
- 5. Keeling P. J., Fast N. M., McFadden G. I. (1998) Evolutionary relationship between translation initiation factor eIF-2γ and selenocysteine-specific elongation factor SELB: change of function in translation factors. J. Mol. Evol. 47, 649–655 [DOI] [PubMed] [Google Scholar]
- 6. Yoshizawa S., Rasubala L., Ose T., Kohda D., Fourmy D., Maenaka K. (2005) Structural basis for mRNA recognition by elongation factor SelB. Nat. Struct. Mol. Biol. 12, 198–203 [DOI] [PubMed] [Google Scholar]
- 7. Thanbichler M., Bock A., Goody R. S. (2000) Kinetics of the interaction of translation factor SelB from Escherichia coli with guanosine nucleotides and selenocysteine insertion sequence RNA. J. Biol. Chem. 275, 20458–20466 [DOI] [PubMed] [Google Scholar]
- 8. Gromadski K. B., Wieden H. J., Rodnina M. V. (2002) Kinetic mechanism of elongation factor Ts-catalyzed nucleotide exchange in elongation factor Tu. Biochemistry 41, 162–169 [DOI] [PubMed] [Google Scholar]
- 9. Berchtold H., Reshetnikova L., Reiser C. O., Schirmer N. K., Sprinzl M., Hilgenfeld R. (1993) Crystal structure of active elongation factor Tu reveals major domain rearrangements. Nature 365, 126–132 [DOI] [PubMed] [Google Scholar]
- 10. Kjeldgaard M., Nissen P., Thirup S., Nyborg J. (1993) The crystal structure of elongation factor EF-Tu from Thermus aquaticus in the GTP conformation. Structure 1, 35–50 [DOI] [PubMed] [Google Scholar]
- 11. Kothe U., Rodnina M. V. (2006) Delayed release of inorganic phosphate from elongation factor Tu following GTP hydrolysis on the ribosome. Biochemistry 45, 12767–12774 [DOI] [PubMed] [Google Scholar]
- 12. Schrader J. M., Chapman S. J., Uhlenbeck O. C. (2011) Tuning the affinity of aminoacyl-tRNA to elongation factor Tu for optimal decoding. Proc. Natl. Acad. Sci. U.S.A. 108, 5215–5220 [DOI] [PMC free article] [PubMed] [Google Scholar]
- 13. Leibundgut M., Frick C., Thanbichler M., Böck A., Ban N. (2005) Selenocysteine tRNA-specific elongation factor SelB is a structural chimera of elongation and initiation factors. EMBO J. 24, 11–22 [DOI] [PMC free article] [PubMed] [Google Scholar]
- 14. Paleskava A., Konevega A. L., Rodnina M. V. (2010) Thermodynamic and kinetic framework of selenocysteyl-tRNASec recognition by elongation factor SelB. J. Biol. Chem. 285, 3014–3020 [DOI] [PMC free article] [PubMed] [Google Scholar]
- 15. Jelesarov I., Bosshard H. R. (1999) Isothermal titration calorimetry and differential scanning calorimetry as complementary tools to investigate the energetics of biomolecular recognition. J. Mol. Recognit. 12, 3–18 [DOI] [PubMed] [Google Scholar]
- 16. Ladbury J. E., Chowdhry B. Z. (1996) Sensing the heat: the application of isothermal titration calorimetry to thermodynamic studies of biomolecular interactions. Chem. Biol. 3, 791–801 [DOI] [PubMed] [Google Scholar]
- 17. Fischer N., Paleskava A., Gromadski K. B., Konevega A. L., Wahl M. C., Stark H., Rodnina M. V. (2007) Toward understanding selenocysteine incorporation into bacterial proteins. Biol. Chem. 388, 1061–1067 [DOI] [PubMed] [Google Scholar]
- 18. Thanbichler M., Böck A. (2003) Purification and characterization of hexahistidine-tagged elongation factor SelB. Protein Expr. Purif. 31, 265–270 [DOI] [PubMed] [Google Scholar]
- 19. John J., Sohmen R., Feuerstein J., Linke R., Wittinghofer A., Goody R. S. (1990) Kinetics of interaction of nucleotides with nucleotide-free H-ras p21. Biochemistry 29, 6058–6065 [DOI] [PubMed] [Google Scholar]
- 20. Doyle M. (1999) Titration microcalorimetry in Current Protocols in Protein Science, Units 204.1–204.15, John Wiley & Sons, Inc., New York: [DOI] [PubMed] [Google Scholar]
- 21. Perozzo R., Folkers G., Scapozza L. (2004) Thermodynamics of protein-ligand interactions: history, presence, and future aspects. J. Recept. Signal Transduct. Res. 24, 1–52 [DOI] [PubMed] [Google Scholar]
- 22. Gómez J., Hilser V. J., Xie D., Freire E. (1995) The heat capacity of proteins. Proteins 22, 404–412 [DOI] [PubMed] [Google Scholar]
- 23. Spolar R. S., Livingstone J. R., Record M. T., Jr. (1992) Use of liquid hydrocarbon and amide transfer data to estimate contributions to thermodynamic functions of protein folding from the removal of nonpolar and polar surface from water. Biochemistry 31, 3947–3955 [DOI] [PubMed] [Google Scholar]
- 24. Murphy K. P., Bhakuni V., Xie D., Freire E. (1992) Molecular basis of cooperativity in protein folding. III. Structural identification of cooperative folding units and folding intermediates. J. Mol. Biol. 227, 293–306 [DOI] [PubMed] [Google Scholar]
- 25. Murphy K. P., Freire E. (1992) Thermodynamics of structural stability and cooperative folding behavior in proteins. Adv. Protein Chem. 43, 313–361 [DOI] [PubMed] [Google Scholar]
- 26. Samanta U., Bahadur R. P., Chakrabarti P. (2002) Quantifying the accessible surface area of protein residues in their local environment. Protein Eng. 15, 659–667 [DOI] [PubMed] [Google Scholar]
- 27. Baldwin R. L. (1986) Temperature dependence of the hydrophobic interaction in protein folding. Proc. Natl. Acad. Sci. U.S.A. 83, 8069–8072 [DOI] [PMC free article] [PubMed] [Google Scholar]
- 28. Kauzmann W. (1959) Some factors in the interpretation of protein denaturation. Adv. Protein Chem. 14, 1–63 [DOI] [PubMed] [Google Scholar]
- 29. Murphy K. P., Xie D., Thompson K. S., Amzel L. M., Freire E. (1994) Entropy in biological binding processes: estimation of translational entropy loss. Proteins 18, 63–67 [DOI] [PubMed] [Google Scholar]
- 30. Roll-Mecak A., Cao C., Dever T. E., Burley S. K. (2000) X-ray structures of the universal translation initiation factor IF2/eIF5B: conformational changes on GDP and GTP binding. Cell 103, 781–792 [DOI] [PubMed] [Google Scholar]
- 31. AEvarsson A., Brazhnikov E., Garber M., Zheltonosova J., Chirgadze Y., al-Karadaghi S., Svensson L. A., Liljas A. (1994) Three-dimensional structure of the ribosomal translocase: elongation factor G from Thermus thermophilus. EMBO J. 13, 3669–3677 [DOI] [PMC free article] [PubMed] [Google Scholar]
- 32. Czworkowski J., Wang J., Steitz T. A., Moore P. B. (1994) The crystal structure of elongation factor G complexed with GDP, at 2.7 Å resolution. EMBO J. 13, 3661–3668 [DOI] [PMC free article] [PubMed] [Google Scholar]
- 33. Hansson S., Singh R., Gudkov A. T., Liljas A., Logan D. T. (2005) Crystal structure of a mutant elongation factor G trapped with a GTP analog. FEBS Lett. 579, 4492–4497 [DOI] [PubMed] [Google Scholar]
- 34. Hauryliuk V., Mitkevich V. A., Draycheva A., Tankov S., Shyp V., Ermakov A., Kulikova A. A., Makarov A. A., Ehrenberg M. (2009) Thermodynamics of GTP and GDP binding to bacterial initiation factor 2 suggests two types of structural transitions. J. Mol. Biol. 394, 621–626 [DOI] [PubMed] [Google Scholar]
- 35. Hauryliuk V., Mitkevich V. A., Eliseeva N. A., Petrushanko I. Y., Ehrenberg M., Makarov A. A. (2008) The pretranslocation ribosome is targeted by GTP-bound EF-G in partially activated form. Proc. Natl. Acad. Sci. U.S.A. 105, 15678–15683 [DOI] [PMC free article] [PubMed] [Google Scholar]
- 36. Hilgenfeld R. (1995) Regulatory GTPases. Curr. Opin. Struct. Biol. 5, 810–817 [DOI] [PubMed] [Google Scholar]