

Abstract
Affymetrix GeneChip microarrays are the most widely used high-throughput technology to measure gene expression, and a wide variety of preprocessing methods have been developed to transform probe intensities reported by a microarray scanner into gene expression estimates. There have been numerous comparisons of these preprocessing methods, focusing on the most common analyses—detection of differential expression and gene or sample clustering. Recently, more complex multivariate analyses, such as gene co-expression, differential co-expression, gene set analysis and network modeling, are becoming more common; however, the same preprocessing methods are typically applied. In this article, we examine the effect of preprocessing methods on some of these multivariate analyses and provide guidance to the user as to which methods are most appropriate.
Keywords: microarray, preprocessing, gene expression, multivariate analysis
INTRODUCTION
Whereas newer technologies such as exon microarrays and second-generation RNA sequencing promise to be the primary tools to measure gene expression in the future, Affymetrix GeneChip microarrays are currently the most common. Between 1 June 2010 and 1 June 2011, over 13 000 Affymetrix Human Genome U133 Plus 2.0 samples were added to the Gene Expression Omnibus (GEO) [1]. During the same time period, less than 2000 Human Gene 1.0 ST samples were added. There are currently over 53 000 Human Genome U133 Plus 2.0 samples, over 27 000 Human Genome U133A samples and over 22 000 Mouse Genome 430 2.0 samples available on GEO. This plethora of publicly available data is being used to perform larger and more complex analyses [2, 3]; therefore, it is important to determine the appropriate preprocessing algorithm(s) for such analyses.
Microarray preprocessing is arguably the most pivotal step in the analysis of microarray data. Preprocessing methods seek to address background noise, processing effects, between array variation and probe to gene summarization. Errors introduced at this stage are retained throughout the ensuing analysis and can greatly affect the conclusions of a study. As such, many preprocessing methods have been developed by the statistical community [4–7], in addition to the methods provided by Affymetrix. Furthermore, there have been numerous articles comparing preprocessing algorithms, with the majority focusing on the most common application—detection of differential expression [8–12]. Recently, researchers have begun to move away from relatively simple analyses, such as differential expression and clustering and toward more complex multivariate analyses, such as gene co-expression [13], gene set analysis [14] and estimation of gene regulatory networks [15]. Here, we examine the performance of the most common preprocessing methods when applied to multivariate analyses.
In this article, we begin by describing the bias and precision seen in several common preprocessing algorithms. Next, we examine previous assessments of the effect of preprocessing algorithms on more complex downstream analyses. These studies focused primarily on estimation of between-gene correlations and produced contradictory conclusions. We provide a more principled and thorough assessment of between-gene correlations and then turn our attention to more complex analyses.
BIAS AND PRECISION OF PREPROCESSING ALGORITHMS
The signal detect curve
The ‘signal detect slope’, the regression slope of expression estimates versus nominal concentration on the log2 scale, is one of the fundamental tools for assessing bias in differential expression [16]. The ideal slope is one indicating that the observed expression doubles when the nominal concentration doubles. More recently, it was shown that computing the signal detect slope separately for low, medium and high nominal concentrations provides a more informative assessment because typically the slope is not constant throughout the range of nominal concentrations [17]. However, many preprocessing algorithms seek, either explicitly or implicitly, to generate a constant slope across nominal concentrations. To assess this, we define the ‘signal detect curve’ to be a monotone function representing the relationship between observed expression and nominal concentration on the log2 scale.
Whereas the signal detect slope provides a measure of bias for differential expression, the nonlinearity of the signal detect curve provides a measure of bias for statistics that are invariant under linear transformations but which are affected by nonlinear transformations, for example, correlation coefficients. To assess the nonlinearity of the relationship between observed expression and nominal concentration, we compute the sum of squared deviations between the fitted values from the signal detect curve and the closest line:
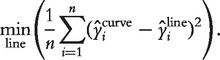 |
To compare nonlinearity across preprocessing methods, which produce expression values on different scales, we standardize by dividing by the range of the fitted values.
A probe set-specific assessment of bias and precision
Previously, signal detect slopes have been computed using all spike-in probe sets; however, this ignores differences in behavior between probe sets that can be substantial (Figure 1). Unlike differences between probe sets, there is relatively little variability between technical replicates of the same probe set, with the exception of preprocessing methods that subtract mismatch probes (MMs)—these show greatly increased variability at low nominal concentrations (Figure 1). In other words, expression estimates differ more between probe sets with the same spike in nominal concentration on a single array than between the same probe set on different arrays. This suggests that the signal detect curves are determined primarily by properties of the probes and/or target transcripts and that while these curves can be altered by various preprocessing methods, no method yields the same curve for all probe sets. By examining the signal detect curves, we notice that preprocessing algorithms that ignore mismatch data, retain the sigmoidal relationship between observed expression and nominal concentrations seen in the raw data. Methods that subtract mismatch intensities attempt to remove the lower asymptote, but in doing so, decrease precision.
Figure 1:

Plots of the signal detect curves for five probe sets (listed at bottom right) from the Affymetrix HGU133a spike-in dataset using nine different preprocessing algorithms. Technical replicates within a nominal concentration are represented by solid circles. The solid black line shows the average signal detect curve across all probe sets for each preprocessing method.
In addition to nonlinearity, we also assess each preprocessing method based on precision. Specifically, we calculate the variance within each nominal concentration and report the average across nominal concentrations as a measure of precision. Similar to the signal detect curves, the within-array between-probe set variance is much greater than the between-array within-probe set variance.
Because the signal-detect curves vary substantially across probe sets and we only have data on their behavior for a small fraction of probe sets (those spiked in), it is not feasible to propose a probe set-specific adjustment to straighten the signal detect curves. Nonetheless, it is advantageous to assess probe sets individually and summarize the performance of each preprocessing algorithm by reporting an estimate of the average accuracy and precision along with estimates of the variability in accuracy and precision seen across probe sets.
The bias/precision trade-off
For the nine preprocessing methods considered, we observed the typical trade-off between bias and precision (Table 1); however, frozen Robust Multi-array Analysis (fRMA) appears to be an exception to this trend—it has better accuracy than one would expect, given its precision. It should also be noted that the two algorithms proposed by Affymetrix—MAS5.0 and Probe Logarithmic Intensity Error (PLIER)—in addition to having the worst precision, show far greater variability in precision than any of the other algorithms. This can be explained by the fact that for some probe sets both of these algorithms appear to fail at low nominal concentrations, evidenced by large variability between technical replicates for some probe sets (Figure 1).
Table 1:
Assessment of accuracy and precision based on the Affymetrix HGU133A spike-in data
| Precision | Accuracy | |
|---|---|---|
| Within-replicate variance, mean (SD) | Non-linearity, mean (SD) | |
| MBEI—no MM | 0.030 (0.020) | 9.102 (2.416) |
| PLIER—no MM | 0.068 (0.057) | 9.895 (2.787) |
| RMA—no BG | 0.093 (0.062) | 9.713 (2.372) |
| fRMA—default | 0.097 (0.071) | 6.954 (2.558) |
| RMA—default | 0.148 (0.072) | 7.401 (2.909) |
| MBEI—default | 0.181 (0.121) | 5.664 (3.058) |
| GCRMA—default | 0.251 (0.170) | 5.647 (3.150) |
| MAS5.0—default | 0.991 (0.993) | 4.423 (2.924) |
| PLIER—default | 1.849 (3.155) | 4.809 (3.307) |
For each probe set, the within-replicate variance averaged across nominal concentrations is used as a measure of precision, and the nonlinearity of the signal detect curve is used as a measure of accuracy. The mean and SD across probe sets is reported for each preprocessing algorithm.
Note: MM, mismatch; BG, background correction.
THE EFFECT OF PREPROCESSING ON BETWEEN-GENE CORRELATION
Previous work
Harr et al. [18] examined four popular Affymetrix preprocessing methods—MAS 5.0, Robust Multi-array Average (RMA) [4], Model-based Expression Index (MBEI) [5] and GC Robust Multi-array Average (GCRMA) [6]. They investigated detection of positive between-gene correlation using pairs of genes from the same Escherichia coli operon (assumed to be positively correlated). They concluded that, among the four preprocessing algorithms, MBEI resulted in the highest Spearman rank correlation coefficient and RMA the lowest. They also investigated nonstandard preprocessing algorithms by combining the background-correction, normalization and summarization methods from each of the studied preprocessing algorithms, finding that a combination of MAS5.0 and MBEI (MAS5.0 background correction and PM/MM correction and MBEI normalization and summarization) performed best [18].
Lim et al.[19] examined the same four preprocessing methods. They investigated between-gene correlations in several ways that significantly expanded upon the results reported in Harr et al. [18]. They examined all pairwise correlations between probe sets for a data set of 254 Affymetrix arrays from a human Burkitt's lymphoma cell line. They assessed the fit of a relevance network based on these correlations, agreement with Gene Ontology (GO) biological process annotation and agreement with known protein interactions. Based on these assessments, they concluded that MAS5.0 and GCRMA performed best [19].
Obayashi et al. [20] examined nearly the same four preprocessing methods, substituting PLIER for MBEI. They assessed the ability of correlation coefficients to predict GO annotations in four species—Human, Rat, Mouse and Arabidopsis. Using Pearson's correlation coefficient, they determined that RMA performed best for Arabidopsis, Rat and Mouse, and MAS5.0 performed best in Human. The authors also proposed two alternatives to Pearson's correlation coefficient, both of which showed greater ability to predict GO annotation. These two alternatives were the rank of the correlation coefficient and the mutual rank of the correlation coefficient. The former is defined as the rank of the correlation of gene A with gene B relative to the correlations of gene A with all other genes. The latter is defined as the geometric mean of the rank of gene A with gene B and gene B with gene A. Using the mutual ranks, RMA performed best for all species [20].
A spike-in assessment
The assessments reported in the previous section used known operons, GO annotations and known protein interactions to determine genes that are assumed to be positively correlated. While such assessments shed light on the relative performance of preprocessing methods, they ignore a more fundamental question, ‘What are the bias and precision of correlation coefficient estimates using each preprocessing method?’ We address this question directly using the Affymetrix Human Genome U133A Spike-in Experiment. This data set has been extensively used to evaluate the gene expression estimates produced by preprocessing algorithms [4, 6–10, 16, 17]. In addition to the preprocessing methods assessed in the previous work, we also assessed fRMA [7] and a few common varations on the other preprocessing methods.
In the Affymetrix spike-in data set, any pair of spike-in probe sets with the same nominal concentrations across the 42 arrays has a nominal correlation of one. Therefore, to assess the ability of each preprocessing method to estimate a between-gene correlation of one, we examined the correlation estimates for all of the spike-in probe set pairs with a nominal correlation of one (Figure 2). PLIER, MAS5.0 and, to some extent, GCRMA performed noticeably worse than the other preprocessing methods. In fact, PLIER and MAS5.0 performed worse than correlations based on the unpreprocessed probe-level data. Furthermore, while the majority of preprocessing methods yielded comparable precision, GCRMA, MAS5.0 and PLIER resulted in a much larger interquartile range (IQR) than the other preprocessing methods. In fact, PLIER resulted in a larger IQR than the raw probe-level data (Figure 2). This suggests that in addition to showing the largest bias, these methods also produce the least precise estimates.
Figure 2:

Boxplots of the observed between-gene (or between-probe in the case of the raw probe-level estimates) correlations when the nominal correlation is one.
If we examine the probe set pairs with the lowest correlation estimates for PLIER and GCRMA, we see that the observed bias is explained by our proposed probe set-specific measures of bias and precision (Figure 3). Specifically, a large between-replicate variance at low nominal concentrations explains the bias for PLIER and severe nonlinearity of the signal detect curve explains the bias for GCRMA. This demonstrates that both lack of precision and nonlinearity can detrimentally affect downstream analyses.
Figure 3:

The signal-detect curves for the probe set pair that produced the lowest correlation estimate for a nominal correlation of one when preprocessing the data using: (A) GCRMA and (B) PLIER. Technical replicates within a nominal concentration are represented by solid circles. The solid black line shows the average signal detect curve across all probe sets for each preprocessing method.
At least as important as estimation of a true positive correlation is accurate estimation of a true null correlation. To this end, we considered four negative control probe sets present on all Affymetrix HGU133A microarrays (AFFX-DapX-3_at, AFFX-LysX-3_at, AFFX-PheX-3_at, AFFX-ThrX-3_at). Because these probe sets are expected to be unexpressed on every array, the nominal correlation between each of the control probe sets and any other probe set on the array is zero. We assess the ability of each preprocessing method to estimate a correlation of zero in two situations: (i) across arrays to which biological replicates were hybridized (23 normal kidney samples from GSE15641) [21] and (ii) across arrays to which different normal tissue samples were hybridized (36 samples from GSE2361) [22]. The former assesses the ability to estimate a correlation of zero when the variance in expression of the noncontrol probe set is relatively small; the latter assesses the ability to estimate a correlation of zero when the variance in expression of the noncontrol probe set is relatively large.
Boxplots of the observed correlations for both assessments can be seen in Figure 4. In addition to the preprocessing methods, we also included the correlation estimates between the negative control probes and each probe on the array without any preprocessing. As expected, since there was no attempt at normalization, we see a large positive bias in the raw probe level correlations. However, the estimates generated by each of the preprocessing methods show a smaller, but still noticeable bias in observed correlations. Specifically, PLIER and GCRMA show a negative bias in both assessments, and the other preprocessing methods show a positive bias. This bias is relatively small for GCRMA, MAS5.0 and fRMA in both assessments and for MBEI and PLIER in the second assessment. In general, biases are smaller in the second assessment where the variance in expression of the noncontrol genes is expected to be greater. With regard to precision, GCRMA is by far the best with MAS5.0 and fRMA performing reasonably well across both assessments and PLIER and MBEI performing fairly well in the second assessment. Based on the assessment of precision and linearity (Table 1) and the results shown in Figures 2 and 4, it appears that poor precision results in underestimation of a true positive correlation, whereas nonlinearity results in overestimation when the true correlation is zero.
Figure 4:

Boxplots of the observed between-gene (or between-probe in the case of the raw probe-level estimates) correlations when the expected correlation is zero. Correlations were computed between each of four control probe sets and all other probe sets on the array using data from: (A) 23 normal kidney samples from GSE15461 or (B) 36 different normal tissue samples from GSE2631.
GENE SET AND NETWORK ANALYSES BASED ON AN EXPERIMENTAL COMPENDIUM
Whereas spike-in data allow one to assess bias and precision directly, they have been criticized for not accurately reproducing the biological variability seen in real experimental data. To address this concern, we created a compendium of 30 publicly available Affymetrix HGU133A and HGU133Plus2 data sets. The data sets selected consist of two sample types (primarily disease and normal) from distinct human subjects. A list of the experiments used can be found in Table 2.
Table 2:
A list of the 30 publicly available data sets used to create the experimental compendium including the GEO experiment ID, microarray platform, tissue and number of samples
| GEO ID | Platform | No. of samples | Tissue |
|---|---|---|---|
| GSE2443 | U133A | 20 | Prostate |
| GSE3585 | U133A | 12 | Heart |
| GSE4107 | U133Plus2 | 22 | Colonic mucosa |
| GSE4488 | U133Plus2 | 16 | Whole blood |
| GSE5090 | U133A | 17 | Omental adipose tissue |
| GSE5389 | U133A | 21 | Orbitofrontal cortex |
| GSE5390 | U133A | 15 | Dorsolateral prefrontal cortex |
| GSE5563 | U133Plus2 | 19 | Vulva |
| GSE6236 | U133A | 28 | Reticulocytes |
| GSE6364 | U133Plus2 | 37 | Endometrium |
| GSE6613 | U133A | 105 | Whole blood |
| GSE6872 | U133Plus2 | 21 | Semen |
| GSE7148 | U133A | 14 | Peripheral blood leukocytes |
| GSE7305 | U133Plus2 | 20 | Endometrium |
| GSE7893 | U133A | 21 | Peripheral blood CD14+ leukocytes |
| GSE8514 | U133Plus2 | 15 | Adrenal gland |
| GSE8581 | U133Plus2 | 58 | Lung |
| GSE8823 | U133Plus2 | 24 | Alveolar macrophages |
| GSE10161 | U133A | 27 | Heart |
| GSE10245 | U133Plus2 | 58 | Nonsmall cell lung cancer |
| GSE11524 | U133Plus2 | 30 | Platelet |
| GSE14001 | U133Plus2 | 23 | Ovary |
| GSE14671 | U133Plus2 | 59 | CD34+ cells |
| GSE14905 | U133Plus2 | 82 | Skin |
| GSE16155 | U133Plus2 | 19 | Ependymoma |
| GSE16538 | U133Plus2 | 12 | Lung |
| GSE17639 | U133Plus2 | 12 | Reticulocytes |
| GSE18781 | U133Plus2 | 55 | Peripheral blood |
| GSE22688 | U133A | 38 | Blood outgrowth endothelial cells |
| GSE20504 | U133Plus2 | 10 | Umbilical cord blood-derived Endothelial colony forming cells |
Whereas this experimental compendium cannot be used to assess the bias and precision of preprocessing methods directly, it can be used to investigate the relationships between preprocessing methods and to assess their relative performance. One can determine which methods are the most and least conservative and which have the greatest agreement with other methods. We examine these features in the context of gene set analysis (GSA). This is a method of gene selection which detects differences in gene expression patterns among predefined gene sets, rather than single genes. The set definitions are based on criteria such as functional pathway membership and chromosomal proximity and results based on gene sets typically show greater reproducibility [14]. Here, we consider two types of GSA based on distinct hypothesis tests—the equality of Bayesian network models [23] and a compound t-statistic [24]—both applied to a curated list of 522 gene sets obtained from the Broad Institute [14]. The compound t-statistic tests for a difference in average expression between gene sets, while the maximum likelihood test for the equality of Bayesian network models is motivated by the observation that phenotypic effects on gene expression may take the form of differential co-expression. For further details of these methods, we refer the reader to the original manuscripts.
Because GCRMA uses a shrinkage estimator, which means a given gene may have identical gene expression estimates on multiple arrays, any methodology which relies on variance estimates may be negatively affected. The problem is compounded when permutation tests are used, particularly when the number of constant values is large enough that among several thousand replications the probability that one will contain a sample of constant values is significantly greater than zero. To include GCRMA in this assessment, we filtered genes whose expression estimates consisted of >25% repeats.
To assess how conservative each preprocessing algorithm is, we calculated the prevalence within each data set as the number of gene sets with an adjusted P-value less than a specified threshold false discovery rate (FDR) estimated by the Benjamini–Hochberg procedure):  = {no. of adjusted P-values
  for data set i, method j}. The average rank of the prevalence scores (a lower rank corresponds to a larger number of gene sets called differentially expressed) across the compendium of data sets provides an assessment of which preprocessing methods are the least conservative (Table 3). Custom versions of PLIER and MBEI (ignoring mismatch probes) appear to have the highest prevalence with fRMA joining the top tier in the Bayesian network analysis. GCRMA, MAS5.0 and PLIER (default) have the lowest prevalence for all FDR thresholds in both analyses, meaning that they are the most conservative.
Table 3:
Assessment of prevalence for each preprocessing method based on the compendium of 30 experiments
|
t2-statistic |
Bayesian network |
|||||
|---|---|---|---|---|---|---|
| FDR | 0.01 | 0.05 | 0.25 | 0.01 | 0.05 | 0.25 |
| PLIER—no MM | 4.03 | 3.83 | 3.48 | 3.95 | 3.23 | 2.72 |
| MBEI—no MM | 4.08 | 3.78 | 3.52 | 4.23 | 3.53 | 3.35 |
| fRMA—default | 4.53 | 4.63 | 4.43 | 4.00 | 3.93 | 3.70 |
| RMA—default | 4.92 | 4.60 | 4.73 | 4.92 | 5.05 | 4.55 |
| RMA—no BG | 5.22 | 5.00 | 4.65 | 4.82 | 5.13 | 4.42 |
| MBEI—default | 4.63 | 4.77 | 4.48 | 5.03 | 5.02 | 5.62 |
| PLIER—default | 5.37 | 5.23 | 4.93 | 6.12 | 6.67 | 6.82 |
| GCRMA—default | 5.83 | 6.50 | 7.50 | 5.57 | 5.62 | 6.87 |
| MAS5.0—default | 6.38 | 6.65 | 7.27 | 6.37 | 6.82 | 6.97 |
| CDF of highest ranked method | ||||||
| P(rank ≤ 1) | 0.46 | 0.52 | 0.48 | 0.48 | 0.67 | 0.93 |
| P(rank ≤ 2) | 0.83 | 0.89 | 0.93 | 0.78 | 0.97 | 1.00 |
| P(rank ≤ 3) | 0.94 | 0.96 | 0.98 | 0.99 | 1.00 | 1.00 |
| P(rank ≤ 4) | 0.99 | 0.99 | 1.00 | 1.00 | 1.00 | 1.00 |
| P(rank ≤ 5) | 1.00 | 1.00 | 1.00 | 1.00 | 1.00 | 1.00 |
The upper portion of the table shows the average rank of the prevalence scores across the compendium of datasets. A lower rank corresponds to a larger number of gene sets called differentially expressed. The lower portion of the table displays the CDF of the highest ranked method, providing an assessment of our confidence in the highest ranking. Note: MM, mismatch; BG, background correction
To assess agreement between algorithms, we computed the concordance between preprocessing methods with respect to those gene sets determined to differ significantly. We calculated two measures of concordance based on: (i) the Spearman rank correlation of adjusted P-values between two preprocessing methods and (ii) the ability of a given preprocessing method to detect gene sets called expressed by other methods. Specifically, suppose  is an N × M matrix of adjusted P-values such that
  is the P-value associated with gene-set i and preprocessing method j. Let Ejα be the set of gene sets i for which
  calculated using preprocessing method j. Then define an M × M matrix Aα with elements.
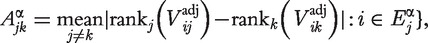
This relationship measure represents the ability of preprocessing method k to detect significant gene sets detected by method j, and so is asymmetric. Computing the average across all preprocessing methods allows one to assess the ability of a given preprocessing method to call differentially expressed those gene sets called differentially expressed using other preprocessing methods.
The first metric can be used to determine which preprocessing methods provide similar results by examining the matrix of pairwise correlations averaged across the compendium of datasets (Table 4). As one would expect, the two versions of RMA produce similar results; however, the two versions of PLIER and MBEI do not produce highly similar results. This suggests that RMA background correction, which does not use mismatch data, has a lesser effect on the results than the potential use of mismatch data in PLIER and MBEI. Furthermore, GCRMA (which differs from RMA only in the background correction step) does not produce results similar to either version of RMA, providing additional evidence that whereas RMA background correction has a relatively small effect on the results, alternative background correction methods can have a substantial effect. The second metric can identify preprocessing methods that call differentially expressed a sizeable number of gene sets called differentially expressed by other methods. Similar to Table 3, we report the average rank across the compendium of datasets (Table 5). The two versions of RMA and the custom version of PLIER appear to have the greatest concordance; however, this could be due to the high similarity between the two versions of RMA seen in Table 4. To address this, we recomputed the second concordance metric using only one version of each preprocessing algorithm. The results were similar to those seen in Table 5 with the only major difference being that the custom version of PLIER showed the greatest concordance with RMA coming in second.
Table 4:
The average correlation between preprocessing methods across the compendium of 30 experiments
| fRMA— default | GCRMA— default | MBEI— no MM | MBEI— default | MAS5.0— default | PLIER— no MM | PLIER— default | RMA— default | RMA— no BG | |
|---|---|---|---|---|---|---|---|---|---|
| t2-statistic | |||||||||
| fRMA—default | 1.00 | 0.60 | 0.63 | 0.62 | 0.61 | 0.78 | 0.61 | 0.77 | 0.77 |
| GCRMA—default | 0.60 | 1.00 | 0.54 | 0.59 | 0.59 | 0.61 | 0.57 | 0.63 | 0.62 |
| MBEI—no MM | 0.63 | 0.54 | 1.00 | 0.67 | 0.50 | 0.68 | 0.57 | 0.66 | 0.66 |
| MBEI—default | 0.62 | 0.59 | 0.67 | 1.00 | 0.59 | 0.64 | 0.64 | 0.64 | 0.64 |
| MAS5.0—default | 0.61 | 0.59 | 0.50 | 0.59 | 1.00 | 0.59 | 0.53 | 0.60 | 0.60 |
| PLIER—no MM | 0.78 | 0.61 | 0.68 | 0.64 | 0.59 | 1.00 | 0.63 | 0.87 | 0.88 |
| PLIER—default | 0.61 | 0.57 | 0.57 | 0.64 | 0.53 | 0.63 | 1.00 | 0.62 | 0.62 |
| RMA—default | 0.77 | 0.63 | 0.66 | 0.64 | 0.60 | 0.87 | 0.62 | 1.00 | 0.93 |
| RMA—no BG | 0.77 | 0.62 | 0.66 | 0.64 | 0.60 | 0.88 | 0.62 | 0.93 | 1.00 |
| Bayesian network | |||||||||
| fRMA—default | 1.00 | 0.49 | 0.47 | 0.47 | 0.42 | 0.64 | 0.33 | 0.61 | 0.60 |
| GCRMA—default | 0.49 | 1.00 | 0.41 | 0.46 | 0.42 | 0.50 | 0.35 | 0.52 | 0.51 |
| MBEI—no MM | 0.47 | 0.41 | 1.00 | 0.52 | 0.36 | 0.52 | 0.31 | 0.49 | 0.49 |
| MBEI—default | 0.47 | 0.46 | 0.52 | 1.00 | 0.41 | 0.47 | 0.37 | 0.47 | 0.47 |
| MAS5.0—default | 0.42 | 0.42 | 0.36 | 0.41 | 1.00 | 0.42 | 0.32 | 0.42 | 0.42 |
| PLIER—no MM | 0.64 | 0.50 | 0.52 | 0.47 | 0.42 | 1.00 | 0.34 | 0.74 | 0.77 |
| PLIER—default | 0.33 | 0.35 | 0.31 | 0.37 | 0.32 | 0.34 | 1.00 | 0.34 | 0.33 |
| RMA—default | 0.61 | 0.52 | 0.49 | 0.47 | 0.42 | 0.74 | 0.34 | 1.00 | 0.86 |
| RMA—no BG | 0.60 | 0.51 | 0.49 | 0.47 | 0.42 | 0.77 | 0.33 | 0.86 | 1.00 |
Spearman rank correlation coefficients are computed using P-values from either a t2-statistic or a test of the equivalence of Bayesian networks. The upper table is based on Pairwise Spearman rank correlation coefficients of P-values (GSA methods based on t-statistic and Bayesian network equivalent test) were calculated for each data set, and preprocessing pair. The maximum standard error among entries is 0.037.
Note: MM, mismatch; BG, background correction.
Table 5:
Assessment of concordance for each preprocessing method based on the compendium of 30 experiments
|
t2-statistic |
Bayesian network |
|||||
|---|---|---|---|---|---|---|
| FDR | 0.01 | 0.05 | 0.25 | 0.01 | 0.05 | 0.25 |
| RMA—default | 2.73 | 2.60 | 2.57 | 3.40 | 3.00 | 2.47 |
| RMA—no BG | 3.13 | 2.80 | 2.53 | 3.50 | 2.83 | 2.33 |
| PLIER—no MM | 3.50 | 3.23 | 3.03 | 3.47 | 2.70 | 2.80 |
| fRMA—default | 4.53 | 4.23 | 4.03 | 4.27 | 4.03 | 3.93 |
| MBEI—default | 5.47 | 5.70 | 5.73 | 5.37 | 5.47 | 6.00 |
| MBEI—no MM | 5.90 | 5.93 | 6.37 | 5.43 | 5.73 | 5.77 |
| GCRMA—default | 6.47 | 6.80 | 6.87 | 6.03 | 6.33 | 6.13 |
| PLIER—default | 5.87 | 6.10 | 6.27 | 6.90 | 7.67 | 8.30 |
| MAS5.0—default | 7.40 | 7.60 | 7.60 | 6.63 | 7.23 | 7.27 |
| CDF of highest ranked method | ||||||
| P(rank ≤ 1) | 0.96 | 0.76 | 0.50 | 0.49 | 0.60 | 0.66 |
| P(rank ≤ 2) | 1.00 | 1.00 | 0.95 | 0.77 | 0.85 | 0.97 |
| P(rank ≤ 3) | 1.00 | 1.00 | 1.00 | 1.00 | 1.00 | 1.00 |
The upper portion of the table shows the average rank of the concordance scores across the compendium of data sets. A lower rank corresponds to a larger number of gene sets called differentially expressed using other preprocessing methods also being called differentially expressed using the given preprocessing method. The lower portion of the table displays the CDF of the highest ranked method, providing an assessment of our confidence in the highest ranking. Note: MM, mismatch; BG, background correction.
Finally, to assess our level of confidence in the ranks reported in Tables 3 and 5, we use a bootstrap procedure. Specifically, we generate K simulated ranking matrices  , … ,
, … ,  , based on the prevalence and concordance test statistics previously described, each obtained by randomly resampling N data sets with replacement from the compendium of 30 data sets. For each
  , a summary vector
  of the column averages is constructed. We then define the probabilistic summary
  as the proportion of bootstrapped summary vectors
  in which preprocessing method j ranked at least r. Thus,
  is interpretable as the confidence level for the inference statement that method j is the most favored with respect to a given metric. The procedure assumes independence across data sets, but permits statistical dependence between preprocessing methods, which must be anticipated.
The cumulative distribution function (CDF) for the highest ranked preprocessing method for each metric and FDR threshold can be seen in the lower half of Tables 3 and 5. Regarding prevalence, we are quite confident that the highest ranked method is in the top three for all FDR thresholds and both methods of analysis. For Bayesian network analysis and FDR thresholds of 0.05 and 0.25, we are quite confident that the highest ranked method is in the top two. With regard to concordance, we are even more confident in the highest ranked method. We can be nearly certain that the highest ranked method is in the top three and in general, quite confident that it is in the top two, the only exception being the Bayesian network analysis with an FDR threshold of 0.01.
CONCLUSION
We have described the performance of commonly used preprocessing algorithms focusing on several multivariate analyses. We began by assessing the effect of preprocessing on one of the simplest and most fundamental multivariate statistics—the correlation coefficient. In addition to inferences based solely on correlation between genes, estimates of between-gene correlation are used in differential co-expression and some network modeling algorithms. Whereas previous studies used various surrogates for positive correlation, such as known operons, GO annotations and known protein interactions, the use of spike-in data allows one to assess the bias and precision of preprocessing methods directly. Furthermore, we have shown that examination of the signal-detect curves and simple measures of bias and precision based on spike-in data can shed light on errors that manifest themselves in more complex analyses. Finally, we have compiled an experimental compendium of 30 curated data sets that allow us to assess the relative performance of preprocessing methods with regard to prevalence and concordance.
Based on our assessments, we conclude that preprocessing methods that attempt to straighten the signal detect curve, such as MAS5.0 and PLIER (default), sacrifice precision in doing so. Moreover, this lack of precision leads to a large bias when computing correlation coefficients between probe sets when the nominal correlation is one. Conversely, by using a shrinkage estimator, GCRMA further increases the nonlinearity of the signal-detect curve that also results in a large bias. However, it should be noted that GCRMA performed best when estimating a true zero correlation—it had very small bias and variance. It appears that methods that strike a balance between the bias and precision of the signal detect curves, such as fRMA, have consistently small bias and variance when computing correlation coefficients between probe sets with a nominal correlation of either one or zero. While some preprocessing methods did perform better than others, it is reassuring that nearly all the preprocessing methods yielded better results than those based on the unpreprocessed probe-level data—the exceptions being MAS5.0 and PLIER (default) for a nominal correlation of one.
These conclusions are further supported by our assessment of prevalence and concordance. MAS5.0 and PLIER (default) were consistently more conservative and showed lower concordance than the other preprocessing methods. It is possible that higher prevalence and greater concordance does not imply better performance. Higher prevalence can be achieved by increasing the number of false positives, as well as by increasing the number of true positives, and if the majority of preprocessing methods are making the same errors, they would show higher concordance. However, given the lack of precision of both MAS5.0 and PLIER (default) and the fact that one expects a sizeable number of differentially expressed gene sets in each data set, it is fair to assume that their low prevalence is due primarily to a lower number of true positives—decreased precision would lead to decreased power to detect differentially expressed gene sets. This is further supported by the fact that preprocessing methods with higher prevalence also show greater concordance with each other. However, without knowing which gene sets are truly differentially expressed, one cannot definitively determine which preprocessing algorithms perform best.
As microarray data begins to be used for more complex multivariate analyses, it is important to revisit preprocessing methodology to determine its effect on subsequent analyses. While this review provides a first look at some of the more common multivariate analyses, there are numerous others whose results may be strongly affected by preprocessing.
Furthermore, as methods to assess gene expression evolve, it is necessary to carefully evaluate whether current preprocessing methods are still appropriate. For example, because the Affymetrix Human Gene 1.0 ST arrays contain probes designed to target the entire transcript (the Human Gene U133 arrays contained probes targeting primarily the 3′-end), alternative-splicing could lead to violations of the modeling assumptions underlying most current preprocessing algorithms. Specifically, most preprocessing algorithms assume that each probe within a probe set is measuring the same transcript and performs similarly across samples. However, this may not be the case if there are multiple splice variants of a given gene.
Key Points.
Using spike-in data to examine the signal detect curves and assess the bias and precision of preprocessing algorithms provide greater insight than previous assessments.
Preprocessing algorithms that strike a balance between bias and precision appear to yield the best results.
Preprocessing greatly improves estimation of correlation coefficients for nominal correlations of both zero and one.
MAS5.0 and PLIER (default) are the only two algorithms assessed that do not clearly outperform the unpreprocessed data.
Assessments of prevalence and concordance based on a large compendium of data sets can shed light on the behavior of and relationships between prepreocessing algorithms.
FUNDING
The National Institutes of Health (grants T32 CA009363 to M.N.M., R21HG004648-01 to A.A.); grants from the Sally Edelman–Harry Gardner Cancer Research Foundation.
Biographies
Matthew N McCall is a postdoctoral fellow in the department of Biostatistics and Computational Biology at the University of Rochester Medical Center. His research interests are in statistical genomics, bioinformatics and systems biology.
Anthony Almudevar is an associate professor in the department of Biostatistics and Computational Biology at the University of Rochester Medical Center. His research interests are in genetics and bioinformatics, especially in the area of graphical modeling with applications to cellular networks and population biology.
References
- 1.Edgar E, Domrachev M, Lash A. Gene Expression Omnibus: NCBI gene expression and hybridization array data repository. Nucleic Acids Res. 2002;30(1):207–10. doi: 10.1093/nar/30.1.207. [DOI] [PMC free article] [PubMed] [Google Scholar]
- 2.Kavak E, Unlu M, Nister M, et al. Meta-analysis of cancer gene expression signatures reveals new cancer genes, sag tags and tumor associated regions of co-regulation. Nucleic Acids Res. 2010;38(20):7008–21. doi: 10.1093/nar/gkq574. [DOI] [PMC free article] [PubMed] [Google Scholar]
- 3.Kapushesky M, Emam I, Holloway E, et al. Gene expression atlas at the european bioinformatics institute. Nucleic Acids Res. 2010;38(Database issue):D690–8. doi: 10.1093/nar/gkp936. [DOI] [PMC free article] [PubMed] [Google Scholar]
- 4.Irizarry R, Hobbs B, Collin F, et al. Exploration, normalization, and summaries of high density oligonucleotide array probe level data. Biostatistics 2003. 4(2):249–64. doi: 10.1093/biostatistics/4.2.249. [DOI] [PubMed] [Google Scholar]
- 5.Li C, Wong W. Model-based analysis of oligonucleotide arrays: expression index computation and outlier detection. Proc Natl Acad Sci USA. 2001;98(1):31–6. doi: 10.1073/pnas.011404098. [DOI] [PMC free article] [PubMed] [Google Scholar]
- 6.Wu Z, Irizarry R, Gentleman R, et al. A model-based background adjustment for oligonucleotide expression arrays. J Am Stat Assoc. 2004;99(468):909–17. [Google Scholar]
- 7.McCall M, Bolstad B, Irizarry R. Frozen robust multiarray analysis (fRMA) Biostatistics. 2010;11(2):242–53. doi: 10.1093/biostatistics/kxp059. [DOI] [PMC free article] [PubMed] [Google Scholar]
- 8.Bolstad B, Irizarry R, Astrand M, et al. A comparison of normalization methods for high density oligonucleotide array data based on variance and bias. Bioinformatics. 2003;19(2):185–93. doi: 10.1093/bioinformatics/19.2.185. [DOI] [PubMed] [Google Scholar]
- 9.Irizarry R, Bolstad B, Collin F, et al. Summaries of Affymetrix GeneChip probe level data. Nucleic Acids Res. 2003;31(4):e15. doi: 10.1093/nar/gng015. [DOI] [PMC free article] [PubMed] [Google Scholar]
- 10.Irizarry R, Wu Z, Jaffee H. Comparison of Affymetrix GeneChip expression measures. Bioinformatics. 2006;22(7):789–94. doi: 10.1093/bioinformatics/btk046. [DOI] [PubMed] [Google Scholar]
- 11.Shakya K, Ruskin H, Kerr G, et al. Comparison of microarray preprocessing methods. Adv Comput Biol. 2010;680(2):139–47. doi: 10.1007/978-1-4419-5913-3_16. [DOI] [PubMed] [Google Scholar]
- 12.Wu Z. A review of statistical methods for preprocessing oligonucleotide microarrays. Stat Methods Med Res. 2009;18(6):533–41. doi: 10.1177/0962280209351924. [DOI] [PMC free article] [PubMed] [Google Scholar]
- 13.Chen L, Zheng S. Studying alternative splicing regulatory networks through partial correlation analysis. Genome Biol. 2009;10(1):R3. doi: 10.1186/gb-2009-10-1-r3. [DOI] [PMC free article] [PubMed] [Google Scholar]
- 14.Subramanian A, Tamayo P, Mootha V, et al. Gene set enrichment analysis: a knowledge-based approach for interpreting genome-wide expression profiles. Proc Natl Acad Sci USA. 2005;102(43):15545–50. doi: 10.1073/pnas.0506580102. [DOI] [PMC free article] [PubMed] [Google Scholar]
- 15.Lin Y, Jhunjhunwala S, Benner C, et al. A global network of transcription factors, involving E2A, EBF1 and Foxo1, that orchestrates B cell fate. Nat Immunol. 2010;11(7):635–43. doi: 10.1038/ni.1891. [DOI] [PMC free article] [PubMed] [Google Scholar]
- 16.Cope L, Irizarry R, Jaffee H, et al. A benchmark for Affymetrix GeneChip expression measures. Bioinformatics. 2004;20(3):323–31. doi: 10.1093/bioinformatics/btg410. [DOI] [PubMed] [Google Scholar]
- 17.McCall M, Irizarry R. Consolidated strategy for the analysis of microarray spike-in data. Nucleic Acids Res. 2008;36(17):e108. doi: 10.1093/nar/gkn430. [DOI] [PMC free article] [PubMed] [Google Scholar]
- 18.Harr B, Schlotterer C. Comparison of algorithms for the analysis of Affymetrix microarray data as evaluated by co-expression of genes in known operons. Nucleic Acids Res. 2006;34(2):e8. doi: 10.1093/nar/gnj010. [DOI] [PMC free article] [PubMed] [Google Scholar]
- 19.Lim W, Wang K, Lefebvre C, et al. Comparative analysis of microarray normalization procedures: effects on reverse engineering gene networks. Bioinformatics. 2007;23(13):i282–8. doi: 10.1093/bioinformatics/btm201. [DOI] [PubMed] [Google Scholar]
- 20.Obayashi T, Kinoshita K. Rank of correlation coefficient as a comparable measure for biological significance of gene coexpression. DNA Res. 2009;16(5):249–60. doi: 10.1093/dnares/dsp016. [DOI] [PMC free article] [PubMed] [Google Scholar]
- 21.Jones J, Otu H, Spentzos D, et al. Gene signatures of progression and metastasis in renal cell cancer. Clin Cancer Res. 2005;11(16):5730–9. doi: 10.1158/1078-0432.CCR-04-2225. [DOI] [PubMed] [Google Scholar]
- 22.Ge X, Yamamoto S, Tsutsumi S, et al. Interpreting expression profiles of cancers by genome-wide survey of breadth of expression in normal tissues. Genomics. 2005;86(2):127–41. doi: 10.1016/j.ygeno.2005.04.008. [DOI] [PubMed] [Google Scholar]
- 23.Almudevar A. A hypothesis test for equality of Bayesian network models. EURASIP J Bioinform Syst Biol. 2010;2010:10. doi: 10.1155/2010/947564. [DOI] [PMC free article] [PubMed] [Google Scholar]
- 24.Irizarry R, Wang C, Zhou Y, et al. Gene Set Enrichment Analysis made simple. Working Paper no. 185, Department of Biostatistics, Johns Hopkins University, 2009. [DOI] [PMC free article] [PubMed] [Google Scholar]
- 25.Corton M, Botella-Carretero J, Benguria A, et al. Differential gene expression profile in omental adipose tissue in women with polycystic ovary syndrome. J Clin Endocrinol Metab. 2007;92(1):328–37. doi: 10.1210/jc.2006-1665. [DOI] [PubMed] [Google Scholar]