Abstract
Access to gene expression data has become increasingly common in recent years; however, analysis has become more difficult as it is often desirable to integrate data from different platforms. Probe mapping across microarray platforms is the first and most crucial step for data integration. In this article, we systematically review and compare different approaches to map probes across seven platforms from different vendors: U95A, U133A and U133 Plus 2.0 from Affymetrix, Inc.; HT-12 v1, HT-12v2 and HT-12v3 from Illumina, Inc.; and 4112A from Agilent, Inc. We use a unique data set, which contains 56 lung cancer cell line samples—each of which has been measured by two different microarray platforms—to evaluate the consistency of expression measurement across platforms using different approaches. Based on the evaluation from the empirical data set, the BLAST alignment of the probe sequences to a recent revision of the Transcriptome generated better results than using annotations provided by Vendors or from Bioconductor's Annotate package. However, a combination of all three methods (deemed the ‘Consensus Annotation’) yielded the most consistent expression measurement across platforms. To facilitate data integration across microarray platforms for the research community, we develop a user-friendly web-based tool, an API and an R package to map data across different microarray platforms from Affymetrix, Illumina and Agilent. Information on all three can be found at http://qbrc.swmed.edu/software/probemapper/.
Keywords: microarray, gene expression, probe, integrated analysis, probe mapping
INTRODUCTION
Microarray experiments provide powerful tools to measure genome-wide gene expression values, but individual studies often suffer from low power to detect genes with moderate biological effects due to small sample sizes and large measurement variability. With huge amounts of microarray data available in public databases, integrative analysis across studies can significantly increase power for biological discoveries and validation [1–3]. Probe mapping across different platforms poses a major challenge in integrative analysis—a simple cross-reference of the sequence identifiers across different studies rarely works well due to different probe designs in different microarray platforms [4–6].
The approaches to associate probes with Entrez Genes that will be reviewed in this article include: (i) Bioconductor's Annotate package; (ii) the vendor-provided annotation files; and (iii) A BLAST alignment of the probe sequences to a recent revision of the Transcriptome. We use a unique data set, which contains 56 lung cancer cell line samples—each of which has been measured on different microarray platforms—to evaluate the consistency across platforms for each gene. We also develop a user-friendly web-based tool, an API and an R package for mapping probes across the seven microarray platforms listed in Table 1.
Table 1:
Summary of the platforms contained in this study
| Full name | Probes | Abbreviated name | Vendor |
|---|---|---|---|
| BeadChip Human HT-12 v1 | 47 296 | ‘Illumina v1’ | Illumina, Inc. |
| BeadChip Human HT-12 v2 | 48 703 | ‘Illumina v2’ | Illumina, Inc. |
| BeadChip Human HT-12 v3 | 48 803 | ‘Illumina v3’ | Illumina, Inc. |
| Agilent Whole Human Genome Oligo-Microarray (44 K) | 41 000 | ‘4112A’ | Agilent, Inc. |
| GeneChip Human Genome U95A | 12 626 | ‘U95A’ | Affymetrix, Inc. |
| GeneChip Human Genome U133A | 22 283 | ‘U133A’ | Affymetrix, Inc. |
| GeneChip Human Genome U133 Plus 2.0 Array | 54 675 | ‘U133-Plus 2’ | Affymetrix, Inc. |
MATERIALS AND METHODS
Identifiers for data merging
In order to combine gene expression data from multiple vendors or platforms, there must be an established ‘common language’ between the platforms. There are many different options that could be used to this end; Genbank or RefSeq accession number, Unigene ID and Entrez ID are some of the most common.
Accession numbers are associated with specific transcripts (of which there may be multiple per gene). Mapping between platforms on something as specific as an accession number could produce an accurate result, as one can be confident that the probes are truly measuring the same entity; however, such an approach would be problematic as there would be many accession numbers for which probes only exist on one platform, greatly diminishing the ability to map between platforms. For this reason, we chose to map on the gene level. This allows us to be able to incorporate the information from many more probes, as it is much more likely to be able to find some probes associated with a gene for each platform than to find a probe associated with a specific accession number. Unigene and Entrez have different strengths and weaknesses. While Unigene IDs may incorporate more cutting-edge information, it is very dynamic and is constantly being revised. Entrez IDs, on the other hand, are very stable and have been well-curated. Thus, we can be more confident in the steadiness and reliability of the Entrez database.
Converting probes to Entrez identifiers
In the literature, there are three common approaches to map expression data from different platforms. The traditional method is to use the annotation files provided by the vendor; some vendors make efforts to keep these updated with current biological knowledge while others do not. Another commonly used method is Bioconductor's Annotate package that aggregates the information from various platform-specific Bioconductor packages. Finally, some researchers align probe sequences to a recent release of the Genome or Transcriptome in an attempt to obtain the most up-to-date results.
Vendor's annotation
Vendors release annotation files alongside their microarray platforms, which document their beliefs regarding each probe's associations at the time of release. Some early literature criticized the accuracy of these files [4, 5] as our knowledge of the Transcriptome is constantly growing. Many vendors release updated annotation files (with varying degrees of regularity) in an attempt to keep these annotations current. We used the most recently released annotation file for each platform we compare. Most modern annotation files contain, among other things, each probe's associated Entrez ID.
Bioconductor's annotate
Bioconductor is a free, open source project for the analysis and comprehension of genomic data based primarily on the R programming language. The Annotate package in Bioconductor provides probe-level information on various microarray platforms. This package is maintained by the same team that supports Bioconductor. Each platform has an associated R package, for example hgu133a, hgu133plus2, etc. These annotation packages are updated every 6 months by another R package named AnnBuilder that extracts data from different public data sources such as Entrez, Unigene, Golden Path, Gene Ontology, KEGG and HomoloGene. Annotate takes the GenBank accession number provided in the vendor's annotation and maps the accession number to genes using the above databases. The resulting gene identifiers can be used as the basis to obtain other annotation data from these and other sources.
Sequence alignment
Multiple researchers [7–10] have experimented with aligning the sequences of the probes to either the Genome or the Transcriptome in an attempt to obtain more up-to-date gene-to-probe associations. Typically in these studies, the probe sequences provided by the vendor are aligned to a recent release of the Human Genome or Transcriptome using either BLAST [11] or BLAT [12].
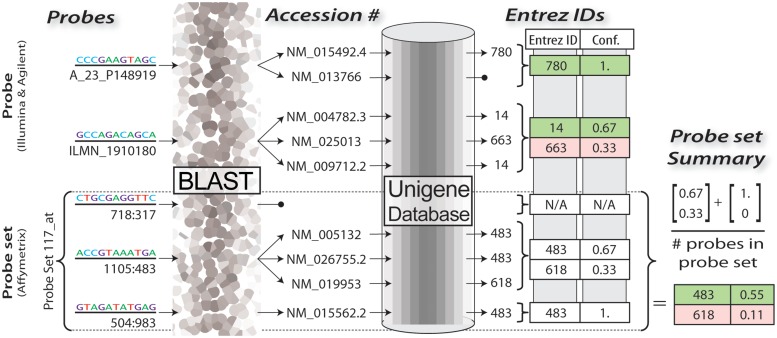
In this study, we used BLAST to align to NCBI's Nucleotide Sequence (nt) database, which stores transcripts from many of NCBI's projects. Figure 1 shows the process we use for extracting the Entrez IDs for each probe. BLAST, by default, supports alignment of non-identical sequences. We filter out all non-identical alignments in order to more stringently ensure that a probe could truly align to that transcript. Additionally, we ensure that the strand orientation is correct before considering the probe alignment to be valid. The ‘nt’ database associates various nucleotide sequences with an accession number. Thus, once we have filtered the possible alignments as described earlier, what remains for each probe sequence is a list of accession identifiers to which each probe could possibly align. These identifiers can then be used to lookup various information about the transcript, including its associated Entrez ID. If a transcript is not associated with an Entrez ID, then we discard that alignment.
Figure 1:
A diagram of the process used to convert raw probe sequences to their associated Entrez Identifiers using BLAST.
Ideally, all of the possible alignments for one probe would be associated with the same Entrez ID. There are many reasons why a single gene would have multiple transcripts in the ‘nt’ database—for instance, each isoform of a gene may have its own transcript. If all of the alignments for a probe were associated with the same Entrez ID, then there is unanimous agreement among the alignments and it is very likely that the probe aligns to that Entrez ID. However, it may be the case that a probe aligns to transcripts, which are associated with different Entrez IDs. In this case, we check to see if >50% of the transcripts are associated with any one Entrez ID. If so, we discard the other associations and keep the one gene association with >50% of the transcripts. Otherwise, we discard all of the associations and treat this probe as having no associated gene. When dealing with Affymetrix probe sets, we compute these characteristics for each probe individually, then compute the ratios across all Entrez IDs associated with all transcripts associated with all probes in a given probe set, as depicted in the bottom portion of Figure 1. If no Entrez ID is found to be associated with >50% of the transcripts associate with this probe set, then the probe set is said to have no Entrez ID associate with it.
Consensus annotation
Finally, we aggregated the three previous annotations into a single ‘Consensus Annotation’. In this annotation, we only considered as valid those associations that exist in all three of the previous methods, i.e. if some probe P were associated with gene G by BLAST and Bioconductor (but not the vendor), we did not include that probe-to-gene association in the consensus alignment. This offered an annotation that was stricter than any of the other methods independently.
RESULTS
Performance
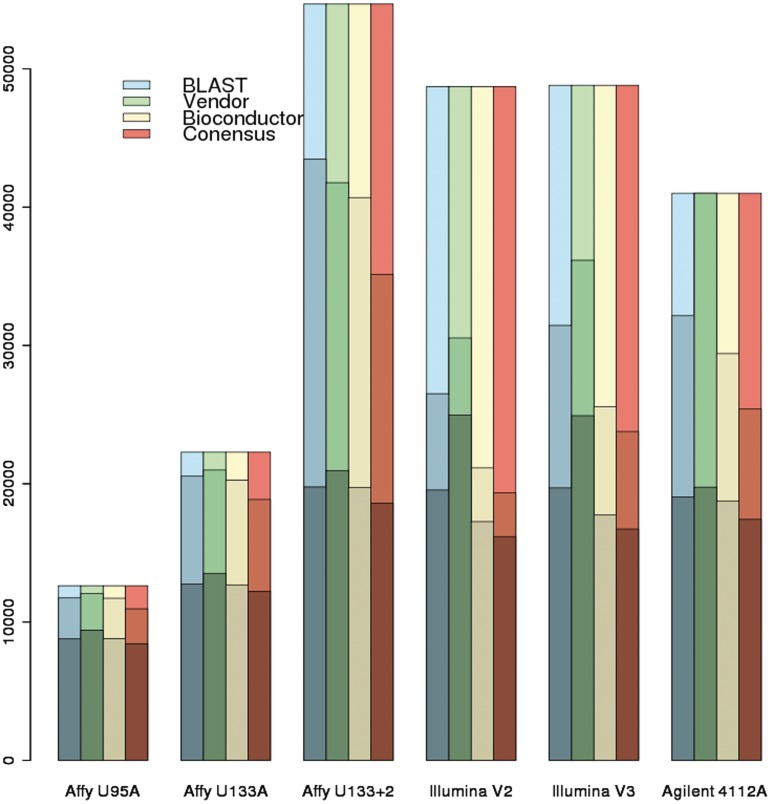
Various metrics can be used to evaluate annotations. One of the most obvious considerations is the number of ‘meaningful’ probes in a platform identified by various approaches. In this context, we consider those probes that can be associated with an Entrez ID to be ‘meaningful’, as those that cannot are typically discarded (or used to measure the background noise). Figure 2 compares this value across various platforms and annotation methods and shows the vendor and BLAST annotations associating the most probes with Entrez IDs. The number of unique Entrez IDs represented by a platform may also be of interest. On an average, the number of unique Entrez IDs represented by a platform is on the order of 50% of the number of probes. All of the Illumina and Agilent platforms as well as Affymetrix U133 Plus 2 covered around 20 000 unique Entrez IDs (estimated by averaging the number computed by all three methods). Affymetrix U95A and U133A platforms only covered around 9000 and 13 000 genes, respectively. Supplementary Table S1 shows the detailed data for the number of probes, number of probes with Entrez ID and number of unique Entrez IDs on each platform using different annotation approaches.
Figure 2:
Depicts information for all seven platforms for the four different annotation methods. The number of unique Entrez IDs represented in this platform is the darkest region. The numbers of probes that were associated with an Entrez ID are represented by the light shading. And the entire height of each bar represents the number of probes in this platform.
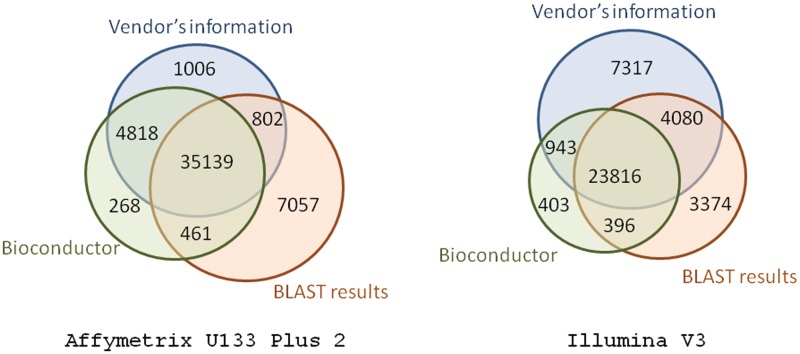
The consistency between the methods is also of interest. If two annotation methods both associate a given probe with the same Entrez ID that is considered a ‘match’; if not, they are considered a ‘mismatch’. This value represents the reproducibility of annotations between the different methods and a sample for two recent platforms is shown in Figure 3. Probe sets (35 139) on Affymetrix U133 Plus 2 will be mapped to the same Entrez ID using all three annotations and there is significant overlap between the annotations from the vendor and from Bioconductor. Probes (23 816) from Illumina v3 can be mapped to the same Entrez ID and there is a bigger overlap between the vendor and BLAST.
Figure 3:
Venn diagrams showing the consistency between the three annotation methods for Affymetrix U133 Plus 2 and Illumina WG6 v3. A probe is considered to be ‘in common’ between methods if both methods associate that probe with the same Entrez ID. Thus, probes in the intersection of all three sets represent those probes on which there was unanimous agreement between the three methods—these are the probes included in the consensus alignment method.
The mapping rate, rA → B, from one platform to another (in this case, A to B), is very important for integrative analysis since the rate tells the percentage of probes that can be used when converting between platforms. The rate is calculated by first computing the following: EAB = EA ∩ EB, where EA is the set of Entrez IDs represented by any probe in Platform A. rA → B is the number of probes in Platform A corresponding to any e ∈ EAB divided by the total number of probes in Platform A. Table 2 shows an excerpt of these results using the BLAST annotation and the complete data is shown in Supplementary Tables S2–S4, with ratios shown in Supplementary Tables S5 and S6.
Table 2:
Mapping rates between three popular platforms using BLAST annotation
| Target |
|||
|---|---|---|---|
| Affy U133 + 2 | Illumina V3 | Agilent 4112A | |
| Source | |||
| Affy U133 + 2 | 0.74 | 0.75 | |
| Illumina V3 | 0.61 | 0.60 | |
| Agilent 4112A | 0.77 | 0.75 | |
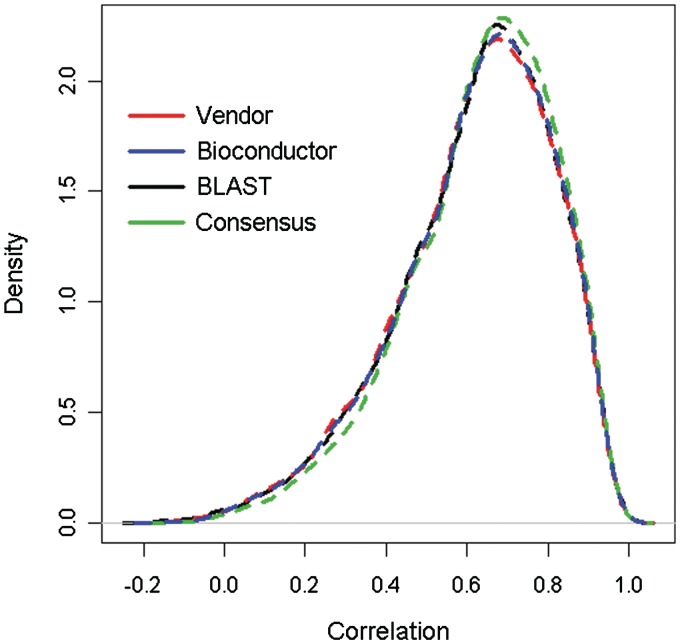
Most importantly, the accuracy of each annotation method can also be analyzed using experimental data. We compared the annotation accuracy by using a lung cancer cell line gene expression data set, in which the genome wide expression from 56 lung cancer cell lines was measured by both Affymetrix U133 Plus 2 and Illumina Human Genome v3 platforms. The Affymetrix data were preprocessed using the RMA method [13], while the Illumina data were preprocessed using the Model-Based Background Correction (MBCB) method [14, 15]. Data from both platforms were normalized using quantile normalization. The Pearson's correlation coefficients for the gene expression across different cell lines between the two platforms were calculated for each Entrez ID. The comparison of this data provides some insights into the accuracy of an annotation method. A set of probes that are associated with the same Entrez ID should have a very high correlation, as they should be measuring the expression level of the same gene from the same set of cell lines. An annotation method that yields high correlations for such probes can be considered more accurate than one that does not. These correlations are, in fact, bimodal: one mode with a high correlation and one with a correlation centered around zero. The low-correlation genes could be due to either misalignment or low expression values (Supplementary Figure S1). After removing those probes with expression values <7, the low-correlation mode largely disappeared. Using only the high-expression probes, we observed that the Consensus Annotation method yielded the best correlation with the BLAST method being the next-best (Table 3, Figure 4). We tested the difference in the density curves using Kolmogorov–Smirnov tests, and the results show the consensus method leads to significantly higher correlation compared to using the Vender's annotation (P = 0.0022), BLAST (P = 0.0077) and Bioconductor annotate package (P = 0.020).
Table 3:
Percentage of low-correlation probes for different methods
| Annotation Methods | Correlation < 0.20 (%) | Correlation < 0.40 (%) |
|---|---|---|
| Vendor | 3.8 | 14.3 |
| Bioconductor | 3.3 | 13.8 |
| BLAST | 3.1 | 13.0 |
| Consensus | 2.5 | 11.3 |
All probes on both Affymetrix U133 Plus 2 and Illumina Human Genome v3 platforms were mapped to Entrez IDs using four different annotation methods, and then two platforms were aligned using Entrez IDs. Entrez IDs (4915) that appear in all four mapping methods and have expression values (in log2 scale) >7 on both platforms were included as the total count for all four methods in this table.
Figure 4:
Depicts the correlation of same-gene expression across all four annotation methods for the lung cancer cell line data set. The higher the correlation, the more accurate we assume a method to be. The consensus method has the highest correlations, followed by BLAST, Bioconductor and then the Vendor's annotation.
It is important to note that the consensus method is, by nature, more conservative than any of the other methods. The improved performance as measured by the correlation comes at the cost of having to discard many potentially valid probe-Entrez associations. As can be seen in Figure 3, only 35 139 (71%) of the possible 49 551 associations are included in the consensus method.
Software
Application programming interface
The results of all three annotation methods have been stored in a MySQL database. We built an Application Programming Interface (API) to facilitate more straightforward method for querying the database. Rather than having to query the database using SQL, a web service can be queried that provides the same information without having to be familiar with the intricacies of the database design. The API was developed in Java and utilizes HTML GET variables to accept a query and JavaScript Object Notation (JSON) to return the data in a format that is both machine and human-readable. The API and the associated documentation are available online at http://qbrc.swmed.edu/software/probemapper/.
It is straightforward to develop a client who can query the database from your client-of-choice using the API. For instance, we developed an R package called ProbeMapper that uses RJSON [16] to efficiently communicate with the API, exposing the data from within R; this package is open-source and is available on CRAN (http://cran.r-project.org/). By leveraging the API, the creation of such clients is straightforward and similar clients could easily be created for a variety of platforms. Within ProbeMapper, users can easily find probes associated with a certain Entrez ID or Entrez IDs associated with a certain probe in any of the seven platforms we include in the database.
User-friendly web interface
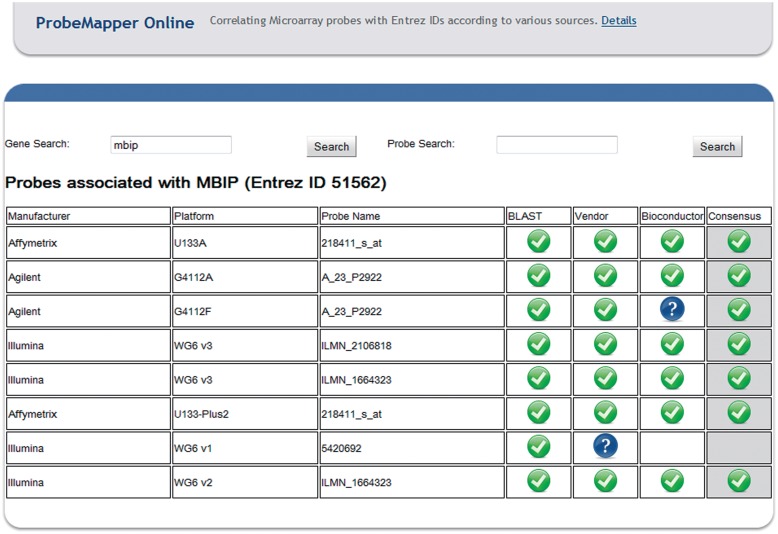
In addition to the API, we have also developed a user-friendly website (Figure 5) that provides access to the most common functionality without requiring any technical knowledge on the part of the end-user. Users can query the web interface by searching for genes or probes and the site will return all of the probes associated with that gene (or vice versa). All of the data available from the API is also available via the user-friendly website.
Figure 5:
A screenshot of our user-friendly website that can be used to analyze gene-probe associations.
CONCLUSION
Based on these results, the Entrez ID can be used to integrate expression data from multiple microarray platforms and manufacturers. We found that a BLAST alignment of the probes to the Transcriptome was more accurate than using the vendor's annotation or Bioconductor—though whether that improvement is due to a difference in methodologies or due to using more recent data is unclear. We would like to further this research in the future using more cell lines in order to become more confident in these results. These results also show that aggregating all three methods is a promising approach, as it achieved higher correlation values than any individual method. It should be noted that even a ‘perfect’ annotation cannot resolve all of the problems associated with data integration across microarray platforms. Different probes from the same gene may behave very differently due to factors like probe efficiency and cross-hybridization affinities. Probes from different manufacturers often target only a subset of a gene's isoforms or transcripts resulting in discrepancies that cannot be resolved using an enhanced annotation or sophisticated normalization techniques.
Our API exposes all of this work in an open, well-structured format for use by other researchers. The ProbeMapper R package is one instantiation of a client that can be developed around this API and offers this data to all R users. We plan to extend this research in the future to incorporate more microarrays, allow users to upload custom microarrays, and begin investigating inter-species integration.
SUPPLEMENTARY DATA
Supplementary data are available online at http://bib.oxfordjournals.org/.
Key Points.
With the volume of public genome-wide expression data increasing so rapidly, it is important to have powerful methods to integrate data across different platforms.
We systematically review and compare different approaches to map probes across seven platforms from different vendors.
We found that a BLAST alignment of the probes to the Transcriptome was more accurate than using the vendor's annotation or Bioconductor.
We develop a user-friendly web-based tool, an API and an R package to map data across different microarray platforms from Affymetrix, Agilent and Illumina.
FUNDING
National Science Foundation (grant DMS-0907562); National Institutes of Health (grants 5R01CA152301, 4R33DA027592, P50CA70907); National Aeronautics and Space Administration (grant NNJ05HD36G); Cancer Prevention and Research Institute of Texas (grant RP101251).
Supplementary Material
Biographies
Jeffrey Allen is a Computational Biologist at UT Southwestern Medical Center, studying gene regulatory networks, gene expression microarrays and next-generation sequencing.
Siling Wang is a PhD candidate in Computer Science at Southern Methodist University. His research areas include bioinformatics and data mining.
Min Chen is an Assistant Professor in the Quantitative Biomedical Research Center at UT Southwestern Medical Center. His research interests include statistical genomics and biostatistics.
Luc Girard is an Assistant Professor of Pharmacology at UT Southwestern. He did his PhD in Molecular Biology in Montreal, Canada. He has expertise in bioinformatics and is currently working on developing drug sensitivity signatures in lung cancer.
John Minna is a Professor in the Hamon Center for Therapeutic Oncology and serves as the Max L. Thomas Distinguished Chair in Molecular Pulmonary Oncology and the Sarah M. and Charles E. Seay Distinguished Chair in Cancer Research at UT Southwestern Medical Center.
Yang Xie is an Assistant Professor and Director of the Quantitative Biomedical Research Center at UT Southwestern Medical Center. She has research expertise in biostatistics and bioinformatics.
Guanghua Xiao is an Assistant Professor in the Quantitative Biomedical Research Center at UT Southwestern Medical Center. His research interests include statistical genomics and analysis of high-throughput data.
References
- 1.Ma S, Huang J, Moran MS. Identification of genes associated with multiple cancers via integrative analysis. BMC Genomics. 2009;10:535. doi: 10.1186/1471-2164-10-535. [DOI] [PMC free article] [PubMed] [Google Scholar]
- 2.Ma S, Huang J. Regularized gene selection in cancer microarray meta-analysis. BMC Bioinformatics. 2009;10:1. doi: 10.1186/1471-2105-10-1. [DOI] [PMC free article] [PubMed] [Google Scholar]
- 3.Huang X, Pan W, Han X, et al. Borrowing information from relevant microarray studies for sample classification using weighted partial least squares. Computat Biol Chem. 2005;29:204–11. doi: 10.1016/j.compbiolchem.2005.04.002. [DOI] [PubMed] [Google Scholar]
- 4.Carter SL, Eklund AC, Mecham BH, et al. Redefinition of Affymetrix probe sets by sequence overlap with cDNA microarray probes reduces cross-platform inconsistencies in cancer-associated gene expression measurements. BMC Bioinformatics. 2005;6:107. doi: 10.1186/1471-2105-6-107. [DOI] [PMC free article] [PubMed] [Google Scholar]
- 5.Mecham BH, Klus GT, Strovel J, et al. Sequence-matched probes produce increased cross-platform consistency and more reproducible biological results in microarray-based gene expression measurements. Nucleic Acids Res. 2004;32:e74. doi: 10.1093/nar/gnh071. [DOI] [PMC free article] [PubMed] [Google Scholar]
- 6.Draghici S, Khatri P, Eklund AC, et al. Reliability and reproducibility issues in DNA microarray measurements. Trends Genet. 2006;22:101–9. doi: 10.1016/j.tig.2005.12.005. [DOI] [PMC free article] [PubMed] [Google Scholar]
- 7.Carter SL, Eklund AC, Mecham BH, et al. Redefinition of Affymetrix probe sets by sequence overlap with cDNA microarray probes reduces cross-platform inconsistencies in cancer-associated gene expression measurements. BMC Bioinformatics. 2005;6:107. doi: 10.1186/1471-2105-6-107. [DOI] [PMC free article] [PubMed] [Google Scholar]
- 8.Hwang K-B, Kong SW, Greenberg SA, et al. Combining gene expression data from different generations of oligonucleotide arrays. BMC Bioinformatics. 2004;5:159. doi: 10.1186/1471-2105-5-159. [DOI] [PMC free article] [PubMed] [Google Scholar]
- 9.Gautier L, Møller M, Friis-Hansen L, et al. Alternative mapping of probes to genes for Affymetrix chips. BMC Bioinformatics. 2004;5:111. doi: 10.1186/1471-2105-5-111. [DOI] [PMC free article] [PubMed] [Google Scholar]
- 10.Liu H, Zeeberg BR, Qu G, et al. AffyProbeMiner: a web resource for computing or retrieving accurately redefined Affymetrix probe sets. Bioinformatics. 2007;23:2385–90. doi: 10.1093/bioinformatics/btm360. [DOI] [PubMed] [Google Scholar]
- 11.Zhang Z, Schwartz S, Wagner L, et al. A greedy algorithm for aligning DNA sequences. J Computat Biol. 2000;7:203–14. doi: 10.1089/10665270050081478. [DOI] [PubMed] [Google Scholar]
- 12.Kent WJ. BLAT—the BLAST-like alignment tool. Genome Res. 2002;12:656–64. doi: 10.1101/gr.229202. [DOI] [PMC free article] [PubMed] [Google Scholar]
- 13.Irizarry RA. Summaries of Affymetrix GeneChip probe level data. Nucleic Acids Res. 2003;31:e15. doi: 10.1093/nar/gng015. [DOI] [PMC free article] [PubMed] [Google Scholar]
- 14.Allen JD, Chen M, Xie Y. Model-based background correction (MBCB): R methods and GUI for illumina bead-array data. J Cancer Sci Ther. 2009;1:25–7. doi: 10.4172/1948-5956.1000004. [DOI] [PMC free article] [PubMed] [Google Scholar]
- 15.Xie Y, Wang X, Story M. Statistical methods of background correction for Illumina BeadArray data. Bioinformatics. 2009;25:751–7. doi: 10.1093/bioinformatics/btp040. [DOI] [PMC free article] [PubMed] [Google Scholar]
- 16.Couture-Beil A. Package `rjson’. 2011. http://CRAN.R-project.org/package=rjson (1 June 2011, date last accessed) [Google Scholar]
Associated Data
This section collects any data citations, data availability statements, or supplementary materials included in this article.


