Abstract
Objectives
This study was designed to evaluate exposure levels of various chemicals used in wafer fabrication product lines in the semiconductor industry where work-related leukemia has occurred.
Methods
The research focused on 9 representative wafer fabrication bays among a total of 25 bays in a semiconductor product line. We monitored the chemical substances categorized as human carcinogens with respect to leukemia as well as harmful chemicals used in the bays and substances with hematologic and reproductive toxicities to evaluate the overall health effect for semiconductor industry workers. With respect to monitoring, active and passive sampling techniques were introduced. Eight-hour long-term and 15-minute short-term sampling was conducted for the area as well as on personal samples.
Results
The results of the measurements for each substance showed that benzene, toluene, xylene, n-butyl acetate, 2-methoxyethanol, 2-heptanone, ethylene glycol, sulfuric acid, and phosphoric acid were non-detectable (ND) in all samples. Arsine was either "ND" or it existed only in trace form in the bay air. The maximum exposure concentration of fluorides was approximately 0.17% of the Korea occupational exposure limits, with hydrofluoric acid at about 0.2%, hydrochloric acid 0.06%, nitric acid 0.05%, isopropyl alcohol 0.4%, and phosphine at about 2%. The maximum exposure concentration of propylene glycol monomethyl ether acetate (PGMEA) was 0.0870 ppm, representing only 0.1% or less than the American Industrial Hygiene Association recommended standard (100 ppm).
Conclusion
Benzene, a known human carcinogen for leukemia, and arsine, a hematologic toxin, were not detected in wafer fabrication sites in this study. Among reproductive toxic substances, n-butyl acetate was not detected, but fluorides and PGMEA existed in small amounts in the air. This investigation was focused on the air-borne chemical concentrations only in regular working conditions. Unconditional exposures during spills and/or maintenance tasks and by-product chemicals were not included. Supplementary studies might be required.
Keywords: Semiconductor, Carcinogen, Reproductive toxin, Hematologic toxicity, Benzene, Arsine
Introduction
Semiconductor fabrication industries handle a variety of toxic chemical substances (metals, organic compounds, acids, alkaline, toxic gases), but generally all processes are carried out in class 1-level (less than one speck of dust in air volume of 1ft3) clean rooms and exposure levels are known to be very low. According to Worskie et al. [1], evaluations of exposure levels of organic solvents and fluorides in clean rooms in semiconductor industries show that, in exposure levels demonstrated by the Occupational Safety and Health Administration (OSHA) and American Conference of Governmental Industrial Hygienists (ACGIH), levels were measured at 2% or less than the exposure criteria, even when the lowest values were applied. However, it was reported that 2-ethoxyethyl acetate (2-EEA) was measured at about 15% of the ACGIH-TLVs (Threshold Limit Values). Scarpace et al. [2] reported, in an evaluation of air in clean rooms, a rate of 10% or less of the exposure standard of 2-EEA. Despite this low rate of exposure concentration, cases of occupational-related spontaneous abortion and occupational cancer were reported for workers in the semiconductor industry [1]. Spontaneous abortions have been reported to have a dose-response relationship with ethylene-based glycol ethers and ethylene-based chemicals used in photoresist and development processes. Workers' abortions could be connected with work stress and fluorides created in the process of etching [1].
For the relationships between occupational cancers and industrial processes in the semiconductor industry, a cohort study [3], which observed 1,897 semiconductor industry workers between 1970-2001 in the Midlands, UK, an epidemiologic survey of 4,388 workers at the National Semiconductor Company conducted by England's Ministry of Safety and Public Health [4], and a study by IBM in the United States of 126,836 workers at 3 major companies [5] were unable to establish any links to occupational causes. Sufficient numbers of investigations and exposure evaluations of chemical substances handled during the production of semiconductors have not yet been implemented, and as the technology has been transferred from advanced countries like Europe and the United States to developing countries, detailed supplementary studies have been recommended [6,7].
Therefore, this study was focused on the production lines of workplaces where 2 leukemia cases had been found in the past [8] in order to investigate the exposure levels of various chemical substances handled in a semiconductor fabrication process.
Materials and Methods
Target workplace
We conducted an evaluation of one of the production lines where leukemia had occurred, which was established in 1988 and used the oldest method of production. The production line under survey was a large-scale clean room building 100 mL × 50 mW, with a multi-level structure divided into 1st and 2nd floors, divided into about 25 bays, or work spaces. Generally the production process consisted of six steps (diffusion, lithography, etching, ion implantation, chemical vapor deposition (CVD), and metallization) and each step consisted of 3-6 bays depending on the type of process. Measurements were carried out at 9 bays representing the main stage of the process. Each bay was about 3 mL × 20 mW, and evaluations of exposure levels were conducted by dividing each bay into 3 areas. Thus, monitoring was conducted in 27 different measurement locations. To verify the daily exposure variations, duplicate measurements were performed on two separate days.
Accordingly, Bays 3 (wet etching), 6 (dry etching), 9 (lithography), 13 (ion implantation), and 14 (chemical vapor deposition) on the 1st floor, as well as bays EF 2, 14 (lithography), EF16 (dry etching), and EF 17 (chemical vapor deposition) on the 2nd floor were selected for the evaluation. Diffusion and metallization processes were not investigated, because they do not use target chemical substances for this research project.
The first work for the investigation took place in May 2007 to verify on-site processes and handled chemical substances. The second preparatory investigation was conducted in June 2007 to set up a detailed investigation plan. On-site exposure monitoring was carried out in September 2007.
Measured chemical substances
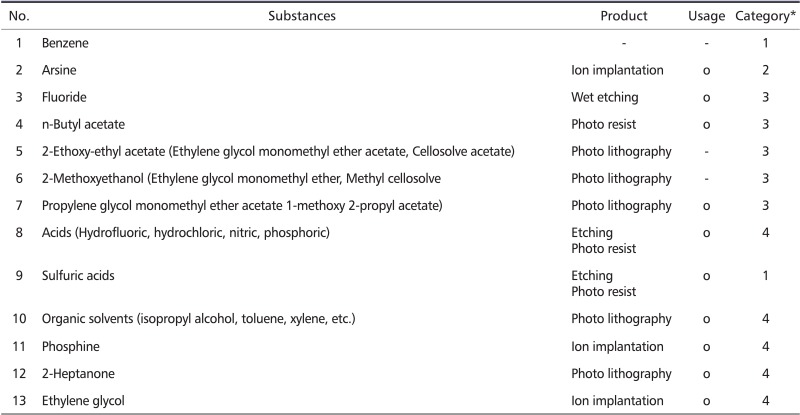
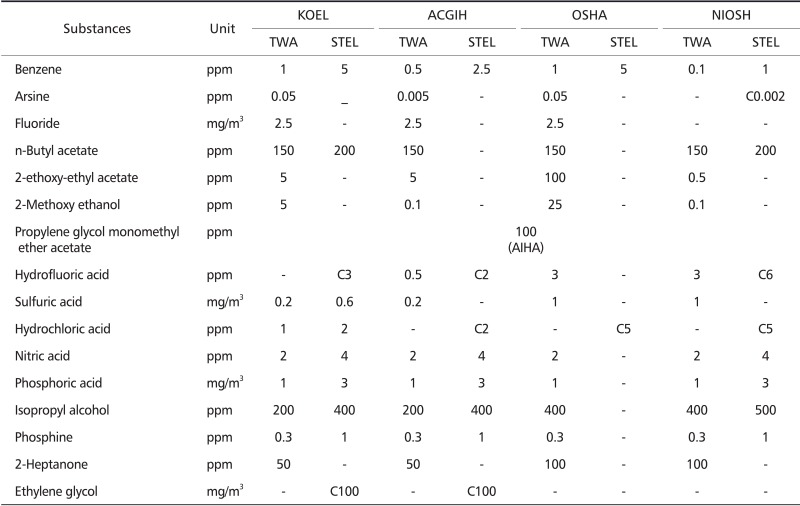
We monitored chemical substances categorized as human carcinogens with respect to leukemia, harmful chemicals currently regulated by the Korea Ministry of Labor (KMOL) that were used in the bays, and substances with hematologic and reproductive toxicities to evaluate the overall health effect for semiconductor workers (Appendix 1). Among the regulated harmful substances, the study measured acids (sulfuric, hydrofluoric, hydrochloric, nitric, phosphoric), organic solvents (isopropyl alcohol, toluene, xylene, etc.), phosphine, 2-heptanone, ethylene glycol, as well as known human lymphohematogenic carcinogens, such as benzene, chemicals with hematologic toxicity, such as arsine, and substances with reproductive toxicity, such as fluoride, n-butyl acetate, cellosolves, and propylene glycol mono methyl ether acetate. Exposure criteria for the chemical substances that were measured are shown in (Appendix 2). Carcinogenic categories recommended by the ACGIH include sulfuric acid (A2), fluoride (A4), hydrochloric acid (A4), and isopropyl alcohol (A4), while the US-EPA (US Environmental Protection Agency) has insufficient data to show that phosphine is carcinogenic in humans according to its category EPAD (not classified as to human carcinogen) and is therefore a substance difficult to classify. Arsine is a potential carcinogenic substance according to the National Institute for Occupational Safety and Health (NIOSH) classification NIOSH-Ca (Potential Occupational Carcinogen). According to the International Agency for Research on Cancers standard, benzene and sulfuric acids are classified as group 1 carcinogens.
Measurement method
The workers have to wear a bunny suit (clean suit), a kind of body suit, which made it difficult for them to wear the personal air-sampling device, so area samples were mainly collected for this study. However, at bays where organic solvents were measured, in addition to area sample collection, a personal passivetype sample-collecting device (3M 3520 organic vapor monitor) was used along with the area samples. As the Bay 3 wet etching process is the oldest process in the factory where workers manually put silicon wafers directly in a plating bath and withdraw them, simultaneous 15-min short-term exposure concentration (STEL) measurements were conducted with 8-hr long-term samplings.
The clean room operates continually in three shifts, 24 hours a day, each shift being 6 AM to 2 PM, 2 PM to 10 PM, and 10 PM to 6 AM the next morning. Assuming little difference in exposure levels among shifts, samples were collected for more than 7 hours for each shift. The exposure concentration at non-measured hours in the shift were also assumed to be no different in exposure concentrations with measured hours, and we compared concentrations during measurement periods with 8-hour time-weighted average-occupational exposure limits (TWA-OEL).
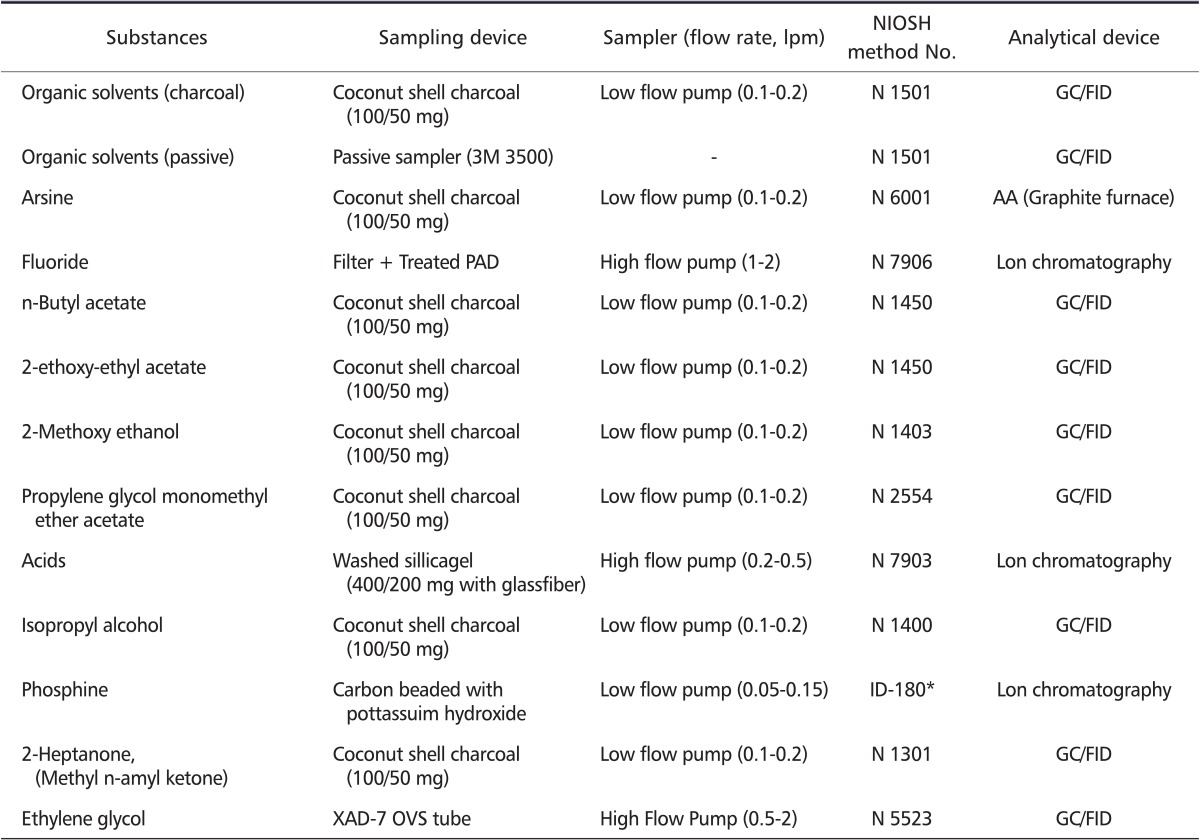
Sample collection and analysis were conducted based on the NIOSH Manual of Analytical Methods (NMAM). Information regarding sample collecting media and analytical methods by substance can be found in (Table 1). For the area samples, low airflow samplers (Gillian, USA) and high airflow samplers (MSA, USA) were used. Each sampler was calibrated before and after measurements to ensure accurate monitoring. We included 1 or more on-site blank per every ten samples.
Table 1.
Sampling and analytical methods for measured substances
NIOSH: The National Institute for Occupational Safety and Health, GC/FID: gas chromatography/flame ionization detector, AA: atomic absorption spectrophotometer.
*ID-180: OSHA method ID-180 (N: NIOSH methods).
Data analysis and statistics
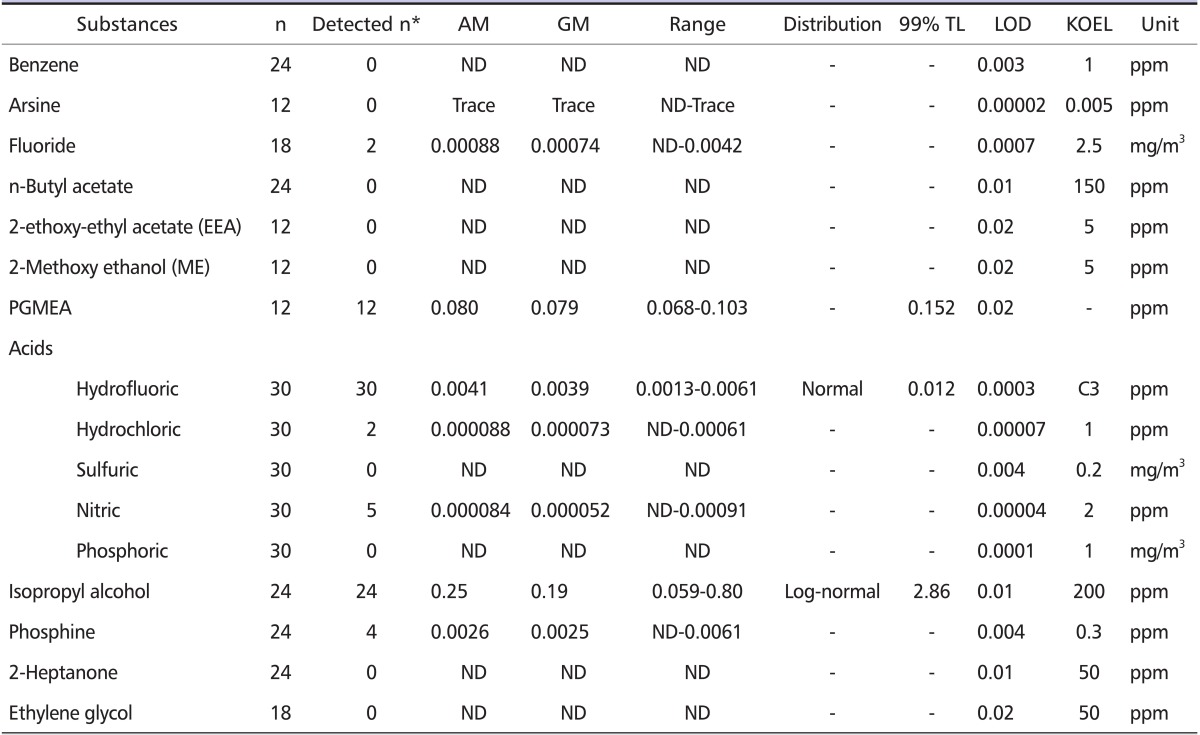
Results of measurements and analysis are grouped into substances, processes, floors, and sampling days and are summarized in (Tables 2-6). In order to figure out the distribution patterns of the substances, we used a Shapiro & Wilk Test (W-Test) with a 5% of significant level, and then the representative values were shown by means of arithmetic and geometric mean. For each arithmetic and geometric mean, samples determined to be "below detection limit" or "non-detectable (ND)" were assumed to represent LOD/√2, which is the method widely used in the industrial hygiene field. Detection limits of measured chemicals are shown in (Table 2). The Lognorm 2 program [9] was used to estimate 99% of the measured (estimated) values and the 99% tolerance limits (TL) with 99% significance levels for hydrofluoric acid, sulfuric acid, isopropyl alcohol, and propylene glycol mono methyl ether acetate (those with 20 or more samples).
Table 2.
Concentrations of measured substances
AM: arithmatic mean, GM: geometric mean, 99% TL: tolerance limit, the measurement results estimated a 99% measured range value, LOD: limit of detection, KOEL: Korea Occupational Exposure Limits, ND: non-detectable was translated into value of LOD/√2, C: ceiling.
*Detected n: sample number except ND.
Table 6.
Concentrations of measured substances by short-term sampling
AM: arithmatic mean, GM: geometric mean, OEL: occupational exposure limits, ND: non-detectable was translated into value of LOD/√2, C: ceiling.
*Detected n: sample number except ND.
The arithmetic and geometric means for each sampling day were obtained after translating the concentration into LOD/√2 for "ND" samples, just as was done with the mean of the total substances with respect to measurement results according to process, floors, and sampling day. Also, regarding the results organized by floor and sampling day, a Wilcoxon signed-rank test was used on PASW statistics 18.0 (SPSS inc., Chicago, IL. USA), followed by the calculation of the p-value to analyze whether statistically significant differences were obtained in the results of the two test periods. Wilcoxon signedrank tests were performed only on substances with sample rates of 50% or more whose result values were not "ND".
Results
Results of measured substances
The results of the measurements for each substance are shown in (Table 2). Benzene, n-butyl acetate, 2-ethoxyethyl acetate, 2-methoxy ethanol, 2-heptanone, and ethylene glycol were not detected in all samples. Arsine concentrations were "ND" or at trace levels for all samples.
Fluoride was "ND" except for two samples. After translating the ND samples into the LOD/ √2 value, an arithmetic mean of 0.00088 mg/m3 and geometric mean of 0.00074 mg/m3 corresponded to approximately 0.1% of the Korea Occupational Exposure Limits (KOEL), with the maximum concentration of 0.0042 mg/m3 being about 0.17% of the standard.
Propylene Glycol Monomethyl Ether Acetate (PGMEA) was detected in all twelve samples at in the range of 0.068-0.103 ppm with an arithmetic mean of 0.080 ppm and geometric mean of 0.079 ppm. Exposure limits for PGMEA are not established by KMOL, ACGIH, and NIOSH, but the standard recommended by the American Industrial Hygiene Association (AIHA) is 100 ppm.
Sulfuric and phosphoric acid were "ND" in all samples. Hydrochloric acid was "ND" in 2 of 30 samples, and nitric acid was "ND" in all but 5 samples. Hydrofluoric acid had the highest concentrations among all the acids and this was detected in all samples, but its highest concentration was 0.0061 ppm, or about 0.2% of the KOEL. However, according to the 15-min. short-term exposure concentration evaluations at Bay 3, the maximum concentration of hydrofluoric acid was detected at 0.102 ppm, amounting to 3.4% of the KOEL and roughly 5.1% of the ACGIH standard.
The arithmetic and geometric means of isopropyl alcohol were 0.25 ppm and 0.19 ppm, respectively. The concentration range was 0.059-0.80 ppm and this was about 0.03-0.4% of the KOEL. Phosphine exhibited a range of "ND" - 0.0061 ppm and only 4 samples had detectable levels among the total of 24 samples. The highest exposure of 0.0061 ppm was about 2% of the KOEL.
Results of measurements organized by process and floors
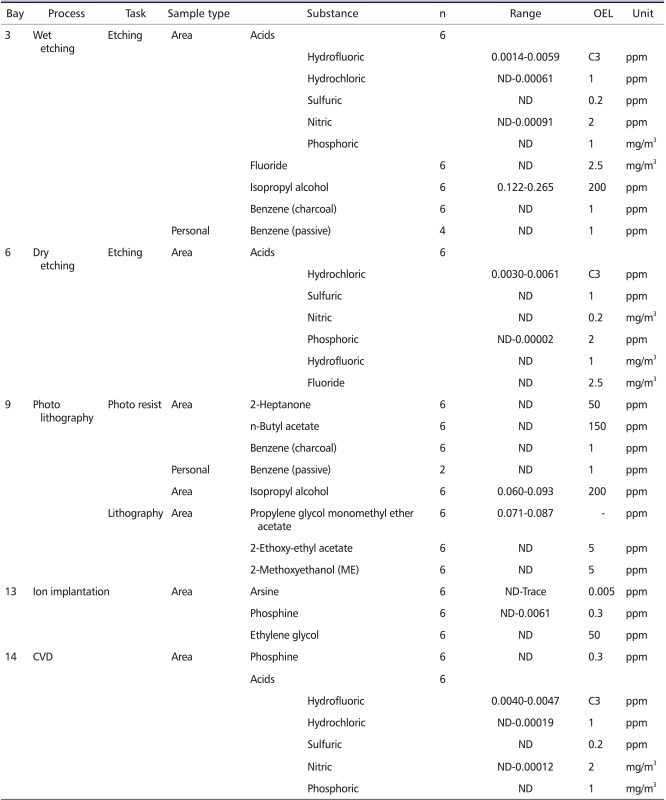
Measurement results on the 1st floor, depending on the process, showed that fluoride and benzene were "ND" for the wet etching process in Bay 3. Concentrations of hydrofluoric acid were similar in most bays engaging in cleansing, and they were about 0.2% or less of the KOEL. Nitric acid was detected in 4 samples at about 0.05% of the KOEL. The concentrations of hydrochloric acid were "ND" in all but 1 sample, and sulfuric and phosphoric acid were "ND" in all samples.
The dry etching process (cleansing) at Bay 6 had "ND" levels for hydrochloric acid, sulfuric acid, phosphoric acid, and fluoride, while hydrofluoric acid had a maximum concentration of 0.0061 ppm or about 0.2% of the KOEL.
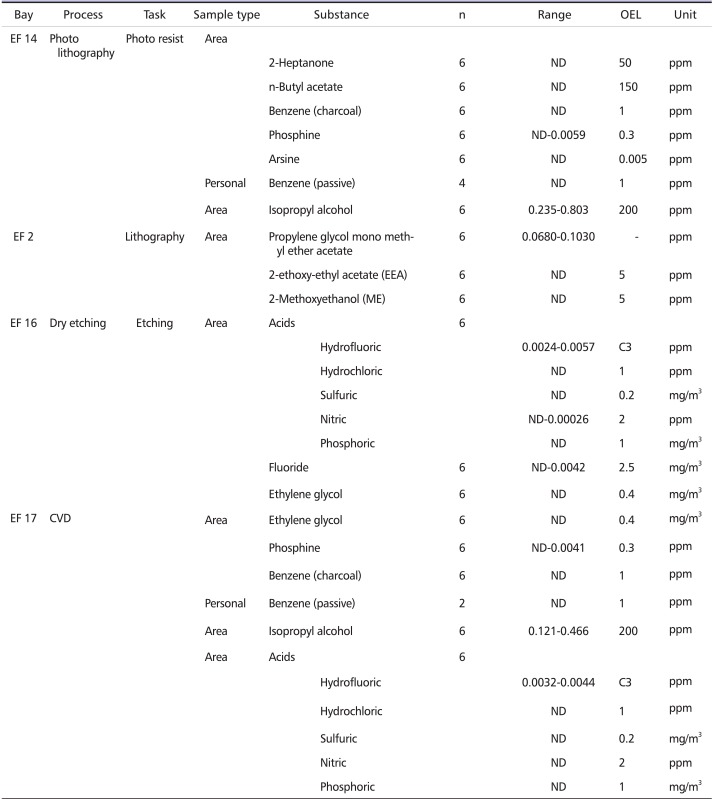
For the lithography process in Bay 9, benzene, 2-heptanone, n-butyl acetate, 2-ethoxyethyl acetate, and 2-methoxyethanol (Methoxyethanol, methyl cellosolve) were all "ND". PGMEA had a maximum exposure concentration of 0.087 ppm, equaling 0.1% or less of the AIHA recommended standard. Currently the KMOL, ACGIH, and NIOSH do not have exposure limits for this substance. It has been used at semiconductor manufacturing sites as a substitute for 2-ethoxyethyl acetate, known to cause reproductive toxins (AIHA standard 100 ppm). For the ion implantation process at Bay 13, arsine turned up in A trace amount for one sample but was "ND" in all other samples. Ethylene glycol was "ND" everywhere. Phosphine was detected in two samples, with a maximum exposure concentration of 0.0061 ppm, or about 2% of the KOEL. For the ion implantation process at Bay 14, phosphine was "ND". Hydrofluoric acid was about 0.15% of the KOEL (Appendix 3). Results organized by process on the 2nd floor were as follows: At bay 14, 2-heptanone, n-butyl acetate, benzene, arsine, etc, were "ND" in all samples, except 1 sample had a detectable level for phosphine. In bay EF 2, propylene glycol monomethyl ether acetate (PGMEA) was detected at 0.0680-0.1030 ppm, but 2-ethoxyethyl acetate and 2-methoxyethanol were not detected. At bay EF 16, ethylene glycol was "ND" but hydrofluoric acid (0.0023-0.0057 ppm), and nitric acid (ND-0.00026 ppm) were detected. At bay EF 17, phosphine concentrations were detected at a maximum of 0.0041 ppm, and acid tests results were similar to bay EF 16 (Appendix 4).
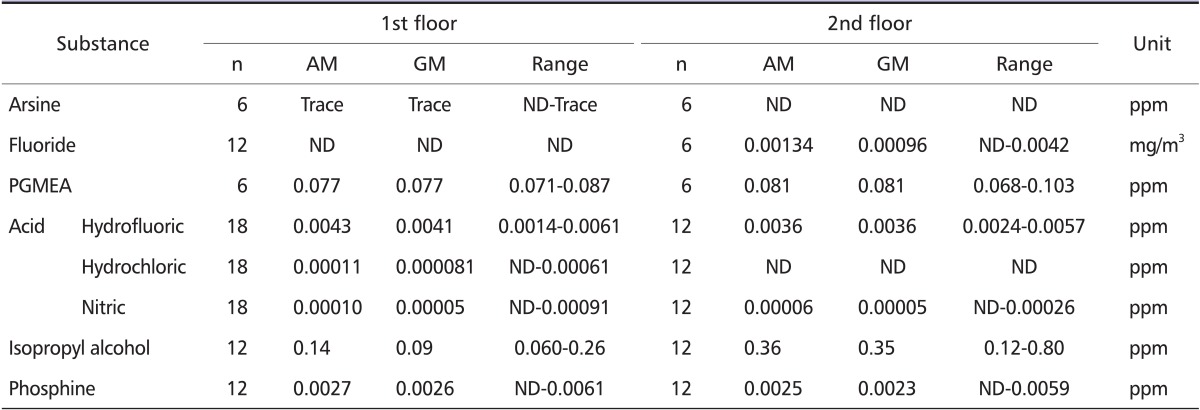
Based on the results organized by floor as a whole, benzene, n-butyl acetate, 2-ethoxyethyl acetate, 2-methoxyethanol, sulfuric acid, phosphoric acid, 2-heptanone, ethylene glycol were "ND" in all samples on both floors, with little differences between floors. All arsine levels were "ND" except for a trace amount in one sample taken at the 1st floor.
Fluoride was not detected in all first floor samples, but it was detected in two samples at bay EF 14 on the 2nd floor with a concentration level arithmetic mean of 0.00134 and geometric mean of 0.00096 mg/m3.
Propylene glycol monomethyl ether acetate on floors 1 and 2 had a mean concentration of 0.077 ppm and 0.081 ppm, respectively; and the result of a Wilcoxon signed-rank test had a p-valued of 0.600 (p > 0.05), so no significant differences existed between the levels of each floor.
For acids, hydrofluoric acid was evaluated to be 0.0005 ppm higher on the 1st floor than on the 2nd floor. The results of a Wilcoxon signed-rank test for each floor showed the p-value to be 0.480 (p > 0.05), so no significant differences existed between the levels of each floor. Hydrochloric acid was "ND" in all samples from the 2nd floor but, on the 1st floor, 2 samples had quantifiable levels.
Nitric acid had arithmetic and geometric means of 0.00010 and 0.00005 ppm, respectively, for the first floor and 0.00006 and 0.00005 ppm, respectively, for the second floor. All samples were "ND" except for 4 samples that were at about 0.005% of the exposure standard of 2 ppm.
Isopropyl alcohol was shown to exist in higher mean concentrations on the 2nd floor than those of the 1st floor. The concentrations in the 2nd floor at bays EF 14 and 17 were twice as high as those of the 1st floor. For isopropyl alcohol, the results of the two test periods were subjected to a Wilcoxon signedrank test, and the test yielded a p-value of 0.023 (p < 0.05), so statistically significant differences did exist between the two floors. Phosphine evaluated on the 1st and 2nd floors had arithmetic and geometric means of 0.0027 and 0.0026 ppm, respectively, on the first floor and 0.0025 and 0.0023 ppm, respectively, on the second floor. Except for 4 samples, all were "ND", and those 4 samples had an average of about 0.068% of the exposure standard of 0.4 ppm.
Therefore, results organized by substance measured between the 1st and 2nd floors showed that no statistical differences existed between chemical levels in each floor, except for isopropyl alcohol (Table 3).
Table 3.
Average concentrations by each floor
AM: arithmatic mean, GM: geometric mean, ND: non-detectable was translated into value of LOD/√2.
If all samples for a specific substance were ND, then each floor result for that substance is not shown in this table.
Results of measurements organized by sampling days
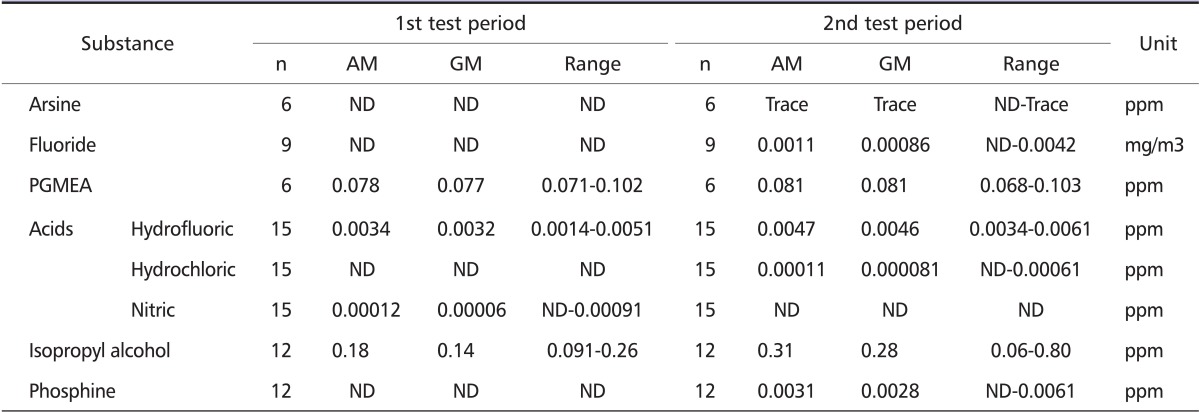
Looking at the measurement results for each sampling day, benzene, n-butyl acetate, 2-ethoxyethyl acetate, 2-methoxyethanol, 2-heptanone and ethylene glycol were "ND" for all samples taken during day 1 and 2, with no difference between the two sample days. Except for one sample taken during the second day, arsine was "ND" in all cases, and phosphine was "ND" in all samples from day 1, but they were quantified in 4 samples at a higher geometric mean of about 0.0008 ppm (38%) in day 2.
The concentrations of the fluoride samples were "ND" in all samples in day 1, but two samples had slight levels from bay EF 16 in day 2. Results of a Wilcoxon signed-rank test conducted on the results of PGMEA from day 1 and 2 showed no significant differences with a p-value of 0.354 (p > 0.05). The highest concentration of hydrofluoric acid appeared higher in day 2 at a level about 0.0014 ppm (44%) compared to day 1. Samples taken during day 2 showed a slightly higher level than day 1. Hydrochloric acid also appeared a bit higher in day 2. Two samples quantified in day 2, while all samples were "ND" in day 1. A Wilcoxon signed-rank test was applied to the levels of hydrofluoric acid for each day, and a p-value of 0.001 (p < 0.05) was obtained. The concentrations of isopropyl alcohol also had a higher mean concentration in day 2 compared to day 1. Much higher concentrations were recorded in bays EF 14 and 17 in day 1. A Wilcoxon signed-rank test did not yield a significant difference for the isopropyl alcohol results for each sampling day with a p-value of 0.136 (p > 0.05).
Therefore, results organized by sampling days showed no statistically significant differences in all chemicals, except for hydrofluoric acid (Table 4).
Table 4.
Average concentrations for each sampling day
AM: arithmatic mean, GM: geometric mean, ND: non-detectable was translated into value of LOD/√2.
If all samples for a specific substance were ND, then each sampling day result for that substance is not shown in this table.
Results of passive-type collecting device and short-term measurement
Results of the passive-type collecting device for organic solvents were mostly "ND" with the exception of isopropyl alcohol. Isopropyl alcohol had an arithmetic mean of 0.11 ppm and a geometric mean of 0.076, and it was as much as 50% lower compared to the level of the area samples that had values of 0.25 ppm and 0.19 ppm. As for toluene and xylene, concentrations were qualified in 3 samples and 2 samples, respectively, and all below 1.5% of their respective exposure standards (Table 5).
Table 5.
Concentrations of measured substances by passive sampler
AM: arithmatic mean, GM: geometric mean, OEL: occupational exposure limits, ND: non-detectable.
At Bay 3, the short-timed measurement results for organic solvents were "ND" in all samples. We judged that this was due to the short sampling time of 15 minutes. As for acids, hydrofluoric acid had a mean of 0.092 ppm, and, compared to the arithmetic mean of 0.0041 ppm for area samples, showed an approximately 20 times greater concentration. Fluorides were not detected for all short-term samples (Table 6).
Discussion
Since entering in US industries in the late 1940s with the invention of the transistor, microelectronics companies expanded rapidly in the twenties century [10,11]. NIOSH conducted the Health Hazard Evaluation in several semiconductor industry worksites in the 1970s and 1980s focused on chemicals including metals, organic solvents, and acids. The air-borne concentrations of the chemicals were relatively low compare to OEL. It recommended using respirators, improving local exhaust ventilation, and stressing better work practices. They also asked continuous researches in this industry for workers health and safety [12-14].
We measured the chemicals that are used in the worksites and regulated as harmful substances by KMOL, chemical substances that are categorized as human carcinogens with respect to leukemia, and chemicals with hematologic and reproductive toxicity. Benzene, toluene, xylene, n-butyl acetate, 2-methooxyethanol, 2-heptanone, ethylene glycol, and phosphoric acid were ND in all samples. Benzene, 2-ethoxyethyl acetate, and 2-methooxyethanol were measured to verify that these chemicals can exist as impurities or by-products even though they were not actually used in this fabrication line. We found that the possibility of generation of benzene, 2-ethoxyethyl acetate, and 2-methooxyethanol was rare in this product line.
Arsine was either "ND" or existed only in trace amounts in the air. Arsine was used in the ion implantation process and arsine was injected into the machine while the machine's door-lock system was operating, so the possibility of leakage of arsine gas and exposure chances to workers during a normal operation period was very low.
The maximum exposure concentration of fluorides was approximately 0.17% of the exposure standard, with hydrofluoric acid at 0.2%, hydrochloric acid 0.06%, sulfuric acid 1.7%, nitric acid 0.05%, isopropyl alcohol 0.4%, and phosphine at about 2%. The maximum exposure concentration of PGMEA was 0.0870 ppm, representing only 0.1% or less than the AIHA recommended standard (100 ppm).
Results organized by substance measured between the 1st and 2nd floors showed that statistical differences existed for isopropyl alcohol and, when compared by sampling days, statistical differences existed for hydrofluoric acid.
The organic solvent used in the photolithography process existed both on the 1st and 2nd floor, but the concentration of isopropyl alcohol was higher for the 2nd floor lithography process. Fluorides were detected in EF 16 (Dry etching) on the 2nd floor only on day 2. This means exposure concentration differences can arise depending on the sampling day even though the same procedures are being performed, so we recommended repeated sampling on different days when evaluating chemical concentrations in the air, even in the clean-room environment.
Measurement results using a passive-type measurement device, as with the measurement results for organic solvents, were mostly "ND" except for isopropyl alcohol. Isopropyl alcohol was as much as 50% lower compared to those of the area samples. Short-term measurement results were "ND" for all samples for organic solvents due to the short period of sample collection time. As for acids, hydrofluoric acid had a mean of 0.092 ppm, and it had a level about 20 times higher than the arithmetic mean of 0.0041 ppm for the area samples. Fluoride was evaluated as "ND" for all samples.
The limitation of our monitoring was that many samples were "ND" and we estimated that these results come from the low sampling volume. So, in the next semiconductor evaluating study, higher sampling volumes are recommended.
Our monitoring results in a semiconductor industry facility were similar to the data in the research by Worskie et al. [1], in which all solvent and fluoride concentrations measured were less than 2 percent of the lowest exposure limits recommended by OSHA or ACGIH, except EEA, which had maximum levels of 15 percent of the ACGIH-recommended exposure limit. Scarpace et al. [2] reported chemical exposures in the semiconductor industry that were typically reported as less than 10 percent of the ACGIH-TLV.
Nevertheless some researchers reported the risk of spontaneous abortion and cancer incidence among semiconductor workers and they asked for further detailed supplementary studies [1,7]. Also they pointed out that high exposures are likely to occur during episodes like spills or maintenance tasks. Actually, during the normal operation period, the chemical are used inside of machines with operational door-lock systems, so workers are rarely exposed to chemicals. However, during spills or maintenance tasks, workers can be expose to chemicals in the workplace and in clean-room systems which re-circulate over 80% of air that is only passed through high-efficiency particle filters, so chemicals can remain in the air for quite a long time. Also, chemical information and health hazards in hightech semiconductor manufacturing processes might be poorly understood due to rapid process changes and the penchant for secrecy by such manufacturers.
In conclusions, the monitoring levels of the chemicals for the 9 bays in a semiconductor industry facility suggested quite low possible workers' exposures compare to the criteria of KOEL, OSHA, ACGIH, and NIOSH. Benzene, a known human carcinogen with respect to leukemia, and arsine were not detected in the process. Among reproductive toxic substances, n-butyl acetate was not detected, but fluorides and propylene glycol monomethyl ether acetate (PGMEA) were found to exist in slight amounts. This study tried to investigate only normal work environment conditions. Possible worker' exposure in episodes, such as spills or maintenance tasks, were not included, so detailed and consecutive supplementary studies might be required. Possible unknown reactive hazardous by-products generated in the process of semiconductor industry processes should be evaluated in future studies too.
Appendix 1
Measured substances
*Category: 1) Human carcinogens related with leukemia, 2) Chemicals with hematologic toxicity, 3) Reproductive toxic materials, 4) Regulated chemical substance.
Appendix 2
Exposure criteria of measured substances
KOEL: Korea Occupational Exposure Limits, ACGIH: The American Conference of Governmental Industrial Hygienists, OSHA: Occupational Safety and Health Administration, NIOSH: The National Institute for Occupational Safety and Health, TWA: time-weighted average, STEL: short-term exposure limit, AIHA: American Industrial Hygiene Association.
Appendix 3
Concentrations of measured substances on the 1st floor
OEL: occupational exposure limits, ND: non-detectable, CVD: chemical vapor deposition.
Appendix 4
Concentrations of measured substances on the 2nd floor
OEL: occupational exposure limits, ND: non-detectable, CVD: chemical vapor deposition.
Footnotes
No potential conflict of interest relevant to this article was reported.
References
- 1.Woskie SR, Hammond SK, Hines CJ, Hallock MF, Kenyon E, Schenker MB. Personal fluoride and solvent exposures, and their determinants, in semiconductor manufacturing. Appl Occup Environ Hyg. 2000;15:354–361. doi: 10.1080/104732200301476. [DOI] [PubMed] [Google Scholar]
- 2.Scarpace L, Williams M, Baldwin D, Stewart J, Lassiter DV American Conference of Governmental Industrial Hygienists, editor. Hazards assessment and control technology in semiconductor manufacturing. Chelsea: Lewis Publishers; Results of industrial hygiene sampling in semiconductor manufacturing operations; pp. 47–52. [Google Scholar]
- 3.Nichols L, Sorahan T. Cancer incidence and cancer mortality in a cohort of UK semiconductor workers, 1970-2002. Occup Med (Lond) 2005;55:625–630. doi: 10.1093/occmed/kqi156. [DOI] [PubMed] [Google Scholar]
- 4.McElvenny DM, Darnton AJ, Hodgson JT, Clarke SD, Elliott RC, Osman J. Investigation of cancer incidence and mortality at a Scottish semiconductor manufacturing facility. Occup Med (Lond) 2003;53:419–430. doi: 10.1093/occmed/kqg111. [DOI] [PubMed] [Google Scholar]
- 5.Beall C, Bender TJ, Cheng H, Herrick R, Kahn A, Matthews R, Sathiakumar N, Schymura M, Stewart J, Delzell E. Mortality among semiconductor and storage device-manufacturing workers. J Occup Environ Med. 2005;47:996–1014. doi: 10.1097/01.jom.0000183094.42763.f0. [DOI] [PubMed] [Google Scholar]
- 6.LaDou J. Health issues in the global semiconductor industry. Ann Acad Med Singapore. 1994;23:765–769. [PubMed] [Google Scholar]
- 7.LaDou J, Bailar JC., 3rd Cancer and reproductive risks in the semiconductor industry. Int J Occup Environ Health. 2007;13:376–385. doi: 10.1179/oeh.2007.13.4.376. [DOI] [PubMed] [Google Scholar]
- 8.Kim EA, Lee HE, Kang SK. Occupational burden of cancer in Korea. Saf Health Work. 2010;1:61–68. doi: 10.5491/SHAW.2010.1.1.61. [DOI] [PMC free article] [PubMed] [Google Scholar]
- 9.Gordon V. LogNorm 2: Statistics for exposure assessment [CD-ROM] Amer Industrial Hygiene Assn; 2006. [Google Scholar]
- 10.LaDou J. Health issues in the microelectronics industry. Occup Med. 1986;1:1–11. [PubMed] [Google Scholar]
- 11.Wald PH, Jones JR. Semiconductor manufacturing: an introduction to processes and hazards. Am J Ind Med. 1987;11:203–221. doi: 10.1002/ajim.4700110209. [DOI] [PubMed] [Google Scholar]
- 12.National institutes for occupational safety and health. Health hazard evaluation determination. Cincinnati (OH): U.S. Department of Health, Education, and Welfare; 1977. Report No.: 77-101-376. [Google Scholar]
- 13.Corn M, Cohen R. Real-time measurement of sub-PPM concentrations of airborne chemicals in semiconductor manufacturing. J Expo Anal Environ Epidemiol. 1993;3(Suppl 1):37–49. [PubMed] [Google Scholar]
- 14.Hallock MF, Hammond SK, Kenyon E, Smith TJ, Smith ER. Assessment of task and peak exposure to solvents in the microelectronics fabrication industry. Appl Occup Environ Hyg. 1993;8:945–954. [Google Scholar]


