

Abstract
Typically, stimulus batteries used to characterize sensory neural coding span physical parameter spaces (e.g., concentration: from low to high). For awake animals, however, psychological variables (e.g., pleasantness/palatability) with complicated relationships to the physical often dominate neural responses. Here we pit physical and psychological axes against one another, presenting awake rats with a stimulus set including 4 NaCl concentrations (0.01, 0.1, 0.3, and 1.0 m) plus palatable (0.3 m sucrose) and aversive (0.001 m quinine) benchmarks, while recording the activity of neurons in two sites vital for NaCl taste processing, gustatory cortex (GC) and central amygdala (CeA). Since NaCl palatability (i.e., preference) follows a non-monotonic, “inverted-U-shaped” curve while concentration increases monotonically, this stimulus battery allowed us to test whether GC and CeA responses better reflect external or internal variables. As predicted, GC single-neuron and population responses reflected both parameters in separate response epochs: sodium concentration-related information appeared with the earliest taste-specific responses, giving way to palatability-related information, in an overlapping subset of neurons, several hundred milliseconds later. CeA single-neuron and population responses, meanwhile, contained only a brief period of concentration specificity, occurring just before palatability-related information emerged (simultaneously with, or slightly later than, in GC). Thus, cortex and amygdala both prominently reflect NaCl palatability late in their responses; CeA neurons largely respond to either palatable or aversive stimuli, while GC responses tend to reflect the entire palatability spectrum in a graded fashion.
Introduction
Much of what neuroscientists know about sensory coding has been learned from examinations of neural responses to stimulus batteries varying along physical dimensions: brightness, contrast, or orientation of visual stimuli (Geisler et al., 2007; MacEvoy et al., 2009); frequency or loudness of auditory stimuli (Sadagopan and Wang, 2008); and carbon chain length or concentration of olfactory stimuli (Uchida et al., 2000; Stopfer et al., 2003). Behaviorally relevant stimulus parameters are often psychological rather than physical (Berridge, 2004; Haddad et al., 2010; Serences and Saproo, 2010), however. Palatability, the property of a taste determined by an animal's preference for and reaction to that taste (Breslin et al., 1992), is poorly related to any single physical parameter; while animals are born with particular likes and dislikes (Chandrashekar et al., 2006), taste palatability is affected by a host of extrinsic factors, including satiety (Berridge, 1991) and experience (Galef, 1986; Spector et al., 1988; Fortis-Santiago et al., 2010).
This nonphysical taste property is reflected in firing rates observed within specific periods of rat gustatory cortical (GC) single neuron responses: while the first of two information-rich GC taste-response epochs (0.2–0.8 s following stimulus administration) (Katz et al., 2001) reflects taste identity, the subsequent epoch (beginning ∼0.8 s following stimulus administration) (Katz et al., 2001) appears to track palatability across contexts and experience (Katz et al., 2001; Fontanini and Katz, 2006; Grossman et al., 2008). One could argue that GC cares more about palatability than stimulus identity.
It remains possible, however, that these late responses might reflect physical stimulus parameters (which were not varied in the abovementioned studies), rather than psychological parameters, if each was a viable option. Here, we present this precise experiment. We delivered four concentrations of NaCl (0.01, 0.1, 0.3, and 1.0 m), as well as sucrose and quinine (benchmark palatable and unpalatable stimuli) to awake rats, while recording single-neuron responses in two forebrain regions known to play roles in NaCl processing: GC (Pritchard et al., 1999; Mathy et al., 2003; Mak et al., 2005) and central amygdala (CeA) (Galaverna et al., 1992, 1993; Scott et al., 1993; Seeley et al., 1993; Zardetto-Smith et al., 1994; Nishijo et al., 1998), the latter a target of both GC and taste brainstem. The value of this stimulus battery is that it allows dissociation of physical and psychological coding, because sodium palatability follows a non-monotonic function—first increasing and then decreasing (Leander, 1987; Breslin et al., 1993; Zardetto-Smith et al., 1994; Curtis et al., 2001)—at the same time that neural responses vary monotonically with changes in chemosensory stimulus concentration (Nishijo and Norgren, 1990; Duchamp-Viret et al., 2000; St John and Smith, 2000; Wachowiak et al., 2002; Chen et al., 2011).
We were thus able to test the following predictions: (1) that GC firing rates would reflect sodium concentration until ∼0.8 s, and palatability thereafter and (2) that CeA responses would also contain both concentration- and palatability-related information. We further predicted, on the basis of our previous data from basolateral amygdala (Fontanini et al., 2009) and known amygdala-cortical connectivity (McDonald, 1998), that (3) palatability coding would appear simultaneously in GC and CeA.
Our results, which confirmed most (but not all) of our predictions, provide a clearer understanding of the emergence of value-related population responses in forebrain temporal codes.
Materials and Methods
Subjects
Female Long–Evans rats (n = 13; 250–320 g at time of surgery) served as subjects in this study. Rats were maintained on a 12 h light/dark schedule and were given ad libitum access to chow and restricted access to water where specified. All methods complied with the Brandeis University Institutional Animal Care and Use Committee guidelines.
Surgery
Rats were anesthetized using an intraperitoneal injection of a ketamine/xylazine/acepromazine mixture (100 mg/kg, 5.2 mg/kg, and 1 mg/kg, respectively), with supplemental intraperitoneal injections administered as needed. The anesthetized rat was placed in a standard stereotaxic device, where its scalp was excised, and holes were bored in its skull for the insertion of 0–80 ground screws and electrodes. Multi-electrode bundles [16 nichrome microwires attached to a microdrive (Katz et al., 2001)] were inserted 0.5 mm above GC [anteroposterior (AP) 1.4 mm and mediolateral (ML) 5 mm relative to bregma (Paxinos and Watson, 1998); and dorsoventral (DV) 4.5 mm from dura] and 0.5 mm above rostral CeA [AP 2.1 mm and ML 4.0 mm relative to bregma (Paxinos and Watson, 1998); and DV 6.4 mm from the dura]. Once in place, the assemblies were cemented to the skull, along with two intra-oral cannulae (IOCs; Fontanini and Katz, 2006), using dental acrylic. Rats were given 3 d to recover from the surgery before beginning adaptation to the experimental procedures.
Preference assessment
A set of rats (n = 4) not used for electrophysiology was adapted to handling and placed on a 22 h water restriction protocol, with water provided in the home cage after handling, adaptation, or testing. Testing took place in the Davis MS-160 “brief access” Lickometer rig (DiLog Instruments). During the first 2 d of habituation, rats were placed in the Davis rig and allowed to drink water from a single tube continuously for 30 min. On the last 2 d, the rat received periodic brief access (15 s) to one of seven stainless steel drinking tubes on a moveable carousel, each filled with water, for 35 min.
Finally, each rat received three 35 min testing sessions, on consecutive days, during which taste solutions (0.00, 0.01, 0.10, 0.30, and 1.0 m NaCl, 0.3 m sucrose, and 0.001 m quinine) were presented in a (blocked) randomized order. Presentations began with the automated raising of a shutter, such that the lick spout was exposed. If no lick was recorded within 60 s of spout presentation, the shutter closed and the tube holder moved on to the next tastant; these empty trials were dropped from the subsequent analysis. Once a lick was noted (via a low-current circuit), the solution was presented for 15 s (this guaranteed that lick counts were not confounded with latency to first lick), after which the shutter came back down and a 10 s interval separating each presentation began. The average number of licks across the 15 s of availability, compared with that for water, was used to measure preference (Breslin et al., 1993) without a disproportionate amount of lick-rate adaptation (Smith et al., 1992); solutions preferred compared with water are here characterized as “palatable,” whereas solutions that rats drank less of than water are characterized as “aversive.” There was no decrement in lick rate across the 35 min sessions, suggesting little influence of postingestive effects during taste preference assessment (data not shown).
Licking was analyzed here instead of overt orofacial behaviors (“taste reactivity”; Grill and Norgren, 1978b), despite the fact that the latter are often used to measure large differences in palatability (Berridge et al., 1984), because taste reactivity is unlikely to be sensitive enough to reliably measure the reliable but subtle palatability differences between low and moderate NaCl concentrations (Grill and Norgren, 1978b; see Discussion). While this meant that taste preferences and neural responses were necessarily collected from separate sets of rats (stimulus control requirements dictated our need to deliver tastes directly and reliably to large sections of the tongue's surface in recording sessions, a control that cannot be achieved using licking), we hasten to note that the separate measurement of palatability actually adds to the conservatism of the analyses described below: any contextual variability introduced because of using different rats for behavioral and electrophysiological experiments can only serve to lower the upper limit of observable brain-behavior correlations, and thus to make any strong correlations more meaningful.
Behavioral adaptation and stimulus delivery for electrophysiology
Three days following surgery, each animal in the electrophysiology experiment (n = 9) began 2 d of adaptation to handling. Afterward, each animal was placed on a water-restriction regimen (2 h of water per day), acclimatized to the experimental environment for 2 d, and adapted to 40 μl water deliveries through the IOC for another 2 d. Once so acclimated, animals were, once per day, exposed to the experimental taste array (distilled water, four concentrations of NaCl [0.01, 0.1, 0.3, 1.0 m] plus 0.3 m sucrose and 0.001 m quinine) through a manifold of fine polyimide tubes inserted to 0.5 mm past the end of the IOC (eliminating any chance of mixing), and locked onto the dental acrylic cap. Every 30 s, for a minimum of 10 blocks of six deliveries per block, computer-controlled solenoid valves ejected a (pseudorandomly selected) taste directly into the mouth of the rat under nitrogen pressure (in four sessions with >10 deliveries per session; all analyses were restricted to the first 10 deliveries). An H2O rinse was delivered through the contralateral cannula 15 s following each taste delivery. Total fluid delivered was 4.8 ml per 30 min recording session, after which animals had ad libitum access to water for 90 min.
Electrophysiology
Neural signals were collected from CeA and GC during taste sampling. Differential recordings were fed into a parallel processor capable of digitizing up to 32 signals at 40 kHz simultaneously (Plexon). Discriminable action potentials of <3:1 signal/noise ratio were isolated on-line from each signal using an amplitude criterion in cooperation with a template algorithm. Discriminations were checked continuously throughout each session. Time-stamped records of stimulus onset and neuronal spikes were saved digitally, as were all sampled spike waveforms and the discrimination file (Nicolelis et al., 1997). Off-line re-analysis incorporating 3D cluster-cutting techniques confirmed and corrected on-line discriminations. Except where explicitly noted, all neurons identified via off-line sorting were included in each analysis.
Analysis
All of our analyses involve calculating response firing rates within particular time periods, extending the large multispecies corpus of studies in which concentration- and palatability-related information has been found in firing rates (Ganchrow and Erickson, 1970; Di Lorenzo and Schwartzbaum, 1982; Yamamoto, 1984; Spector et al., 1988; Scott et al., 1991; Chalansonnet and Chaput, 1998; McCaughey and Scott, 1998; Nishijo et al., 1998; Boughter et al., 1999; Duchamp-Viret et al., 2000; Katz et al., 2001; Rogers and Newland, 2002; Wachowiak et al., 2002; Taha and Fields, 2005; Tindell et al., 2006; Grossman et al., 2008; Chandrashekar et al., 2010; Haddad et al., 2010; Kvello et al., 2010). Here, we analyze the presence and timing of both properties in cortical and amygdalar taste responses, bringing an identical battery of tests to bear on responses of each region.
Basic “taste responsiveness.”
To investigate whether GC and CeA neurons responded to oral stimulus administration (i.e., changed their firing rates when tastes were on the tongue), we compared averaged (across 2.5 s) evoked firing rates to baseline firing (the 0.5 s just before stimulus delivery) using paired t tests. Neurons for which postadministration firing rates were significantly higher (excitatory responses) or lower (inhibitory responses) than pre-administration firing rates were deemed “taste-responsive.” Note that taste responsiveness is not a measure of taste specificity (which is described below), but simply a measure of whether delivery of fluid to the tongue had a measureable impact on a neuron's firing rate.
To establish the time course of taste responsiveness across the dataset (Fig. 1D,H), we restricted the aforementioned t tests to 500 ms windows of taste-evoked activity, and iterated the analysis by moving the window in 50 ms steps. To minimize the likelihood of spurious responses, we eliminated responses shorter than the size of the moving window (which were presumed to be noise).
Figure 1.
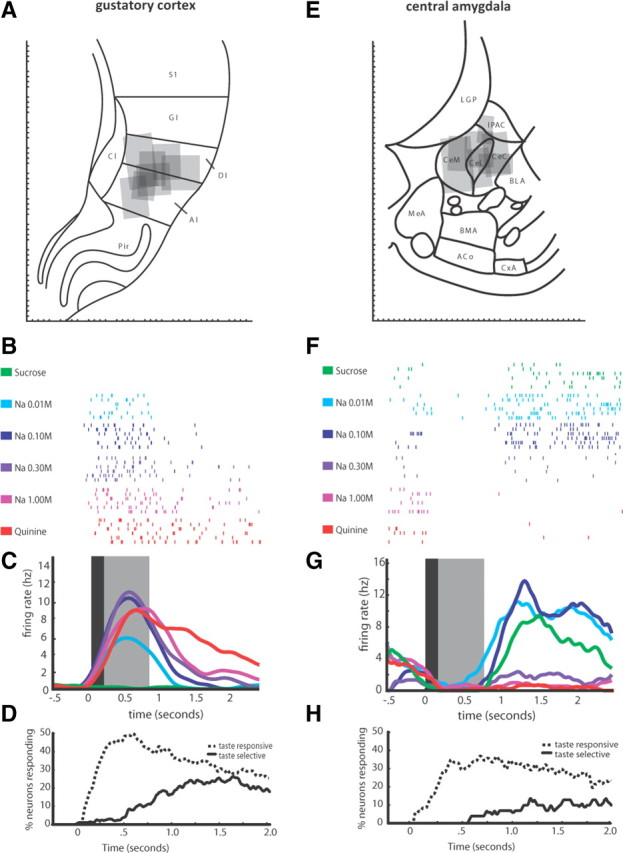
Recording taste-related responses in GC and CeA. A, Schematic representation of a coronal slice of rat brain (reprinted, in part, with permission from Paxinos and Watson, 1998) centered on GC with recording sites (gray boxes) reconstructed using electrolytic lesions marking the last recording in each animal. The angle of the box sides indicates the orientation of the implant, reconstructed from implant tracks. DI, Dysgranular insular; AI, agranular insular; S1, primary somatosensory cortex; GI, granular insular; Cl, claustrum; Pir, piriform cortex. B, Strongly taste-specific evoked spike trains from a single GC neuron following the delivery of multiple trials of the six tastes—each row is a single trial, and each hash mark is an action potential. C, Averaged PSTH of the evoked spike trains in B, smoothed with a Gaussian kernel; black shaded box denotes period of nonspecific activity in GC as noted previously (Katz et al., 2001), gray shaded box denotes period of putative GC chemosensory responsiveness, again as suggested previously (Katz et al., 2001). D, The percentage of GC neurons (y-axis) in which taste responses significantly differ from baseline firing rises at a short latency following taste delivery (dashed line); however, taste specificity (significant differences among the responses to different tastes) emerges ∼200 ms poststimulus (solid line). E, Schematic representation of a coronal slice centered on CeA [divided into central (CeC), lateral (CeL), and medial (CeM) subdivisions] with reconstructed recording sites marked as per A. BLA, Basolateral amygdala; IPAC, interstitial nucleus of the posterior limb of the anterior commissure; MeA, medial amygdala; BMA, basomedial amygdala; ACo, anterior cortical amygdaloid nucleus; CxA, Cortex-amygdala transition F, Taste-specific evoked spike trains from a single CeA neuron simultaneously recorded with the GC neuron shown in B. The same rows in B and F represent the same taste trial. G, Averaged PSTH of the evoked spike trains in F and smoothed with a Gaussian kernel; black and gray boxes as in C. H, The percentage of CeA neurons (y-axis) in which taste responses significantly differ from baseline firing also rises at a short latency following taste delivery (dashed line); however, taste specificity (significant differences among the responses to different tastes) is delayed and emerges ∼500 ms poststimulus (solid line).
“Taste specificity” of neural responses.
We defined single-neuron taste specificity in a manner akin to that used in visual neuroscience: neurons in V1 that respond broadly to bars at a range of line orientations but with a greater magnitude of response to some than others are deemed “orientation specific”; we classified an individual neuron as “taste specific” (or “concentration specific”) if it responded more strongly to (at least) one taste (of sucrose, quinine, and 0.1 m NaCl) or one NaCl concentration (of 0.01, 0.1, and 1.0 m NaCl) than to others, even if it responded to some degree to a broad range of tastes. As we cannot perfectly exclude the influence of perceived intensity between sucrose, quinine, and NaCl in potentially driving the above taste-specific responses, we restrict all further analysis of physical chemosensory coding to within-NaCl comparisons.
The direct instantiation of the above tests is a two-way ANOVA (variables: taste and time) performed on taste responses broken into five 500 ms bins (a bin size that facilitates comparison with previous reports of taste dynamics) (Katz et al., 2001). Each trial served as a repeated measurement, such that the ANOVA tested the difference between peristimulus time histograms (PSTHs): as shown previously, responses were stationary across trials (Fontanini and Katz, 2006), i.e., there was no meaningful correlation (mean r2 = 0.026) between trial number and evoked firing rate for taste-responsive neurons across 30 min. This ANOVA allowed us to identify a neuron's response as taste specific if there was either a significant main effect for taste or a significant taste-by-time interaction. Specifically, the main effect revealed significant differences among (e.g., taste specificity of) the average evoked responses; the interaction revealed taste specificity in the way responses change across time, i.e., taste temporal codes.
We established the time course of taste and concentration specificity (for Fig. 1D,H) by applying one-way ANOVAs to 500 ms windows of spiking activity evoked by each stimulus and iterating this analysis in 50 ms steps. To minimize the likelihood of spurious responses, we eliminated (presumably noise) responses shorter than the size of the moving window.
“Concentration-related” and “palatability-related” responding.
The above analyses identify neurons as responding distinctly to at least one taste or NaCl stimulus, but offer no information regarding the patterning of responses across stimuli (by “pattern” we mean, e.g., “neuron × responded more to NaCl than to quinine, but less to NaCl than to sucrose”). To characterize the content of responses in neurons identified as taste specific, we examined how, at different times poststimulus delivery, the overall pattern of a single neuron's responses correlates with known concentration and palatability relationships among the stimuli (determined by molarity and preference data, respectively). To achieve high temporal resolution, we extracted 200 ms segments of each neuron's evoked response to each of the sodium solutions (200 ms was used here, as opposed to the 500 ms windows described above, because pilot analyses revealed 200 ms to be the smallest segment size that did not produce spurious prestimulus correlations, and thus the segment that best maximized the resolution/sensitivity trade-off), and for each segment we evaluated the trial-by-trial linear correlation between these responses and both concentration and palatability. If the correlation across trials was significant, the response was labeled concentration-related or palatability-related, respectively.
The palatability function was empirically derived (Fig. 2). The concentration function was a simple monotonic increase (or decrease) with the (log) NaCl concentrations; this function was selected because the vast majority of studies examining olfactory or gustatory stimulus concentration has shown that the only (or only reliable) concentration response at the earliest stages of processing is monotonic, with a maximum at the lowest or highest concentration (Nishijo and Norgren, 1990; Duchamp-Viret et al., 2000; St John and Smith, 2000; Wachowiak et al., 2002; Chen et al., 2011). Thus, if a neuron fired 4, 3, 2, and 1 spikes/s in response to 0.01, 0.1, 0.3, and 1.0 m NaCl administration, respectively, that neuron would have a high correlation with concentration; a neuron that fired 3, 4, 4, and 1 spikes/s to those stimuli, meanwhile, would have a high correlation with the measured palatability function. The magnitude of this correlation estimates an individual neuron's “coding” of either sodium concentration or sodium palatability for that 200 ms segment. We then iterated this analysis across the responses in 20 ms steps, generating representations of concentration or palatability correlation across poststimulus time. To be conservative and minimize the intrusion of spurious correlations arising during single shifts of the moving window, we excluded periods of significant correlation that were shorter than 80% of the duration of our analysis window.
Figure 2.

Sodium palatability varies nonlinearly as a function of sodium concentration. Here, palatability is defined as the relative number of licks per 15 s of exposure, plotted as the mean number of licks to each taste (sodium, quinine, and 0.01–1.0 m NaCl) across animals (±SEM) recorded during a brief-access task, contrasted with the mean number of licks for brief presentations of distilled water. Solutions for which bars extend to the right were preferred over water, while those for which bars extend to the left were less preferable than water.
Regional population response estimation.
Because we observed a variety of concentration- and palatability-related responses (e.g., both increasing with concentration and decreasing with concentration, see below), we used a common multivariate data-reduction technique known as principal components analysis (PCA) (Hotelling, 1933) to move beyond single neuron analysis to a more direct analysis of GC and CeA population coding that easily handles such variability (rather than population PSTHs, which do not). PCA and other, related rescaling techniques (such as multidimensional scaling) are frequently used to reveal the most descriptive dimension of variation among the dozens of individual neural responses in a range of systems and species (Duchamp-Viret et al., 1990; Chapin and Nicolelis, 1999; Briggman et al., 2005; Lopes-dos-Santos et al., 2011), and have specifically been used to produce low-dimensional representations of averaged (Di Lorenzo and Schwartzbaum, 1982; Erickson et al., 1993; Scott et al., 1993; Dahl et al., 1997; St John and Smith, 2000; Verhagen et al., 2004; Kadohisa et al., 2005) and dynamic (Fontanini and Katz, 2006; Di Lorenzo et al., 2009; Chen et al., 2011) taste responses, dynamic olfactory responses (Stopfer et al., 2003; Mazor and Laurent, 2005), and patterns of similarity between odorants (Khan et al., 2007; Haddad et al., 2010). Here, neural responses were averaged across trials and binned for an initial analysis of previously described epochs (0.2–0.8 s; 0.8–2.5 s poststimulus) (Katz et al., 2001; Fontanini and Katz, 2006; Grossman et al., 2008). For each epoch, matrices of responses (taste by neuron) were input into a PCA to extract the major modes of the population response, which were then correlated with concentration and palatability functions as described above.
We tested the validity of our a priori epochal breakdown by performing an epoch-neutral analysis. The PCA was iterated on a moving window of the population response, stepped along at 50 ms increments, with each step composed of a taste-by-neuron matrix as described for the epoch-centered analysis. We again confirmed the robustness of our results to changes in window size (range: 25–700 ms); for consistency with the single-neuron analyses we used a 200 ms moving window for figures. We then checked the validity of the results of the moving window PCA analysis itself, redrawing the taste-by-neuron matrix from a resampled subset of neurons (with replacement) at 80% of total neural population for that region, and iterating for each time bin input into the PCA 500× (Kadohisa et al., 2005; Lebart et al., 2007). Linear correlations were then calculated between PCA weights for each window-step for each resampling and the palatability function. The results of this analysis allowed us to estimate confidence intervals around calculated correlations (and thus to determine whether these correlations were significantly higher than zero for those observed prestimulus). One-way ANOVA, testing for modulation in correlation across time bins, provided an estimate of when correlations changed. As an additional estimate of the time at which palatability-related firing emerged, we fit a sigmoid function (the simplest characterization of a variable that changes between two constant states within a particular time frame) with one free parameter to the mean correlation time course across sessions; the parameter α, which gives the inflection point of the fitted curve, was used as a direct measure of when correlations increased.
Single-trial firing-rate transition detection.
To investigate whether the dynamics of simultaneously recorded pairs of neurons in GC and CeA are related, we applied a technique developed for the denoising of discrete steps in genomic sequencing data (the jump model of the PWC toolkit) (Little and Jones, 2011a,b), under the assumption that spike rates in taste responses also change suddenly in single trials (this assumption has been tested and found reasonable) (Jones et al., 2007). The model characterized our millisecond-binned single-trial PSTHs as periods of stable firing separated by sudden changes, by sequentially adding discrete jumps into the function and resetting the “steady state” on either side of the jump equal to the mean of the input on either side of the jump. An integral part of the model was a penalty term that ensured that only jumps that meaningfully improved the model fit were added. The resultant functions strongly resembled those identified by Hidden Markov modeling in GC ensemble data (Jones et al., 2007), but also allowed us to identify single-trial firing-rate change times in CeA neurons, which were not recorded in large enough groups to allow such ensemble analyses.
Once the timing of transitions between firing rates for each neuron for each trial were estimated, we identified, for each neuron and for each taste, the reliable transitions closest to 1 s poststimulus on each trial (i.e., the Middle- to Late-epoch transition). We then calculated, for each simultaneously recorded amygdala-cortical pair of neurons, for every trial of taste delivery, the lag between transitions in GC and CeA, using only these transitions. These data provided much better estimates of the relationship between GC and CeA firing than those calculated using data averaged across trials and neurons.
Histology
After the final recording session, rats were deeply anesthetized with an overdose of the surgical ketamine/xylazine/acepromazine mixture and perfused first with PBS and then 5% formalin in PBS. Electrolytic lesions (0.7 mA for 1 s) made just before perfusion were examined in fixed, 0.05 mm coronal slices stained with cresyl violet, revealing the locations of recording tips in GC and CeA.
Results
Neural data overview
A total of 125 GC neurons and 59 CeA neurons were isolated during 18 sessions in nine rats. Not all implants yielded single neurons in every session: GC single neurons were isolable in 15 sessions (Fig. 1A; 8.3 ± 3.8 GC neurons per session) and CeA neurons were isolable in 16 sessions (Fig. 1E; 3.6 ± 1.3 neurons per session); at least one neuron was recorded from each structure in 13 sessions.
Each neural ensemble was challenged with 0.3 m sucrose, 0.001 m quinine, and a range of sodium chloride solutions (0.01, 0.1, and 0.3, 1.0 m). A minimum of 10 trials of each taste was delivered in each session. An initial analysis of overall taste specificity (one-way ANOVAs on firing rates averaged between 0 and 2.5 s following sucrose, quinine, and 0.1 m NaCl delivery; α set to a highly conservative 0.005) revealed that 28.8% (36/125) of the neurons in GC respond distinctly to different tastes. To test whether these ensembles were additionally able to differentiate between different concentrations of a single taste, an identical analysis was performed across responses to 0.01, 0.1, and 1.0 m NaCl. This analysis revealed that 9.6% (12/125) GC neurons respond differentially across NaCl concentrations. For the CeA population, the same test revealed that 15.2% (9/59) of CeA neurons respond distinctively to tastes of different qualities, and revealed that 6.8% (4/59) of CeA neurons respond distinctively to different NaCl concentrations (at p < 0.005, this number is almost 14 times chance). These numbers are broadly consistent with previously published data (Nishijo et al., 1998; Katz et al., 2001), although differences in stimulus batteries and numbers of trials per tastes make precise comparisons difficult, and establish that both cortical and amygdalar populations produce distinctive responses across both taste quality and taste concentration.
As analyses that average across such long response periods can obscure transient but reliable modulations (Katz et al., 2001), we next divided evoked responses into 500 ms bins and re-evaluated taste specificity and concentration specificity using two-way (taste × time) ANOVAs. Despite again starting with a highly conservative significance criterion (p < 0.005), 44.8% (56/125) of the neurons in GC could now be identified as responding in a taste-specific manner (showing either a significant effect of taste or a significant taste × time interaction) with this analysis, and 22.4% (28/125) responded differentially across taste concentrations. Likewise in the CeA, when responses were divided into 500 ms bins and re-evaluated using two-way (taste × time) ANOVAs, 30.4% (18/59; >60× chance) of the neurons could be identified as responding in a taste-specific manner, and 15.2% (9/59; >30× chance) as responding differentially to different taste concentrations (both, p < 0.005).
Figure 1 explores these dynamics in more detail, showing taste responses (spike train rasters and PSTHs) of simultaneously recorded GC (Fig. 1B,C) and CeA neurons (Fig. 1F,G). Previously described GC neural dynamics (Katz et al., 2001) are clearly visible in Figure 1B,C; following stimulus delivery, the initial 200 ms of response (a time period that we have called the Early epoch, black background) was nonspecific (in this case, there was little spiking to any taste), the next 600 ms of response (the period that we have called the Middle epoch, gray background) was taste specific (most notably, the sucrose response was quite distinct), and response order changed at ∼800 ms into the response (the period that we have called the Late epoch, white background). The responses of the CeA neuron shown in Figure 1F,G appear to follow a similar clock, differing mainly in the specifics of what happens in each response epoch [as is true in basolateral amygdala (BLA)] (Fontanini et al., 2009): the spike rates drop during the Early epoch and remain inhibited during the Middle epoch. Pronounced excitatory responses to a subset of tastes then appear at approximately the onset of the Late epoch.
Statistical analysis showed these exemplars to be largely (although not perfectly) representative of their respective populations. In agreement with earlier reports (e.g., Katz et al., 2001), differences between responses to tastes of different qualities (quinine, sucrose, and 0.1 m NaCl again used as a standard) among the GC neurons rose to significance 200 ms following stimulus delivery (Fig. 1D, dashed line denotes the percentage of neurons for which responses differed between tastes). This taste specificity emerged as the overall magnitude (of either inhibition or excitation) of the taste responsiveness declined (Fig. 1D, solid line denotes the percentage of neurons for which responses differed significantly, either positively or negatively, from baseline); in fact, the largest amplitude of poststimulus firing was short latency and taste nonspecific, as per previous results for GC (Katz et al., 2001) and BLA (Fontanini et al., 2009).
As a population, CeA time-varying taste responses resembled those just described for GC responses in several ways: (1) CeA neurons responded significantly to tastes at a relatively short latency (Fig. 1H, dotted line) and (2) these early responses lacked significant taste specificity (Fig. 1H, note the late rise of solid line). Unlike in GC, however, the period of nonspecific responding was protracted, lasting until ∼600 ms following taste delivery. Despite the presence of a monosynaptic pathway connecting taste-responsive brainstem regions and CeA (Norgren, 1976), we were unable to observe taste specificity by this measure in CeA responses during most of the Middle epoch (a period during which, again, GC neurons were responding in a robustly taste-specific manner) (Fig. 1D). In fact, 7% of the CeA sample was entirely inhibited during much of the first second of their responses, firing almost no spikes to any taste that we delivered across several hundreds of milliseconds (e.g., Fig. 1F,G). While this fact may partly reflect the absence of an acid stimulus (the fourth “primary taste”) (Erickson, 1984) from our battery, we consider it likely that little taste specificity exists in CeA before the Late epoch (see Discussion).
Rats prefer moderate concentrations of NaCl
To assess the relationship between neural responses and palatability, we had rats perform a brief-access preference assay—an objective measure of taste palatability. In this assay, the palatability of our NaCl solutions proved to range from mildly positive for low concentrations, to more highly positive for moderate concentrations, to negative as concentration increased further (Fig. 2). Though the peak in preference for 0.1 m NaCl was not as high as that reported in some studies (Breslin et al., 1993), the palatability of NaCl exceeded that of water at 0.1 and 0.3 m, and our data were better described by an inverted-U-shaped quadratic function of the (log) concentration (− 27x2 − 67x + 30, r2 = 0.17) than by an equivalent monotonic sigmoid fit that would suggest a simple decreasing palatability function with high concentrations 12/(1 + e∧(− 2*(x − 28)) + 48, r2 = 0.001). That is, the function is better thought of as non-monotonic than as simply dropping at high concentrations. As expected, sucrose was highly palatable and quinine was highly aversive.
GC single neuron responses reflect the physical aspects of taste before the psychological
A cursory inspection of average evoked firing rates suggested that both sodium concentration and taste palatability are explicitly reflected in GC single neuron responses. Figure 3A, for instance, shows a neuron that produced distinct responses to different NaCl concentrations. This neuron's responses to 0.01, 0.1, and 1.0 m NaCl differed from baseline firing, and a (significant) trend of decreasing firing rates with increasing concentration can be seen, as has been reported in other studies of GC in awake rodents (Yamamoto et al., 1984). Across the GC sample, similar numbers of neurons with significant correlations with (log) concentration (over >2 s of averaged poststimulus response) were driven more strongly by dilute and high concentrations of NaCl (at p < 0.01, these numbers were 6 and 5 neurons, respectively). Preliminary analyses failed to reveal any obvious differences between these groups of neurons (with regard to the findings below); they were therefore treated as a single group.
Figure 3.

Single GC neurons reflect sodium concentration and sodium palatability in distinct response epochs. A, PSTHs for an individual neuron, which produced significant responses (i.e., firing rates that differed from baseline) to 0.01, 0.1, and 1.0 m NaCl, for which the overall NaCl response pattern appeared to reflect sodium concentration. B, The magnitudes of correlation between the responses of the neuron in A and sodium concentration (gray line) or sodium palatability (black line). The solid sections of each line mark bins in which that correlation achieved significance (p < 0.05). C, PSTHs for an individual neuron, which produced significant responses to 0.01, 0.1, 0.3, and 1.0 m NaCl, for which the overall NaCl response pattern appeared to reflect sodium palatability D, The magnitudes of correlation between the responses of the neuron in C and sodium concentration (gray line) or sodium palatability (black line). The solid sections of each line mark bins in which that correlation achieved significance (p < 0.05). E, The mean correlation (±SEM) between neural response and either sodium concentration (gray line) or sodium palatability (black line), averaged across all neurons with significant correlations with concentration or palatability; correlation with concentration rose above initial correlation (p < 0.05; significant bins marked by gray horizontal bar) at 120 ms poststimulus, while correlation with palatability rose at a delay, achieving a significant increase (p < 0.05; significant bins marked by black horizontal bar) 940 ms poststimulus. F, the numbers of GC neurons that produced responses significantly (p < 0.05) correlated with concentration (gray) and palatability (black) in the Middle and Late epochs, underlying the effect see in E.
The neuron shown in Figure 3B, meanwhile, for which responses to 0.01, 0.1, 0.3, and 1.0 m NaCl differed from baseline, reflected sodium palatability—the response to high-concentration NaCl was significantly larger than those to lower concentrations, and similar to that of quinine, as would be expected of a neuron that was not only coding the relative palatability of sodium solutions, but palatability among all tastes. In neurons showing significant correlations with taste palatability (calculated on 2 s of poststimulus response), we saw “best” responses to both high and low concentration NaCl; an equal number of these neurons responded most strongly to the least palatable NaCl concentration and to the most palatable (at p < 0.01; those numbers were 3 and 3, respectively).
We predicted that GC neural responses would reflect taste concentration early, and that later portions of the responses would reflect the palatability of the different NaCl solutions, with the transition from concentration- to palatability-related responding specifically occurring late in the first second of the taste response (a time point that precedes the onset of palatability-specific taste reactivity emitted in response to quinine and sucrose delivery) (Travers and Norgren, 1986). To test these predictions, we recalculated correlations between the responses and concentration/palatability in 200 ms windows, stepping through the responses in 20 ms increments. The results of this calculation for the single neurons in Figure 3, A and C, are plotted in Figure 3, B and D, respectively. For the PSTHs in Figure 3A, the correlation with sodium concentration attains significance (p < 0.05) 300 ms following stimulus delivery, near the beginning of the predicted “chemosensory-epoch,” and is sustained through the remainder of the evoked response; significant palatability-related firing emerges only after 1.5 s (Fig. 3C). The PSTHs shown in Figure 3B, meanwhile, are significantly correlated (p < 0.05) with sodium palatability (Fig. 3D), a correlation that becomes significant 500 ms following taste delivery.
The moving-window correlations shown in Figure 3,C and D, were performed for each neuron in our GC sample, and the results averaged across neurons. Figure 3E presents the result of this analysis: across the sample, there was an early rise in concentration-related firing (gray line) that became significant (p < 0.05) 120 ms after stimulus delivery (gray horizontal bar marks bins above baseline), rose to a peak 600 ms after stimulus delivery, and slowly declined throughout the remainder of the response. The rise in sodium palatability-related firing (black line), meanwhile, occurred much later, achieving significance (p < 0.05) 940 ms after stimulus delivery (black horizontal bar marks bins above baseline).
To allay the reasonable concern that a single neuron with a large correlation might have driven the results shown in Figure 3E, we asked how many single neurons produced concentration- and/or palatability-correlated (at the p < 0.05 level) responses within particular epochs. Figure 3F shows that few GC responses were significantly correlated with palatability in the Middle epoch, but that more palatability correlations attained significance in the Late epoch. At the same time, there was a negligible change in the number of neurons with a significant correlation with sodium concentration from the Middle to Late epoch.
GC transitions from concentration- to palatability-related population codes
While some GC taste-responsive neurons appear to reflect concentration in the Late epoch (Fig. 3E,F), this appearance may be deceiving: palatability and concentration patterns are not perfectly orthogonal from one another, so sodium concentration-specific responses may be embedded in larger palatability-specific responses. For both of the neurons shown in Figures 1C and 3A, for instance, responses to the least palatable sodium concentration (1 m) were most similar to quinine responses and responses to the more palatable and dilute concentrations of sodium were most similar to sucrose responses. This pattern was observed in 10/11 (a percentage significantly higher than chance, χ2 = 4.755, df = 1, p < 0.05) of the Figure 3F neurons whose Late-epoch NaCl responses both had a significant correlation with sodium concentration and patterned with sucrose and quinine according to palatability. Thus, the above analyses may underestimate the proportion of neurons truly contributing to palatability coding, and overestimate the importance of concentration, in Late epoch activity.
To assess this possibility, we performed an independent analysis of population coding, using a simple data reduction technique to explore the single best description of the population of GC taste responses at each moment in time. Specifically, we brought PCA (Hotelling, 1933), a technique frequently used for the precise purpose of distilling the nature of a “population code” (i.e., the primary source or sources of variability contributing to complex multivariate data) (Chapin and Nicolelis, 1999), to bear on our population responses. PCA has previously revealed both concentration-related (Duchamp-Viret et al., 1990; Stopfer et al., 2003) and palatability-related information (McCaughey and Scott, 1998; Fontanini and Katz, 2006; Grossman et al., 2008; Haddad et al., 2010) in chemosensory neural populations. As a basic, much-used assay of population coding, this analysis tests and extends our single-neuron analyses, allowing us to determine whether our characterization of subsets of GC neurons reveals reliable facets of GC population taste responses.
In the GC population response (N = 125) to our taste battery, the information embedded in PC1 differed at different poststimulus times, as predicted by the single-neuron results: during the Middle epoch (200 and 800 ms after stimuli were delivered), PC1 (which during this period accounted for 41% of the total response variance) clearly reflected concentration (Fig. 4A), as the GC population response to different concentrations of sodium during this time period followed almost linearly the (log) sodium concentration. The lowest concentration NaCl was most different from the highest concentration NaCl, with intermediate concentrations more similar to adjacent concentrations than more distant concentrations. The correlation between (log) NaCl concentration and PC1 during this period was highly significant (r2 = 0.99; p < 0.005), whereas there was no meaningful correlation between PC1 and sodium palatability (p = 0.35).
Figure 4.
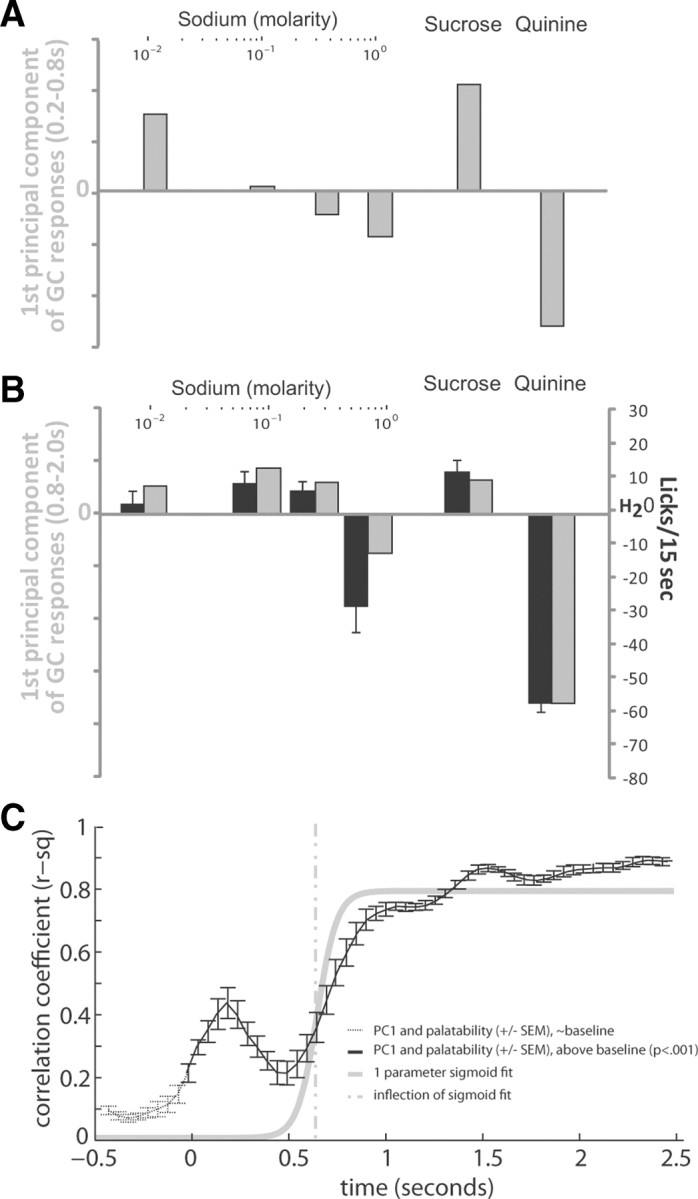
The entire GC population reflects taste concentration and taste palatability sequentially. A, The first principal component of the evoked population response (gray bars) within a previously identified chemosensory processing period (Katz et al., 2001). B, The first principal component of the evoked population response (gray bars) within previously identified palatability processing period (Katz et al., 2001; Grossman et al., 2008) is presented along with preference behavior (black bars, reprinted from Fig. 2). C, The correlation (mean ± SEM) of PC1 of the population response (200 ms evoked response window of an 80% bootstrapped sample of GC neurons) with preference behavior through time holding at low levels, prestimulus (black dotted line) and rising significantly twice following stimulus delivery (black solid line). A one parameter sigmoid fit to the correlation between population response and palatability (gray solid line) models this rise in correlation, with the inflection point of the sigmoid fit (gray dotted line) marking the onset of palatability in the population response.
During the Late (0.8–2 s) epoch, in contrast, PC1 of the NaCl-evoked GC responses reflected palatability (Fig. 4B, gray bars; during this period, PC1 reflected 73% of the total variance in the population response). The close match between preference behavior (reprinted from Fig. 2) and neural response is easily seen: by both measures, responses to increasing concentrations of NaCl form a shallow inverted-U. The correlation between the primary component the GC taste responses and the mean behavioral response to these stimuli was significant across all tastes (r2 = 0.91, p < 0.005) and across just the sodium stimuli (r2 = 0.92, p < 0.005). There was no meaningful correlation between (log) NaCl concentration and PC1 (p = 0.28). Thus, while both concentration and palatability appeared in GC single neuron responses, the latter property dominates the population code in the Late epoch.
To determine more precisely when the transition between concentration and palatability regimes occurred in the population code, we iterated the PCA on the GC population response in a 200 ms response window (iterated 500× as per the resampling described above), stepping the analysis window through poststimulus time by 50 ms intervals, and calculated the correlation between PC1 and the behavioral response function for every time interval. Note that this analysis, like that shown in Figure 3C, makes no a priori assumptions about the actual timing of epochal changes, instead letting the data speak for themselves.
The result of this analysis is shown in Figure 4C: the correlation between PC1 and palatability became significant (Tukey–Kramer, p < 0.001) immediately following stimulus delivery (Fig. 4C, black solid line), but correlations >0.5 (asymptoting above r2 = 0.8) appeared only in the latter half of the first second of the response. By fitting the correlation time series with a sigmoid function (Fig. 4C, gray solid line), we were able to estimate the center of the rise in the correlation (technically α, see Materials and Methods). Of course, α changed slowly and approximately linearly as window size was varied between 25 and 700 ms, occurring as early as 660 ms (Fig. 4C, gray dashed line), and no later than 975 ms, poststimulus. This range is in broad agreement with a bin-by-bin (Tukey–Kramer) analysis of when the correlation in the 500—1000 ms period became significantly different from that in the 0—500 ms period (850 ms; Tukey–Kramer, p < 0.001).
In summary, the GC population as a whole uniquely reflects a taste's concentration early in the response. Between 500 and 1000 ms, however, the population response increasingly reflects the palatability of that taste, until the majority of variance in the population response between tastes is well described by taste palatability. These results provide strong confirmation of the robustness of the single-neuron results, presented earlier.
CeA single-neuron activity also reflects both NaCl concentration and palatability
As mentioned above and in Figure 1E–G, the dynamics of CeA neurons seem quite similar to those reported for neurons in the GC. To determine whether these appearances were valid, the same analyses brought to bear on single GC single neurons were repeated on the CeA sample, starting with single-neuron moving correlations. For the PSTHs in Figure 5A, the correlation with concentration-related firing (Fig. 5B) attains significance 700 ms after stimulus delivery. The PSTHs shown in Figure 5C, meanwhile, become significantly correlated with sodium (and full taste battery) palatability somewhat later, 1 s after taste delivery (Fig. 5D).
Figure 5.

Single CeA neurons reflect sodium concentration and sodium palatability in distinct response epochs. A, PSTHs for an individual neuron, which produced significant responses (i.e., firing rates that differed from baseline) to 0.01, 0.1, 0.3, and 1.0 m NaCl, for which the overall NaCl response pattern appeared to reflect sodium concentration. B, The magnitudes of correlation between the responses of the neuron in A and sodium concentration (gray line) or sodium palatability (black line). The solid sections of each line mark bins where that correlation achieved significance (p < 0.05). C, PSTHs for an individual neuron, which produced significant responses to 0.01 and 1.0 m NaCl, for which the overall NaCl response pattern appeared to reflect sodium palatability. D, The magnitudes of correlation between the responses of the neuron in C and sodium concentration (gray line) or sodium palatability (black line). The solid sections of each line mark bins where that correlation achieved significance (p < 0.05). E, The mean correlation (±SEM) between neural response and either sodium concentration (gray line) or sodium palatability (black line), averaged across all neurons with significant correlations with concentration or palatability; correlation with concentration significantly rose above zero (p < 0.05; significant bins marked by gray horizontal bar) at 380 ms poststimulus, while correlation with palatability rose at a delay, achieving a significant increase 740 ms poststimulus (p < 0.05; significant bins marked by black horizontal bar). F, the numbers of neurons that produced responses significantly (p < 0.05) correlated with concentration (gray) and palatability (black) in the Middle and Late epochs.
To look beyond these exemplars, we averaged the correlations with sodium concentration or palatability across the entire CeA sample. The result of this averaging is shown in Figure 5E. In CeA, as in GC, there was a differential onset in coding between concentration (gray line) and palatability (black line): unlike in GC, however, neither correlation exceeded zero significantly (p < 0.05) until 380 ms after taste delivery (gray and black horizontal barks mark bins significantly above zero for concentration and palatability, respectively), a result that partly reflects strong inhibition present in taste responsive neurons for the first 500 ms; after this interval, there is a lasting rise in correlation with concentration (gray line) that becomes significant at 380 ms (horizontal gray bar), almost immediately followed by a more gradual rise in correlation with sodium palatability (black line) that becomes significant at 740 ms (horizontal black line). Thus, CeA responses resemble GC responses in coding concentration first and then palatability, but differ in that concentration coding (and, in fact, taste specificity) emerges later.
Figure 5F reveals, as expected, that very few neurons in the Middle epoch were significantly (p < 0.05) correlated with either function, and that palatability-related responses dominated (slightly) in the Late epoch.
CeA transitions from concentration- to palatability-related population codes
If these observed CeA single-neuron results are to be given credence, it is important to perform an independent test of what perceptual properties are coded by the population of CeA neurons as a whole, and when in the population response these codes appear. We therefore applied the same PCA analysis previously brought to bear on GC to the entirety of the CeA population (N = 59).
The results, displayed in Figure 6, look remarkably similar to those in GC. The Middle epoch first PC (Fig. 6A), which explains 41% of the total variance, tracks sodium concentration faithfully (r2 = 0.93, p < 0.05) and does not well reflect sodium response's palatability (r2 = 0.31, p = 0.44). The first PC from the Late epoch (Fig. 6B), meanwhile, bears a striking resemblance to both preference behavior and the late population response in GC (Fig. 4B): this pattern, which explains 48% of the total variance, follows our behavioral measure of palatability faithfully across all tastes (r2 = 0.98, p < 0.005) and across sodium responses analyzed alone (r2 = 0.97, p < 0.05). The reason for this strong effect is simple: almost half of the CeA neurons that responded distinctly to NaCl concentrations showed this palatability-related pattern, and no alternate patterns appeared more than once in the remaining responses.
Figure 6.
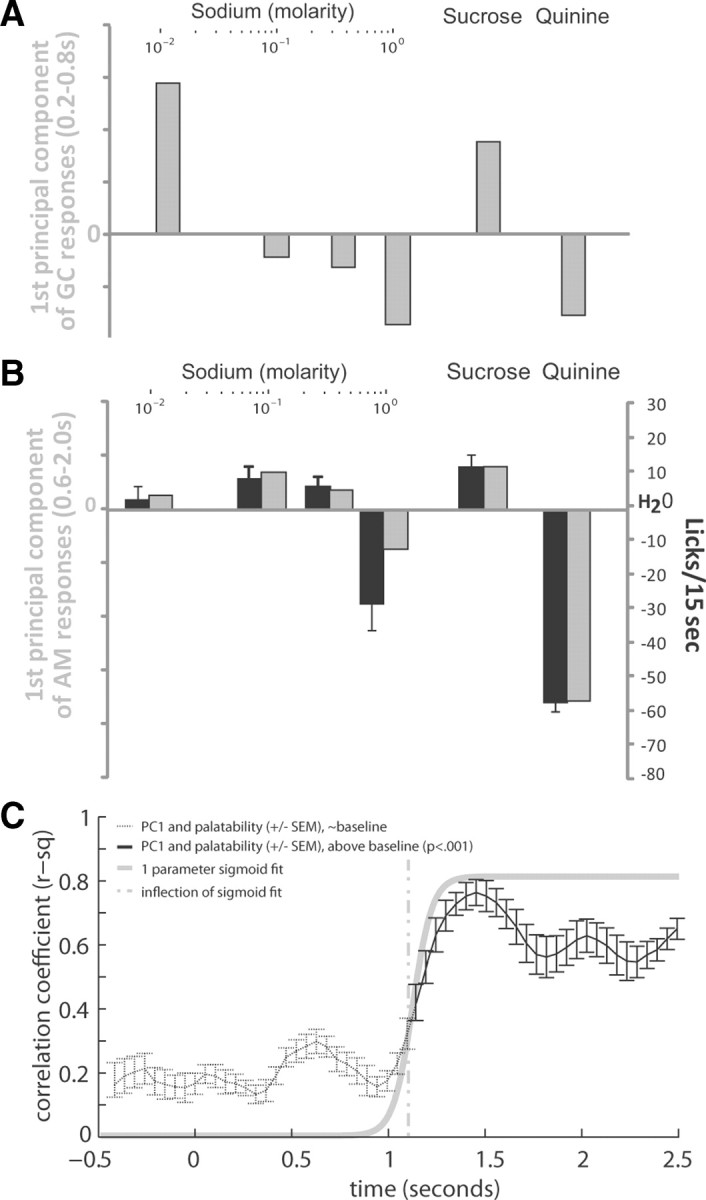
The CeA population response reflects both taste concentration and palatability. A, The first principal component of the evoked CeA population response (gray bars) within the putative GC chemosensory processing period (the same processing period as in Fig. 4A). B, The first principal component of the CeA's evoked population response (gray bars) within previously identified GC palatability processing period (the same period as in Fig. 4B), presented alongside preference behavior (black bars, reprinted from Fig. 2). C, The correlation (mean ± SEM) of PC1 of the population response (200 ms evoked response window of an 80% bootstrapped sample of GC neurons) with preference behavior through time holding at low levels, from before the stimulus is delivered until 900 ms poststimulus (black dotted line), and rising significantly above baseline at 1.15 s poststimulus (black solid line). A one parameter sigmoid fit to the correlation between population response and palatability (gray solid line) models this rise in correlation, with the inflection point of the sigmoid fit (gray dotted line) marking the onset of palatability in the population response.
The result of iterating the PCA over a 200 ms moving window of the evoked response (resampled as in GC), an analysis that preselects neither neuron nor time period, is shown in Figure 6C: there is a rise in correlation from baseline levels beginning late in the first poststimulus second (Fig. 6C, solid black line). We determined the time at which this rise in correlation reached half-maximal levels through the same single-variable sigmoid fit used with GC data (Fig. 6C, solid gray line). By this technique we estimated the rise in PC1 to reach half-max levels between 0.95 and 1.25 s poststimulus (Fig. 6C, gray dashed line). Although this timing is delayed from the palatability onset reported for Figure 5E, it is consistent with the time at which the correlation became significantly higher than baseline levels (1.15 s; Tukey–Kramer, p < 0.001).
Concentration- and palatability-related responses were not found in discrete sets of GC/CeA neurons
Among the GC neurons with a significant correlation with either concentration or palatability (n = 57), Bayesian analysis revealed that the proportion of neurons that were well correlated with both concentration early and palatability late (7/57; 12.3%) was almost precisely what one would expect by chance (7.4/57; 12.8%) given the prevalence of concentration and palatability responses in the overall GC sample (Fig. 3F). Similar results held for CeA, and we are therefore (perhaps unavoidably; see Discussion) unable to find compelling support for either of two competing proposals: that single populations of GC and CeA neurons uniquely reflected the transformation of concentration to palatability or that the two properties were separately coded in distinct GC/CeA ensembles. We specifically suggest that concentration and palatability are related properties processed by overlapping subsets of neurons.
Palatability is reflected differently in CeA and GC responses
The above analyses suggest that GC and CeA both code palatability in the Late epoch (after coding for concentration earlier). We found significant differences, however, between the specifics of these GC and CeA palatability-specific responses. Visual inspection suggests, in fact, that CeA neurons (Figs. 1F,G, 5B) code for palatability in a relatively compressed fashion compared with GC neurons (e.g., Fig. 3B). That is, GC neurons appear to respond distinctly to each taste, and thus each neuron's responses reflect the entire palatability curve; individual CeA neurons, meanwhile, appear to make more broad distinctions, responding largely to only one end of the palatability spectrum or the other (e.g., the neuron described by Fig. 1F,G responds only to tastes that are more palatable than water).
If these appearances accurately reflect the overall results, then GC responses should in general correlate better with the overall palatability function than CeA responses. Population analysis confirms this prediction: over the taste-responsive epoch, individual GC neurons (Fig. 7A, gray line) tended to correlate with the palatability function better than did individual CeA neurons (Fig. 7A, black line).
Figure 7.

CeA neurons do not code palatability in the same manner as GC neurons, and do so at a delay. A, Individual GC (gray) and CeA (black) neurons have a strong correlation with the full palatability function during the late response epoch, but stronger correlations were observed in GC on a neuron-to-neuron basis. Inset, In estimating the percentage change from a full palatability function to a truncated good-or-bad response function, the strongest palatability correlating GC neurons (gray) showed a significant decrease in correlation with the abbreviated palatability curve while the strongest palatability correlating CeA neurons (black) showed no difference in correlation between the two functions. B, The differences between late firing-rate transitions in simultaneously recorded pairs of GC and CeA neurons, both for individual trials (red circles) and averaged across all trials (blue circles) for the 20 pairs best fit by the transition detection model. C, A histogram tabulated from the average transition lags between GC–CeA pairs plotted in B (blue line); the modal lag is a 200 ms delay, with GC leading the CeA.
We went on to test these appearances, hypothesizing that if the GC–CeA difference in Figure 7A truly reflects the fact that coding was more compressed in CeA, then we should be able to reduce GC correlations without affecting CeA correlations by similarly compressing the palatability curve used to calculate the correlation (such that all positive tastes are identical to each other, but distinct from negative tastes, or vice versa). We performed this test using all responses that were significantly (p < 0.01) correlated with taste palatability.
The inset of Figure 7A presents the result of this test, demonstrating that the correlations between CeA single neuron responses and the compressed palatability curve (black bar) were the same as those to the original palatability curve. The preponderance of GC neurons, meanwhile, showed a decrease in correlation to the compressed palatability function as compared with the full palatability function (gray bar). The difference between the two regions was significant (Wilcoxon rank sum Z = 2.04, p < 0.05). This result indicates that individual GC neurons come closer to reflecting the complete range of palatability across all tastes used, whereas individual CeA neuron responses more closely reflect the sign of a taste's palatability, positive or negative.
GC leads or simultaneously transitions with CeA to a late firing-rate state
While GC and CeA “code” somewhat different aspects of palatability, the dynamics of these palatability-related responses appear similar; that is, the above analyses suggest that the onset of palatability-related responding in GC either leads (Figs. 4C, 6C) or appears simultaneously (Figs. 3E, 5E) with that in CeA. Of course, this evidence is difficult to interpret, both because the onset of palatability in each region is gradual and because the difference in average firing rates in the two regions affects the results. Furthermore, these previous analyses do not represent a direct comparison of responses in GC and CeA within single trials.
Because we obtained data from simultaneously recorded GC and CeA ensembles, we were able to move beyond these measures to directly ask whether GC and CeA neurons change their firing rates together on a trial-to-trial basis. Our previous work has demonstrated that such changes occur suddenly in GC single trials (Jones et al., 2007), but the analytic techniques that were used in this previous study cannot be brought to bear on the smaller numbers of neurons that could be recorded simultaneously in CeA. To estimate when exactly a neuron exhibited a firing-rate change, therefore, we applied a bioinformatics technique, fitting a piecewise linear function (piecewise jump model) (Little and Jones, 2011a) to single-neuron, single-trial spike trains (for details, see Materials and Methods). Application of this technique allowed us to extract the most likely times of discrete firing-rate jumps over the course of a single evoked response (discarding from analysis only neurons for which these firing-rate changes could not be determined with high confidence). From these, we selected the firing-rate jumps nearest to 1 s poststimulus (i.e., around the time that palatability-related information emerged), and then used these data to calculate the single-trial lag between the transitions for simultaneously recorded amygdala-cortical pairs of neurons; that is, we directly determined whether there was a reliable relationship between when the GC neuron transitioned to the Late epoch in a particular trial and when the CeA neuron transitioned to the Late epoch in the same trial.
Results of this analysis are displayed in Figure 7B: while there is variance in trial-to-trial lags (red dots are individual trials, blue dots are the mean lag for each pair), the average transition times for the neuron pairs in the top 10% of best-fit by the PWC toolkit are nonrandom—mean lags were centered near 0, with GC transitions leading CeA transitions by <200 ms. This result held across all recorded pairs (data not shown). Firing-rate transitions into the Late epoch, wherein palatability is coded, occurred first in GC and almost immediately afterward in simultaneously recorded CeA neurons.
Discussion
If stimuli are to guide an animal's behavior, then the animal must transform the physical properties of those stimuli into psychological properties related to desirability. Both GC and CeA are implicated in this process for taste stimuli: while basic preference behavior survives decerebration (Grill and Norgren, 1978a), lesions of either CeA or GC alone change learning-dependent, and even sometimes naive preferences (Galaverna et al., 1992; Zardetto-Smith et al., 1994; Touzani et al., 1997; Luz et al., 2007; Fortis-Santiago et al., 2010), as do localized lesions and inactivations of other forebrain regions (Grill and Norgren, 1978a; Touzani and Velley, 1990; Touzani and Sclafani, 2001; Reilly et al., 2004; Reilly and Bornovalova, 2005; Smith and Berridge, 2005). The preponderance of data suggests that palatability-related motor patterns are generated in the brainstem, but that the selection of an appropriate pattern is dependent on input from forebrain.
Here, we demonstrate: (1) that this transformation of physical to psychological can be directly observed, as the rat progresses from identifying to judging the stimulus, in the time courses of GC responses; (2) that the switch in GC from the coding of physical to psychological stimulus aspects occurs at a predicted time point; and (3) that palatability emerges in GC 100–200 ms earlier than in CeA, a structure thought to be vital for proper NaCl ingestion, and a structure that receives direct input from brainstem taste relays. Our analyses, which as correlational measures cannot conclusively prove a neural population's causal involvement in a particular task, nonetheless implicate GC in the transformation of the physical into the psychological: GC responses come to reflect palatability in anticipation of naturalistic approach/avoidance responses (Travers and Norgren, 1986).
Stimuli used in our previous studies had not permitted us to characterize the content of the “Middle” response epoch beyond broad suggestions of “quality-related firing” (Katz et al., 2001; Fontanini and Katz, 2006). The current study enriches this characterization, showing that physical properties such as concentration are reflected in approximately the first 500 ms of taste-specific activity. We can currently only speculate on how GC definitively disambiguates taste concentration from taste quality during this Middle epoch, but we suspect that, much as has been proposed for insect olfactory structures (Stopfer et al., 2003), between-neuron variability ensures that overall population responses for different taste qualities occupy different sectors of “stimulus space;” future work involving multiple concentrations of multiple tastes will tell us how quality and concentration are disambiguated in neural responses, and will investigate the fact that rodent cortical NaCl responses, unlike those observed in primates (Scott et al., 1991), decline with increasing concentration as often as they increase (Yamamoto et al., 1984).
In the latter half of the first second following taste delivery, the primary component of GC responses transitions to being palatability-centered, a transition predicted on the basis of our previous studies (Fontanini and Katz, 2006; Grossman et al., 2008). The current evidence advances our understanding, however, performing a more detailed analysis of subtler variations in palatability. In a context that is relatively free of the possible confound of palatability-specific behavior, we demonstrate a much stronger fit between neural activity and preference behavior (Yamamoto et al., 1985) than previously reported, validating our time-based approach to understanding neural taste responses.
Although GC neurons as a population code first concentration and then palatability, the evidence does not suggest that concentration and palatability are coded by a unified taste-processing population. Nor does the evidence suggest that they emerge from separate populations of “chemosensory” and “hedonic” neurons, however: while a recent study demonstrated that the peripheral coding of sodium may be divisible into two separate channels, one responding to sodium concentration ranges with an inverted-U function and the other with a monotonic function (Chandrashekar et al., 2010), our observations do not provide conclusive support for the continuation of this pattern into the forebrain, where partially overlapping subpopulations coded the two properties.
Of course, this is to be expected, because concentration and palatability, while distinct, are not orthogonal: perfect correlation with one property does not imply zero correlation with the other. Furthermore, the hypotheses that concentration and palatability are processed either by separate ensembles or a single ensemble are only two of three possibilities: as related properties, concentration and palatability may well be processed by overlapping ensembles of taste neurons. It is this hypothesis that is supported by our data.
We would argue that the responses observed here reflect the actual processing of palatability, and not efference copy of ingestive behaviors. While tastes evoking strong aversion can under certain conditions be processed very quickly (Halpern and Tapper, 1971), in our preparation palatability-related behavior emerges much later (Travers and Norgren, 1986). Palatability coding in GC substantially precedes these behaviors, and does so in neurons that lack sensorimotor-driven (lick-related) activity (Katz et al., 2001; Grossman et al., 2008). Furthermore, the strong fit observed between the palatability function and Late epoch GC responses was elicited using a taste battery that does not induce large variations in orofacial responses—a brief-access test, which captures fine variations in palatability in numbers of licks, revealed the relationship among the stimuli. The fact that the canonical inverted-U was shallower in our thirsty rats than that observed previously (Breslin et al., 1993) is inconsequential for our analysis; the exquisite match observed between behavioral and neural functions is likely a true match between brain activity and a purely psychological variable.
In fact, we likely underestimated the brain/behavior match by averaging a preference function across several rats. Although responses to the stimulus set were largely consistent between animals, and with previous reports (Breslin et al., 1993; Curtis et al., 2001), we observed subtle between-rat fluctuations in the relative preference for particular pairs of tastes (0.01 and 0.3 m NaCl; 0.3 m sucrose and 0.1 m NaCl), which reduced overall correlations. This variability, and the fact that recordings and preference behaviors were necessarily collected in separate sessions (see Materials and Methods), only serves to set in starker relief the strong neural/behavioral response relationship that we observed. Future studies will directly test whether such subtle variations in palatability are tracked by single-neuron responses.
Of course, while both GC and CeA responses reflect the processing of palatability, they do so in distinct ways. GC neurons tend to respond to all stimuli, whereas CeA responses tend to reflect either palatable or aversive stimuli, but not both. In this regard, CeA palatability responses resemble those previously observed in BLA (although BLA codes palatability earlier) (Fontanini et al., 2009). The content of CeA taste responses were surprising in other regards as well: whereas we expected CeA responses to be taste specific earlier than those in GC, courtesy of direct input from the taste brainstem (Norgren, 1976), we saw no evidence of robust CeA taste specificity until almost 600 ms after stimulus delivery, and certainly CeA lags GC in initial taste responsiveness; while we cannot exclude the possibility that CeA neurons might be acid or umami responsive earlier (session length and IOC manifold size limited taste battery size), the literature suggests that forebrain acid/umami-responsive neurons also respond to NaCl, quinine, and/or sucrose (Nishijo et al., 1998; Katz et al., 2001), and the most likely conclusion is that taste specificity emerges later in CeA than in GC.
Finally, we expected (on the basis of anatomy, and on studies suggesting that CeA is vital for processing taste palatability, e.g., Touzani et al., 1997) CeA to lead GC in the processing of palatability. In fact, GC palatability coding appears slightly before that observed in CeA. It may even be that the onset of palatability in CeA responses lags the onset of taste reactivity (Travers and Norgren, 1986). Precise determination of response onsets is notoriously difficult, however, both because of windowing and because trial-to-trial variability blurs sudden changes (Jones et al., 2007). Although our analysis of single-trial lags between pairs of GC and CeA neurons supports the GC's leading CeA in transitioning to a palatability coding regime, future single-trial analyses, precisely examining the relationship between CeA transitions and ensemble transitions in GC should shed more light on this issue.
At present, the relationship between GC and CeA remains unclear. Perhaps they work in concert, just as ensembles of GC neurons transition coherently between firing-rate states (Jones et al., 2007). Alternatively, a third structure may drive both structures; perhaps BLA, which projects to both GC and CeA and reflects palatability before either. BLA specifically inhibits CeA (via the juxtocellular bed nucleus of the stria terminalis) (Francesconi et al., 2009), and could be responsible for the early inhibition that characterizes many CeA palatability responses. Future work examining GC/CeA ensemble responses in the context of BLA inactivation will test these hypotheses.
In summary, the results presented here demonstrate that GC and CeA reflect both the physical and psychological properties of tastes. If these responses represent an essential part of ingestion decisions, temporary disruption of this processing via electrical or optogenetic stimulation should disrupt or delay such decisions.
Footnotes
This work was supported by grants from the National Institute on Deafness and Other Communication Disorders to D.B.K. and B.F.S.. We would also like to thank Drs. Madelyn Baez, Asif Ghazanfar, and Benjamin Rubin for their feedback on earlier versions of this manuscript.
The authors declare no competing financial interests.
References
- Berridge KC. Modulation of taste affect by hunger, caloric satiety, and sensory-specific satiety in the rat. Appetite. 1991;16:103–120. doi: 10.1016/0195-6663(91)90036-r. [DOI] [PubMed] [Google Scholar]
- Berridge KC. Motivation concepts in behavioral neuroscience. Physiol Behav. 2004;81:179–209. doi: 10.1016/j.physbeh.2004.02.004. [DOI] [PubMed] [Google Scholar]
- Berridge KC, Flynn FW, Schulkin J, Grill HJ. Sodium depletion enhances salt palatability in rats. Behav Neurosci. 1984;98:652–660. doi: 10.1037//0735-7044.98.4.652. [DOI] [PubMed] [Google Scholar]
- Boughter JD, Jr, St John SJ, Smith DV. Neural representation of the taste of NaCl and KCl in gustatory neurons of the hamster solitary nucleus. J Neurophysiol. 1999;81:2636–2646. doi: 10.1152/jn.1999.81.6.2636. [DOI] [PubMed] [Google Scholar]
- Breslin PA, Spector AC, Grill HJ. A quantitative comparison of taste reactivity behaviors to sucrose before and after lithium chloride pairings: a unidimensional account of palatability. Behav Neurosci. 1992;106:820–836. doi: 10.1037//0735-7044.106.5.820. [DOI] [PubMed] [Google Scholar]
- Breslin PA, Kaplan JM, Spector AC, Zambito CM, Grill HJ. Lick rate analysis of sodium taste-state combinations. Am J Physiol. 1993;264:R312–R318. doi: 10.1152/ajpregu.1993.264.2.R312. [DOI] [PubMed] [Google Scholar]
- Briggman KL, Abarbanel HD, Kristan WB., Jr Optical imaging of neuronal populations during decision-making. Science. 2005;307:896–901. doi: 10.1126/science.1103736. [DOI] [PubMed] [Google Scholar]
- Chalansonnet M, Chaput MA. Olfactory bulb output cell temporal response patterns to increasing odor concentrations in freely breathing rats. Chem Senses. 1998;23:1–9. doi: 10.1093/chemse/23.1.1. [DOI] [PubMed] [Google Scholar]
- Chandrashekar J, Hoon MA, Ryba NJ, Zuker CS. The receptors and cells for mammalian taste. Nature. 2006;444:288–294. doi: 10.1038/nature05401. [DOI] [PubMed] [Google Scholar]
- Chandrashekar J, Kuhn C, Oka Y, Yarmolinsky DA, Hummler E, Ryba NJ, Zuker CS. The cells and peripheral representation of sodium taste in mice. Nature. 2010;464:297–301. doi: 10.1038/nature08783. [DOI] [PMC free article] [PubMed] [Google Scholar]
- Chapin JK, Nicolelis MA. Principal component analysis of neuronal ensemble activity reveals multidimensional somatosensory representations. J Neurosci Methods. 1999;94:121–140. doi: 10.1016/s0165-0270(99)00130-2. [DOI] [PubMed] [Google Scholar]
- Chen JY, Victor JD, Di Lorenzo PM. Temporal coding of intensity of NaCl and HCl in the nucleus of the solitary tract of the rat. J Neurophysiol. 2011;105:697–711. doi: 10.1152/jn.00539.2010. [DOI] [PMC free article] [PubMed] [Google Scholar]
- Curtis KS, Krause EG, Contreras RJ. Altered NaCl taste responses precede increased NaCl ingestion during Na(+) deprivation. Physiol Behav. 2001;72:743–749. doi: 10.1016/s0031-9384(01)00422-x. [DOI] [PubMed] [Google Scholar]
- Dahl M, Erickson RP, Simon SA. Neural responses to bitter compounds in rats. Brain Res. 1997;756:22–34. doi: 10.1016/s0006-8993(97)00131-5. [DOI] [PubMed] [Google Scholar]
- Di Lorenzo PM, Schwartzbaum JS. Coding of gustatory information in the pontine parabrachial nuclei of the rabbit: magnitude of neural response. Brain Res. 1982;251:229–244. doi: 10.1016/0006-8993(82)90741-7. [DOI] [PubMed] [Google Scholar]
- Di Lorenzo PM, Chen JY, Victor JD. Quality time: representation of a multidimensional sensory domain through temporal coding. J Neurosci. 2009;29:9227–9238. doi: 10.1523/JNEUROSCI.5995-08.2009. [DOI] [PMC free article] [PubMed] [Google Scholar]
- Duchamp-Viret P, Duchamp A, Sicard G. Olfactory discrimination over a wide concentration range. Comparison of receptor cell and bulb neuron abilities. Brain Res. 1990;517:256–262. doi: 10.1016/0006-8993(90)91035-f. [DOI] [PubMed] [Google Scholar]
- Duchamp-Viret P, Duchamp A, Chaput MA. Peripheral odor coding in the rat and frog: quality and intensity specification. J Neurosci. 2000;20:2383–2390. doi: 10.1523/JNEUROSCI.20-06-02383.2000. [DOI] [PMC free article] [PubMed] [Google Scholar]
- Erickson RP. Ohrwall, Henning and von Skramlik; the foundations of the four primary positions in taste. Neurosci Biobehav Rev. 1984;8:105–127. doi: 10.1016/0149-7634(84)90024-1. [DOI] [PubMed] [Google Scholar]
- Erickson RP, Rodgers JL, Sarle WS. Statistical analysis of neural organization. J Neurophysiol. 1993;70:2289–2300. doi: 10.1152/jn.1993.70.6.2289. [DOI] [PubMed] [Google Scholar]
- Fontanini A, Katz DB. State-dependent modulation of time-varying gustatory responses. J Neurophysiol. 2006;96:3183–3193. doi: 10.1152/jn.00804.2006. [DOI] [PubMed] [Google Scholar]
- Fontanini A, Grossman SE, Figueroa JA, Katz DB. Distinct subtypes of basolateral amygdala taste neurons reflect palatability and reward. J Neurosci. 2009;29:2486–2495. doi: 10.1523/JNEUROSCI.3898-08.2009. [DOI] [PMC free article] [PubMed] [Google Scholar]
- Fortis-Santiago Y, Rodwin BA, Neseliler S, Piette CE, Katz DB. State dependence of olfactory perception as a function of taste cortical inactivation. Nat Neurosci. 2010;13:158–159. doi: 10.1038/nn.2463. [DOI] [PMC free article] [PubMed] [Google Scholar]
- Francesconi W, Berton F, Koob GF, Sanna PP. Intrinsic neuronal plasticity in the juxtacapsular nucleus of the bed nuclei of the stria terminalis (jcBNST) Prog Neuropsychopharmacol Biol Psychiatry. 2009;33:1347–1355. doi: 10.1016/j.pnpbp.2009.08.003. [DOI] [PMC free article] [PubMed] [Google Scholar]
- Galaverna OG, Seeley RJ, Berridge KC, Grill HJ, Epstein AN, Schulkin J. Lesions of the central nucleus of the amygdala. I: Effects on taste reactivity, taste aversion learning and sodium appetite. Behav Brain Res. 1993;59:11–17. doi: 10.1016/0166-4328(93)90146-h. [DOI] [PubMed] [Google Scholar]
- Galaverna O, De Luca LA, Jr, Schulkin J, Yao SZ, Epstein AN. Deficits in NaCl ingestion after damage to the central nucleus of the amygdala in the rat. Brain Res Bull. 1992;28:89–98. doi: 10.1016/0361-9230(92)90234-o. [DOI] [PubMed] [Google Scholar]
- Galef BG., Jr Social interaction modifies learned aversions, sodium appetite, and both palatability and handling-time induced dietary preference in rats (Rattus norvegicus) J Comp Psychol. 1986;100:432–439. [PubMed] [Google Scholar]
- Ganchrow JR, Erickson RP. Neural correlates of gustatory intensity and quality. J Neurophysiol. 1970;33:768–783. doi: 10.1152/jn.1970.33.6.768. [DOI] [PubMed] [Google Scholar]
- Geisler WS, Albrecht DG, Crane AM. Responses of neurons in primary visual cortex to transient changes in local contrast and luminance. J Neurosci. 2007;27:5063–5067. doi: 10.1523/JNEUROSCI.0835-07.2007. [DOI] [PMC free article] [PubMed] [Google Scholar]
- Grill HJ, Norgren R. The taste reactivity test. II. Mimetic responses to gustatory stimuli in chronic thalamic and chronic decerebrate rats. Brain Res. 1978a;143:281–297. doi: 10.1016/0006-8993(78)90569-3. [DOI] [PubMed] [Google Scholar]
- Grill HJ, Norgren R. The taste reactivity test. I. Mimetic responses to gustatory stimuli in neurologically normal rats. Brain Res. 1978b;143:263–279. doi: 10.1016/0006-8993(78)90568-1. [DOI] [PubMed] [Google Scholar]
- Grossman SE, Fontanini A, Wieskopf JS, Katz DB. Learning-related plasticity of temporal coding in simultaneously recorded amygdala-cortical ensembles. J Neurosci. 2008;28:2864–2873. doi: 10.1523/JNEUROSCI.4063-07.2008. [DOI] [PMC free article] [PubMed] [Google Scholar]
- Haddad R, Weiss T, Khan R, Nadler B, Mandairon N, Bensafi M, Schneidman E, Sobel N. Global features of neural activity in the olfactory system form a parallel code that predicts olfactory behavior and perception. J Neurosci. 2010;30:9017–9026. doi: 10.1523/JNEUROSCI.0398-10.2010. [DOI] [PMC free article] [PubMed] [Google Scholar]
- Halpern BP, Tapper DN. Taste stimuli: quality coding time. Science. 1971;171:1256–1258. doi: 10.1126/science.171.3977.1256. [DOI] [PubMed] [Google Scholar]
- Hotelling H. Analysis of a complex of statistical variables into principal components. J Educ Psychol. 1933;24:498–520. [Google Scholar]
- Jones LM, Fontanini A, Sadacca BF, Miller P, Katz DB. Natural stimuli evoke dynamic sequences of states in sensory cortical ensembles. Proc Natl Acad Sci U S A. 2007;104:18772–18777. doi: 10.1073/pnas.0705546104. [DOI] [PMC free article] [PubMed] [Google Scholar]
- Kadohisa M, Rolls ET, Verhagen JV. Neuronal representations of stimuli in the mouth: the primate insular taste cortex, orbitofrontal cortex and amygdala. Chem Senses. 2005;30:401–419. doi: 10.1093/chemse/bji036. [DOI] [PubMed] [Google Scholar]
- Katz DB, Simon SA, Nicolelis MA. Dynamic and multimodal responses of gustatory cortical neurons in awake rats. J Neurosci. 2001;21:4478–4489. doi: 10.1523/JNEUROSCI.21-12-04478.2001. [DOI] [PMC free article] [PubMed] [Google Scholar]
- Khan RM, Luk CH, Flinker A, Aggarwal A, Lapid H, Haddad R, Sobel N. Predicting odor pleasantness from odorant structure: pleasantness as a reflection of the physical world. J Neurosci. 2007;27:10015–10023. doi: 10.1523/JNEUROSCI.1158-07.2007. [DOI] [PMC free article] [PubMed] [Google Scholar]
- Kvello P, Jørgensen K, Mustaparta H. Central gustatory neurons integrate taste quality information from four appendages in the moth Heliothis virescens. J Neurophysiol. 2010;103:2965–2981. doi: 10.1152/jn.00985.2009. [DOI] [PubMed] [Google Scholar]
- Leander JD. Fluoxetine suppresses palatability-induced ingestion. Psychopharmacology (Berl) 1987;91:285–287. doi: 10.1007/BF00518178. [DOI] [PubMed] [Google Scholar]
- Lebart L. Which bootstrap for principal axes methods? In: Brito P, Cucumel G, Bertrand P, Carvalho F, editors. Selected contributions in data analysis and classification. Berlin, Heidelberg: Springer; 2007. pp. 581–588. [Google Scholar]
- Little MA, Jones NS. Generalized methods and solvers for noise removal from piecewise constant signals. II. New methods. Proc Math Phys Eng Sci. 2011a;467:3115–3140. doi: 10.1098/rspa.2010.0674. [DOI] [PMC free article] [PubMed] [Google Scholar]
- Little MA, Jones NS. Generalized methods and solvers for noise removal from piecewise constant signals. I. Background theory. Proc Math Phys Eng Sci. 2011b;467:3088–3114. doi: 10.1098/rspa.2010.0671. [DOI] [PMC free article] [PubMed] [Google Scholar]
- Lopes-dos-Santos V, Conde-Ocazionez S, Nicolelis MA, Ribeiro ST, Tort AB. Neuronal assembly detection and cell membership specification by principal component analysis. PLoS One. 2011;6:e20996. doi: 10.1371/journal.pone.0020996. [DOI] [PMC free article] [PubMed] [Google Scholar]
- Luz CP, Souza A, Reis R, Mineiro P, Ferreira HS, Fregoneze JB, De Castro E Silva E. The central amygdala regulates sodium intake in sodium-depleted rats: role of 5-HT3 and 5-HT2C receptors. Brain Res. 2007;1139:178–194. doi: 10.1016/j.brainres.2007.01.012. [DOI] [PubMed] [Google Scholar]
- MacEvoy SP, Tucker TR, Fitzpatrick D. A precise form of divisive suppression supports population coding in the primary visual cortex. Nat Neurosci. 2009;12:637–645. doi: 10.1038/nn.2310. [DOI] [PMC free article] [PubMed] [Google Scholar]
- Mak YE, Simmons KB, Gitelman DR, Small DM. Taste and olfactory intensity perception changes following left insular stroke. Behav Neurosci. 2005;119:1693–1700. doi: 10.1037/0735-7044.119.6.1693. [DOI] [PubMed] [Google Scholar]
- Mathy I, Dupuis MJ, Pigeolet Y, Jacquerye P. [Bilateral ageusia after left insular and opercular ischemic stroke] Rev Neurol (Paris) 2003;159:563–567. [PubMed] [Google Scholar]
- Mazor O, Laurent G. Transient dynamics versus fixed points in odor representations by locust antennal lobe projection neurons. Neuron. 2005;48:661–673. doi: 10.1016/j.neuron.2005.09.032. [DOI] [PubMed] [Google Scholar]
- McCaughey SA, Scott TR. The taste of sodium. Neurosci Biobehav Rev. 1998;22:663–676. doi: 10.1016/s0149-7634(97)00067-5. [DOI] [PubMed] [Google Scholar]
- McDonald AJ. Cortical pathways to the mammalian amygdala. Prog Neurobiol. 1998;55:257–332. doi: 10.1016/s0301-0082(98)00003-3. [DOI] [PubMed] [Google Scholar]
- Nicolelis MA, Ghazanfar AA, Faggin BM, Votaw S, Oliveira LM. Reconstructing the engram: simultaneous, multisite, many single neuron recordings. Neuron. 1997;18:529–537. doi: 10.1016/s0896-6273(00)80295-0. [DOI] [PubMed] [Google Scholar]
- Nishijo H, Norgren R. Responses from parabrachial gustatory neurons in behaving rats. J Neurophysiol. 1990;63:707–724. doi: 10.1152/jn.1990.63.4.707. [DOI] [PubMed] [Google Scholar]
- Nishijo H, Uwano T, Tamura R, Ono T. Gustatory and multimodal neuronal responses in the amygdala during licking and discrimination of sensory stimuli in awake rats. J Neurophysiol. 1998;79:21–36. doi: 10.1152/jn.1998.79.1.21. [DOI] [PubMed] [Google Scholar]
- Norgren R. Taste pathways to hypothalamus and amygdala. J Comp Neurol. 1976;166:17–30. doi: 10.1002/cne.901660103. [DOI] [PubMed] [Google Scholar]
- Paxinos G, Watson C. The rat brain in stereotaxic coordinates. Ed 4. San Diego: Academic; 1998. [DOI] [PubMed] [Google Scholar]
- Pritchard TC, Macaluso DA, Eslinger PJ. Taste perception in patients with insular cortex lesions. Behav Neurosci. 1999;113:663–671. [PubMed] [Google Scholar]
- Reilly S, Bornovalova MA. Conditioned taste aversion and amygdala lesions in the rat: a critical review. Neurosci Biobehav Rev. 2005;29:1067–1088. doi: 10.1016/j.neubiorev.2005.03.025. [DOI] [PubMed] [Google Scholar]
- Reilly S, Bornovalova M, Trifunovic R. Excitotoxic lesions of the gustatory thalamus spare simultaneous contrast effects but eliminate anticipatory negative contrast: evidence against a memory deficit. Behav Neurosci. 2004;118:365–376. doi: 10.1037/0735-7044.118.2.365. [DOI] [PubMed] [Google Scholar]
- Rogers SM, Newland PL. Gustatory processing in thoracic local circuits of locusts. J Neurosci. 2002;22:8324–8333. doi: 10.1523/JNEUROSCI.22-18-08324.2002. [DOI] [PMC free article] [PubMed] [Google Scholar]
- Sadagopan S, Wang X. Level invariant representation of sounds by populations of neurons in primary auditory cortex. J Neurosci. 2008;28:3415–3426. doi: 10.1523/JNEUROSCI.2743-07.2008. [DOI] [PMC free article] [PubMed] [Google Scholar]
- Scott TR, Plata-Salaman CR, Smith VL, Giza BK. Gustatory neural coding in the monkey cortex: stimulus intensity. J Neurophysiol. 1991;65:76–86. doi: 10.1152/jn.1991.65.1.76. [DOI] [PubMed] [Google Scholar]
- Scott TR, Karadi Z, Oomura Y, Nishino H, Plata-Salaman CR, Lenard L, Giza BK, Aou S. Gustatory neural coding in the amygdala of the alert macaque monkey. J Neurophysiol. 1993;69:1810–1820. doi: 10.1152/jn.1993.69.6.1810. [DOI] [PubMed] [Google Scholar]
- Seeley RJ, Galaverna O, Schulkin J, Epstein AN, Grill HJ. Lesions of the central nucleus of the amygdala. II: Effects on intraoral NaCl intake. Behav Brain Res. 1993;59:19–25. doi: 10.1016/0166-4328(93)90147-i. [DOI] [PubMed] [Google Scholar]
- Serences JT, Saproo S. Population response profiles in early visual cortex are biased in favor of more valuable stimuli. J Neurophysiol. 2010;104:76–87. doi: 10.1152/jn.01090.2009. [DOI] [PMC free article] [PubMed] [Google Scholar]
- Smith JC, Davis JD, O'Keefe GB. Lack of an order effect in brief contact taste tests with closely spaced test trials. Physiol Behav. 1992;52:1107–1111. doi: 10.1016/0031-9384(92)90467-g. [DOI] [PubMed] [Google Scholar]
- Smith KS, Berridge KC. The ventral pallidum and hedonic reward: neurochemical maps of sucrose “liking” and food intake. J Neurosci. 2005;25:8637–8649. doi: 10.1523/JNEUROSCI.1902-05.2005. [DOI] [PMC free article] [PubMed] [Google Scholar]
- Spector AC, Breslin P, Grill HJ. Taste reactivity as a dependent measure of the rapid formation of conditioned taste aversion: a tool for the neural analysis of taste-visceral associations. Behav Neurosci. 1988;102:942–952. doi: 10.1037//0735-7044.102.6.942. [DOI] [PubMed] [Google Scholar]
- St John SJ, Smith DV. Neural representation of salts in the rat solitary nucleus: brain stem correlates of taste discrimination. J Neurophysiol. 2000;84:628–638. doi: 10.1152/jn.2000.84.2.628. [DOI] [PubMed] [Google Scholar]
- Stopfer M, Jayaraman V, Laurent G. Intensity versus identity coding in an olfactory system. Neuron. 2003;39:991–1004. doi: 10.1016/j.neuron.2003.08.011. [DOI] [PubMed] [Google Scholar]
- Taha SA, Fields HL. Encoding of palatability and appetitive behaviors by distinct neuronal populations in the nucleus accumbens. J Neurosci. 2005;25:1193–1202. doi: 10.1523/JNEUROSCI.3975-04.2005. [DOI] [PMC free article] [PubMed] [Google Scholar]
- Tindell AJ, Smith KS, Peciña S, Berridge KC, Aldridge JW. Ventral pallidum firing codes hedonic reward: when a bad taste turns good. J Neurophysiol. 2006;96:2399–2409. doi: 10.1152/jn.00576.2006. [DOI] [PubMed] [Google Scholar]
- Touzani K, Sclafani A. Conditioned flavor preference and aversion: role of the lateral hypothalamus. Behav Neurosci. 2001;115:84–93. doi: 10.1037/0735-7044.115.1.84. [DOI] [PubMed] [Google Scholar]
- Touzani K, Velley L. Ibotenic acid lesion of the lateral hypothalamus increases preference and aversion thresholds for saccharin and alters the morphine modulation of taste. Pharmacol Biochem Behav. 1990;36:585–591. doi: 10.1016/0091-3057(90)90259-k. [DOI] [PubMed] [Google Scholar]
- Touzani K, Taghzouti K, Velley L. Increase of the aversive value of taste stimuli following ibotenic acid lesion of the central amygdaloid nucleus in the rat. Behav Brain Res. 1997;88:133–142. doi: 10.1016/s0166-4328(96)02273-5. [DOI] [PubMed] [Google Scholar]
- Travers JB, Norgren R. Electromyographic analysis of the ingestion and rejection of sapid stimuli in the rat. Behav Neurosci. 1986;100:544–555. doi: 10.1037//0735-7044.100.4.544. [DOI] [PubMed] [Google Scholar]
- Uchida N, Takahashi YK, Tanifuji M, Mori K. Odor maps in the mammalian olfactory bulb: domain organization and odorant structural features. Nat Neurosci. 2000;3:1035–1043. doi: 10.1038/79857. [DOI] [PubMed] [Google Scholar]
- Verhagen JV, Kadohisa M, Rolls ET. Primate insular/opercular taste cortex: neuronal representations of the viscosity, fat texture, grittiness, temperature, and taste of foods. J Neurophysiol. 2004;92:1685–1699. doi: 10.1152/jn.00321.2004. [DOI] [PubMed] [Google Scholar]
- Wachowiak M, Cohen LB, Zochowski MR. Distributed and concentration-invariant spatial representations of odorants by receptor neuron input to the turtle olfactory bulb. J Neurophysiol. 2002;87:1035–1045. doi: 10.1152/jn.00522.2001. [DOI] [PubMed] [Google Scholar]
- Yamamoto T. Taste responses of cortical neurons. Prog Neurobiol. 1984;23:273–315. doi: 10.1016/0301-0082(84)90007-8. [DOI] [PubMed] [Google Scholar]
- Yamamoto T, Yuyama N, Kato T, Kawamura Y. Gustatory responses of cortical neurons in rats. I. Response characteristics. J Neurophysiol. 1984;51:616–635. doi: 10.1152/jn.1984.51.4.616. [DOI] [PubMed] [Google Scholar]
- Yamamoto T, Yuyama N, Kato T, Kawamura Y. Gustatory responses of cortical neurons in rats. III. Neural and behavioral measures compared. J Neurophysiol. 1985;53:1370–1386. doi: 10.1152/jn.1985.53.6.1370. [DOI] [PubMed] [Google Scholar]
- Zardetto-Smith AM, Beltz TG, Johnson AK. Role of the central nucleus of the amygdala and bed nucleus of the stria terminalis in experimentally-induced salt appetite. Brain Res. 1994;645:123–134. doi: 10.1016/0006-8993(94)91645-4. [DOI] [PubMed] [Google Scholar]