Abstract
Entanglement between large numbers of quantum modes is the quintessential resource for future technologies such as the quantum internet. Conventionally, the generation of multimode entanglement in optics requires complex layouts of beamsplitters and phase shifters in order to transform the input modes into entangled modes. Here we report the highly versatile and efficient generation of various multimode entangled states with the ability to switch between different linear optics networks in real time. By defining our modes to be combinations of different spatial regions of one beam, we may use just one pair of multi-pixel detectors in order to measure multiple entangled modes. We programme virtual networks that are fully equivalent to the physical linear optics networks they are emulating. We present results for N=2 up to N=8 entangled modes here, including N=2, 3, 4 cluster states. Our approach introduces the highly sought after attributes of flexibility and scalability to multimode entanglement.
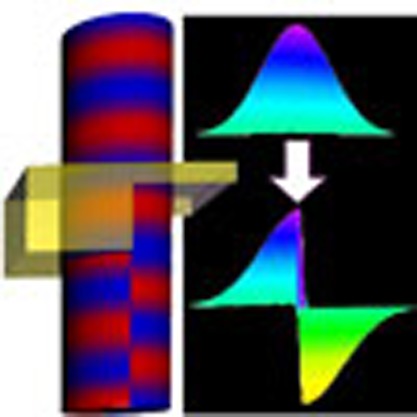 Multi-partite entanglement is essential not only to understand large quantum ensembles but also to build useful quantum technologies. Armstrong et al. demonstrate multimode entanglement of up to eight modes using programmable virtual networks based on linear optics that can be switched in real time.
Multi-partite entanglement is not only of fundamental scientific interest, it is also the key ingredient for quantum information technologies1,2,3,4. In optics, several impressive demonstrations of multi-partite entanglement have been shown recently including an 8-photon cluster state5 and a 9-mode state used for error correction6. However, these schemes tend to employ one detection system per entangled mode/qubit, which introduces a lack of flexibility and is detrimental to its scalability. These optical setups are built to produce one set of outputs or to perform one given protocol; in order to change the output the optical hardware itself must be modified.
Currently, the well-established recipe for generating entanglement using continuous wave laser beams is to mix squeezed modes of light together at beamsplitters. It is possible to create N-mode entanglement given a network of N−1 beamsplitters with N input modes, even with less than N squeezed modes7.
In our scheme, we copropagate all possible spatial modes of light within one beam. Entanglement between copropagating modes in one beam has been previously demonstrated with spatial modes8,9, and also in the frequency domain10. In the current work, we radically expand the idea of one-beam entanglement by introducing the notion of emulating linear optics networks, by programming virtual networks that mix together different spatial regions of the light beam. These software-based networks calculate the precise weighted combinations of the spatial regions required to emulate the physical networks. This is possible because the linear optical components in a typical network simply perform reversible operations, and can be represented by unitary matrices. It is worth stating explicitly that the entangled spatial modes that we produce are event-ready and unconditional before the detection process. The real-time virtual networks allow us to match the detection basis to the desired spatial mode basis contained within the beam, analogous to shaping a reference local oscillator beam. We report here the ability to switch in real time between desired output states in a one-beam entanglement system using just one detection scheme. We programme virtual networks for 2, 3, 4, 5, 6, 7 and 8-mode entangled states. As a further demonstration of the versatility of our setup, we produce linear 2, 3 and 4-mode cluster states, which are highly entangled graph states garnering attention for their potential in quantum computing2. The cluster state measurements demand more stringent squeezing requirements than non-cluster inseparable states.
Results
Measuring spatial modes
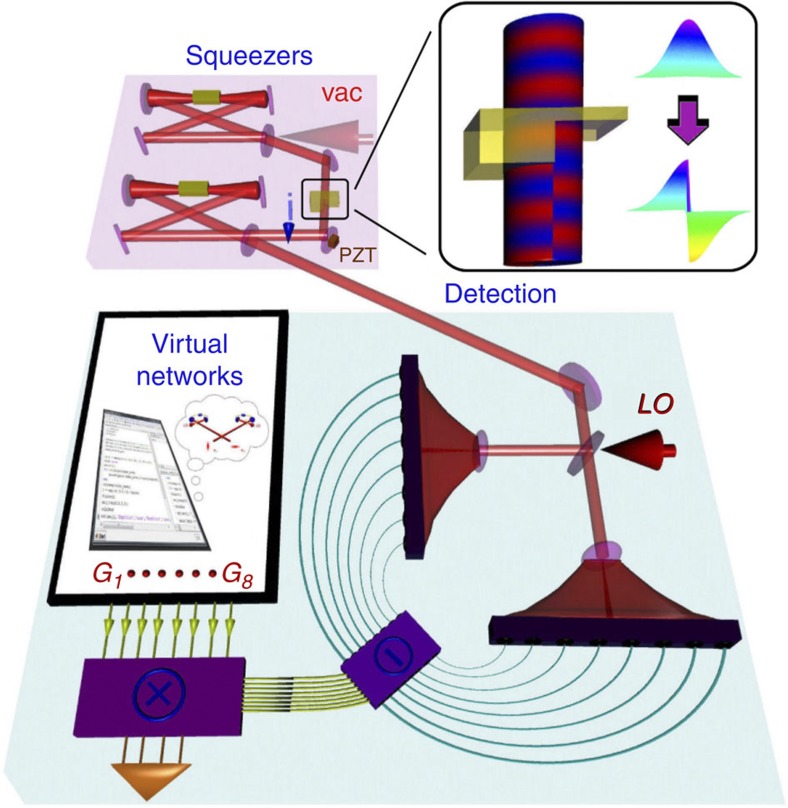
By employing custom-made multi-photodiode-homodyne-detectors (MPHD) that each contain an array of eight photodiodes (see Fig. 1), we detect the light in eight spatial regions and assign individual electronic gains to each one. The linear combination of the eight gain-adjusted photocurrents constitutes the measurement of one mode.
Figure 1. Experimental setup.
Squeezed light is prepared and combined in 'Squeezers' with a piezoelectric transducer (PZT) controlling the phase between the two squeezed modes, locked in quadrature. Vacuum modes (vac) copropagate so that the beam exiting 'Squeezers' and entering 'Detection' contains eight measurable spatial modes. MPHD is used to measure the quadrature amplitudes of the beam in eight different regions, in 'Detection'. Local oscillator (LO) gives a reference to phase quadratures. A PC is used to calculate electronic gain functions Gn via the notion of 'Virtual networks'. The detected beam is then projected onto a basis of measured modes (see equation (1)). Inset: FM generation; half of the wave is phase retarded by half a wavelength, flipping the electric field amplitude.
More generally, we can express the measurement process of a complete set of spatial modes in one beam by the following:
 |
1 |
 |
2 |
where  is the set of N measured modes projected by the N×8 unitary matrix U acting on the eight homodyne-subtracted photocurrent operators
  .
.  is an N×8 matrix made up of the top N rows of Uin, the orthogonal 8×8 unitary matrix that recovers the important set of eight unmixed spatial modes that span the input basis (see Methods). Input modes are then mixed via Unet, which emulate linear optics networks, given by the N×N matrix:
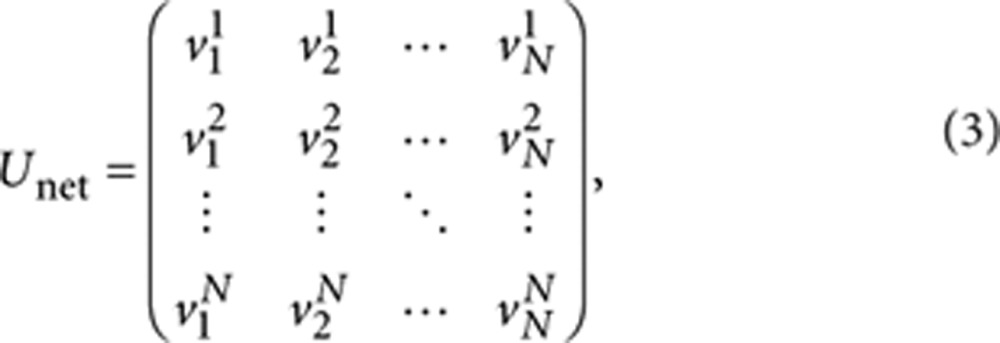 |
3 |
where  .
.
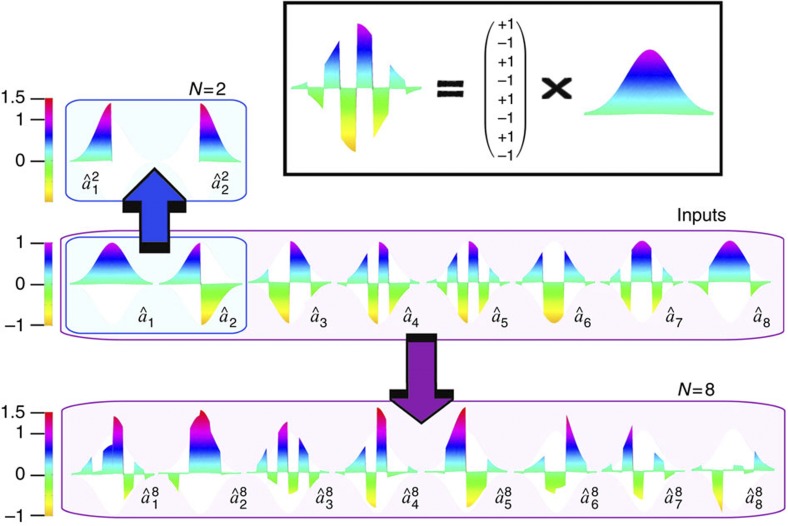
This allows us to uniquely define a mode ân by the eight real numbers in the nth row of U, which we will label as the mode's gain vector Gn, such that ân = Gnî. Therefore each spatial mode we measure, whether belonging to the input basis or an entangled mode basis, is defined by a unique pattern within the light beam. These spatial mode patterns, represented by Gaussian profiles modulated by respective electronic gains Gn, are shown visually in Fig. 2, while the detection stage of Fig. 1 shows how we implement this experimentally. The spatial modes are orthogonal to each other, spanning a basis so that the independent measurement of each mode is possible11,12.
Figure 2. Spatial mode patterns.
Measured modes are defined by spatial patterns of electric field amplitudes. Shown in the top right box is an example of how the spatial mode pattern for â5 is matched by applying eight electronic gain values (G5) to the detected Gaussian profile (î). The basis of input modes  is shown in the middle row (see Methods). The arrows represent a mapping via the virtual networks
  (blue) and
  (violet) onto the respective bases of entangled modes; the top row shows the symmetric EPR or 2-mode basis, while the bottom row shows the 8-mode basis. Superscripts denote mode basis and subscripts denote mode number. The spatial mode bases for N=3 to N=7 are not shown for brevity.
Input basis
We create two amplitude squeezed modes using optical parametric amplifiers (OPAs). The first mode is converted to a flip mode (FM) by phase delaying half its beam by half a wavelength, π (see inset of Fig. 1). The FM is overlapped in quadrature with the Gaussian mode (GM) output of the second OPA upon reflection of its output coupler13. These two squeezed modes are the first two modes of what we refer to as the input basis; â1 and â2. Six copropagating vacua modes are measured by calculating Gn vectors that are orthogonal to both â1 and â2. These vacua modes (labelled â3...â8) complete the input mode basis (see middle row of Fig. 2). Measuring these modes amounts to matching the detection basis by following equation (1) and setting Unet=I (see Methods).
Entangled mode bases
Programming a virtual network amounts to calculating the precise expression for Unet. The unitaries we have access to in programming the virtual networks are beamsplitters and π phase shifts. Unet is the concatenation of all of these unitaries that make up a linear optics network. The π phase shift is equivalent to multiplying â by −1. Note that arbitrary phase shifts are forbidden as each measurement naturally corresponds to detection at a fixed phase defined by a shared reference beam, the local oscillator. Importantly, optimal virtual networks are calculated allowing for optimization of beamsplitters owing to asymmetries in the squeezing levels of input modes.
The most intuitive virtual network we create is the 2-mode Einstein-Podolsky-Rosen (EPR) state14 shown in Fig. 3a with two squeezed inputs. Here, we engineer spatial mode patterns that have no spatial overlap; the left half of the beam is entangled with the right half (see the N=2 panel of Fig. 2). Entangled modes belonging to other bases share spatial overlap but are nevertheless spatially orthogonal.
Figure 3. Multimode entanglement via emulated linear optics networks.
Squeezed light and vacua are mixed together using unitary operations in order to produce entangled mode states. Unless otherwise stated beamsplitters are 50% reflective. Other reflectivities are denoted by splitting ratios; 2:1 denotes a 33% reflectivity, and 3:1 denotes a 25% reflectivity. Superscripts denote mode basis and subscripts denote mode number; there is a one-to-one correspondence between spatial mode bases shown here and those shown in Fig. 2
 . (a) The emulated linear optics network used to measure 2-mode EPR entanglement
  . (b) 8-mode entanglement via a calculated concatenation of beamsplitter and π phase shift operations
  . The dots between a and b imply virtual networks for N=3...7, again not shown for brevity.
Spatial modes measured in an entangled mode basis are given a superscript N to distinguish them from modes in the input basis;  and
and  represent the two modes spanning the N=2-mode EPR basis. See the Methods section for details on how we create virtual networks for each of the N=2, 3, 4, 5, 6, 7 and 8-mode bases. In general, we construct networks pertaining to N modes by concatenating N−1 virtual beamsplitters with vacua on unused input ports (see Fig. 3b). This is a highly efficient approach to create multimode entanglement as the arduous tasks of mode matching and alignment are replaced with the ease of programming.
Cluster states
Attracting attention for their potential in one-way quantum computing schemes, cluster states are a type of highly entangled Gaussian graph state15,16. They satisfy the quadrature relation  . As infinite squeezing would require infinite energy and are thus unrealizable, one is limited to the production of approximate cluster states in the laboratory, and there have been demonstrations of up to 4-mode continuous-variable cluster states thus far17,18.
In order to measure cluster states in one beam, we must be able to access the correct quadratures of each entangled mode. Here we measure 2, 3 and 4-mode linear cluster states; however, measuring arbitrary cluster shapes would require modifying the optical setup (see Methods).
Discussion
Each spatial mode is characterized by the continuous-variable quadrature operators  and
and  of the electric field operator. The
  and
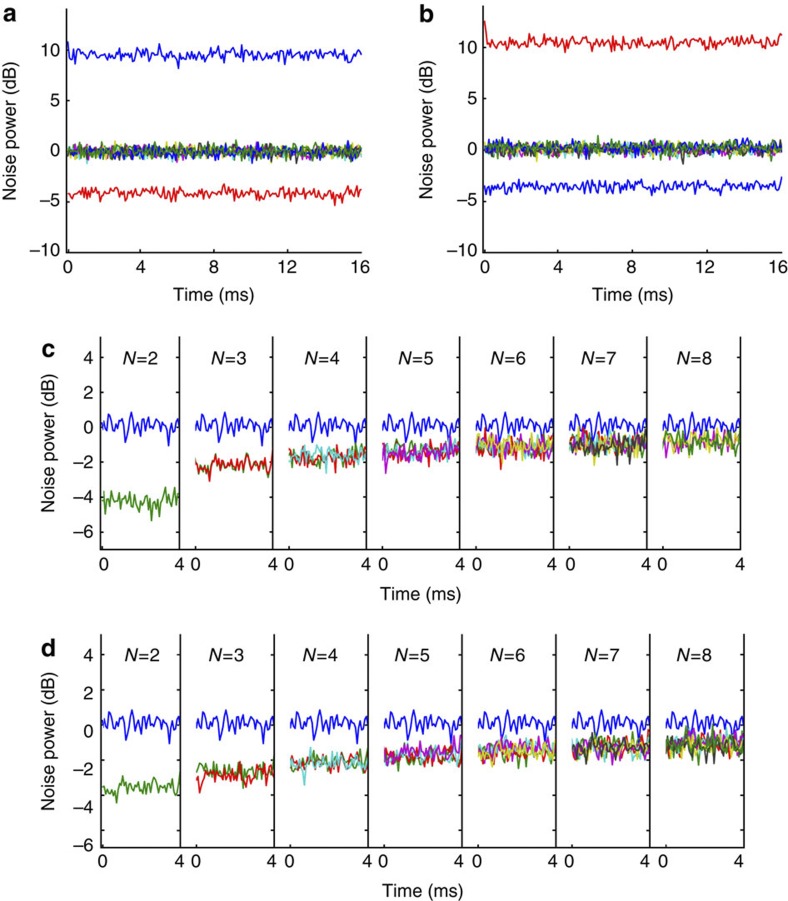
and  variance measurements of the eight modes in the input basis are shown in Fig. 4a,b. Here, 〈[ΔxGM]2〉=〈[Δx1]2〉=−4.3±0.05 dB and 〈[ΔpFM]2〉=〈[Δp2]2〉=−3.7±0.05 dB below the quantum noise limit, and the variances of the vacua are verified to equal quantum noise.
Figure 4. Noise variance measurements of the spatial modes.
(a) x quadrature measurements of the input mode basis. The squeezed 〈[Δx1]2〉 is shown in red and antisqueezed 〈[Δx2]2〉 is shown in blue. The x quadrature variances of the six vacua modes are measured to equal quantum noise (shown by the six coloured traces at 0 dB). (b) p quadrature measurements. The antisqueezed 〈[Δp1]2〉 is shown in red and squeezed 〈[Δp2]2〉 is shown in blue. The p quadrature variances of the six modes are again measured to equal quantum noise, confirming they are vacua (shown by the six coloured traces at 0 dB). (c) These variances show the x quadrature correlations between modes as in the first half of the left hand side of equation (4). Every column shows N−1 traces of x quadrature correlations below shot noise, as well as the blue shot noise trace (0 dB) normalized to two units of vacua. Each green trace shows  for each N-mode basis. Each new colour represents the other N−1 variance correlation traces of equation (4). (d) Correlations between measured modes in p quadrature, second half of the left hand side of equation (4). Each green trace now shows
  . The traces overlapping show that each pair of modes is entangled with the same strength as any other pair of modes, a result of optimizing for symmetry in the virtual networks.
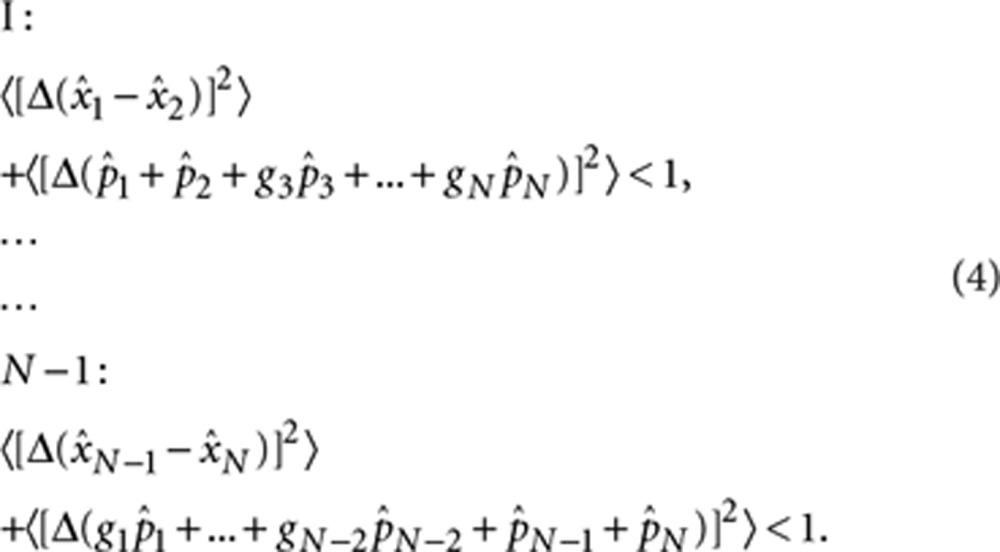
In order to verify entanglement between measured modes, we use the well-established van Loock–Furusawa inseparability criteria19. For an N-mode entangled state, it is sufficient to satisfy N−1 inseparability inequalities:
 |
4 |
with free parameters gi, to be optimized for maximum inseparability. We have omitted the superscript N here for clarity, as the above holds for any mode basis. The subscripts n
 and
and  here indicate the nth mode in the N-mode basis. Table 1 summarizes the measured degrees of inseparability for all N−1 inequalities in each N-mode basis, given in roman numerals. Table 2 summarizes the more stringent inseparability required for unweighted cluster states (all homodyne gains {gi} are set to 1). The relevant inseparability inequalities satisfy the cluster state quadrature relationship written in the form of equation (4), and are written out explicitly in the Methods for reference.
Table 1. Inseparability of entangled modes.
| N | I | II | III | IV | V | VI | VII | Average |
|---|---|---|---|---|---|---|---|---|
| 2 | 0.39 | 0.39 | ||||||
| 3 | 0.56 | 0.56 | 0.56 | |||||
| 4 | 0.64 | 0.63 | 0.64 | 0.64 | ||||
| 5 | 0.69 | 0.69 | 0.70 | 0.70 | 0.69 | |||
| 6 | 0.73 | 0.73 | 0.75 | 0.74 | 0.74 | 0.74 | ||
| 7 | 0.77 | 0.78 | 0.77 | 0.76 | 0.77 | 0.77 | 0.77 | |
| 8 |
0.79 |
0.79 |
0.78 |
0.81 |
0.79 |
0.80 |
0.79 |
0.79 |
Data are based on the van Loock–Furusawa criteria, given in equation (4). Each row shows that for a basis of N quantum modes, the N−1 values obtained from quadrature variances are well below 1. This verifies entanglement of the N modes.
Uncertainty is ±0.01 in all cases.
Table 2. Inseparability of cluster states.
| N | I | II | III | IV | Average |
|---|---|---|---|---|---|
| 2 | 0.39 | 0.39 | |||
| 3 | 0.49 | 0.70 | 0.59 | ||
| 4 | 0.79 | 0.67 | 0.84 | 0.76 | |
| 5 |
0.79 |
0.67 |
1.10 |
1.18 |
0.93 |
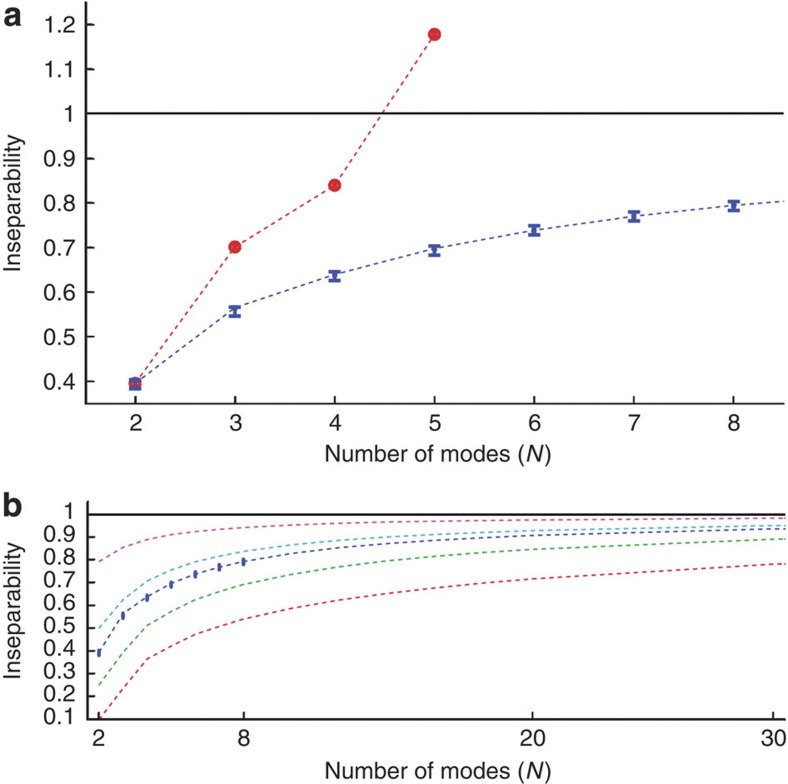
The terms in equation (4) measure the degree of correlations between any two modes in a given basis. For the modes to be inseparable, each of these correlation variances (correlations in the x quadrature and anticorrelations in the p quadrature) must be in the quantum regime, that is below the normalized quantum noise of two units of vacua. Figure 4c,d shows this to be the case in our experimental measurements. Although we are limited here to eight modes owing to our detector, this scheme is scalable to higher numbers of mode entanglement even without increasing the number of squeezing resources, as shown in the simulation traces of Fig. 5. As we increase the simulated number of modes in the basis up to 30, the degree of inseparability approaches the classical bound of 1 owing to the vacuum noise penalty for each additional unsqueezed mode input. Entanglement is shown to hold here, however, even with current squeezing levels. Importantly, there is no loss incurred during the transformation of the squeezed input modes into a set of entangled modes, as can be seen by the agreement of the theoretical predictions and the experimental values of Fig. 5a. This equates to perfect mode matching at every virtual beamsplitter. Figure 5b explores how inseparability scales with different squeezing levels. Measuring a larger number of inseparable modes experimentally requires only an increase in the number of photodiodes in the MPHD, and importantly no modification of the optical setup. Note that this is not true for cluster states, and the number of squeezed inputs must be increased accordingly.
Figure 5. Inseparability for different entangled mode bases.
The solid black line represents the bound of separability. Dashed lines represent theory. All uncertainties for experimental values are ±0.01. (a) The blue markers are the averaged measured experimental values for N-mode inseparability (right column of Table 1), and the dashed blue line joins the theoretical values of inseparability with the same two squeezed inputs used in the experiment. All experimental losses have been taken into account. The red circles are the measured experimental values for N-mode cluster states with theory indicated again by the dashed red line. Here the maximum value of each row in Table 2 is shown rather than the average value, in order to show that cluster states have a much more stringent requirement on squeezing levels (N=5 is clearly separable and not a cluster state). (b) All traces have two squeezed inputs and N−2 vacua modes, as in the experiment. What changes is the amount of squeezing in the two squeezed inputs, assumed here to be symmetric with equal antisqueezing. From the top we have: −1 dB (magenta); −3 dB (cyan); experimental parameters (blue); experimental values (blue markers); −6 dB (green); and −10 dB (red).
For the special case of N=2, optimal EPR entanglement20 is measured to be 0.58±0.01. Optimizing for the beam-splitter reflectivity21,22, we find that owing to the slight asymmetry between input squeezing levels, the optimal beam-splitter ratio here is not 50%, but rather 48.8%, leading to a very slight improvement over the symmetric network. Each unique beam-splitter reflectivity changes the mapping of Unet such that formally the beam of light contains an infinite number of mode bases. The versatility of our scheme comes from being able to match the detection basis to a network that has been optimized for an arbitrary set of inputs.
The entanglement demonstrated in the current work allows for such protocols as quantum teleportation7,23,24. To perform complex protocols such as one-way measurement-based quantum computations2,25,26, we need to increase the degrees of freedom in our detection scheme as follows. First, we need to introduce the ability to measure each mode in an arbitrary phase quadrature at the MPHD. This may be achieved by manipulating the phases between the copropagating entangled modes. By introducing a unitary mode-shaping device such as that explained in references27,28, such access to individual phases becomes possible. These papers describe a process of manipulating both the amplitudes and phases of spatial modes in a lossless fashion via an adaptive process utilizing a network of deformable mirrors and lenses.
Second, in order to perform teleportation-based computations, we require the ability to feed-forward the measurement results of arbitrary cluster nodes to remaining cluster nodes. This may be realised by combining a specifically shaped displacement beam containing the necessary phase space displacements with the beam containing the copropagating modes. By shaping the displacement beam to spatially match a specific mode to be displaced, it will interfere only with the desired mode owing to the orthogonal nature of the spatial mode basis. These modifications are feasible with existing technologies29.
Emulating linear optics networks by mixing copropagating spatial modes is a highly efficient method for generating multimode entanglement. Otherwise arduous and potentially lossy tasks such as mode matching during the construction of a linear optics network are performed effortlessly and losslessly via software-controlled combinations of the spatial modes. We have shown that although correlations weaken if more squeezing resources are not added, (non-cluster) entangled modes scale here as the number of orthogonal modes measurable within the beam. The maximum number of measurable modes corresponds directly to the number of photodiodes in each pair of the multi-pixel detectors. We have demonstrated this by measuring N=2, 3, 4, 5, 6, 7 and 8-mode entanglement within one beam, including up to 4-mode cluster states, switching between them in real time. The ability to perform a wide range of protocols and optimize networks for asymmetry using just one optical setup offers versatility to future networks that will utilize entanglement as a resource.
Methods
Experimental setup
We use a dual-wavelength continuous-wave Nd:YAG laser at 1,064 nm and 532 nm. The OPAs each contain a periodically poled KTP crystal in a bow-tie cavity. The squeezed beams are almost identical in purity, with squeezing levels of ∼−6 dB and antisqueezing of 8.5 dB. The beam containing the eight spatially orthogonal modes (see main text) is made highly elliptical in order to be measured by the MPHD, which has a linear array of eight photodiodes. The photodiode array used is a Hamamatsu InGaAs PIN photodiode array (G7150), which actually has 16 photodiodes. However, we choose to use only eight of these in the present experiment. The filling factor for the array is 90%, meaning that 10% of the light does not hit an active surface. The quantum efficiency for the photodiodes is 80%.
Virtual networks
For even-numbered mode bases (N=2, 4, 6 and 8), the method for creating the virtual network is as follows. The two squeezed modes a1 and a2 are combined on a half reflecting beamsplitter (HBS). As the output of this HBS is an EPR state, we choose to call this the EBS. The EBS outputs are symmetrically combined with N−2 vacua, as in Fig. 1 of the main text. The beamsplitters (BSs) are then given by  where n is the number of BSs between the EBS and the BS in question. For N=4 and N=6 and N=8, mode output 2 is swapped with mode output N−1. For N=8, an additional swap of output modes 4 and 5 is made. For odd-numbered mode bases (N=3, 5 and 7), the method is the same with the following modifications. The EBS has its reflectivity changed to r = 1/2 − 1/(2N) (see, for example, refs 30,31 for more details on N=3). The vacua are mixed using beamsplitters as above, with one output arm having one less vacuum input. π phase shifts are applied to all BS outputs on the left of the EBS except for the one left output exiting the last BS. Mode outputs 1 and N−1 are swapped, and the network for N=7 has an additional swap between output modes 3 and 4. The homodyne gains gi are optimized using a genetic algorithm in order to maximally satisfy the van Loock–Furusawa inequalities. These gains gi scale the contributions of the quadrature variances and are independent from calculations regarding Unet. Here, optimal homodyne gains are calculated using two measures: minimizing the mean of the N−1 inequalities; and minimizing the variance of the set of inequalities. A trade-off between the two measures is needed, and preference is given to minimizing the mean of the inequalities.
Spatial mode bases
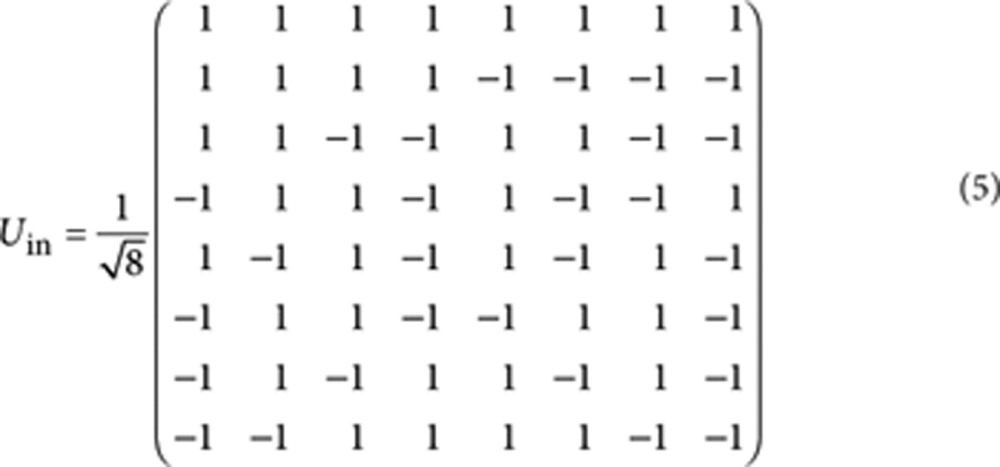
The input matrix is defined as follows:
 |
5 |
with  . Each row of Uin represents the eight electronic gains that match the detection basis to the input modes. For example, the top row containing all ones recovers the standard GM, and the second row recovers the phase-flipped FM. By setting Unet=I, we can label each row of Uin as
  . Formally,
  ON,(8−N))Uin, where ON,(8−N) is a zero matrix of size N by (8−N).
The linear optics network for the ideal and symmetric 2-mode EPR basis is simply a HBS:
 |
6 |
From equation (4) we get:
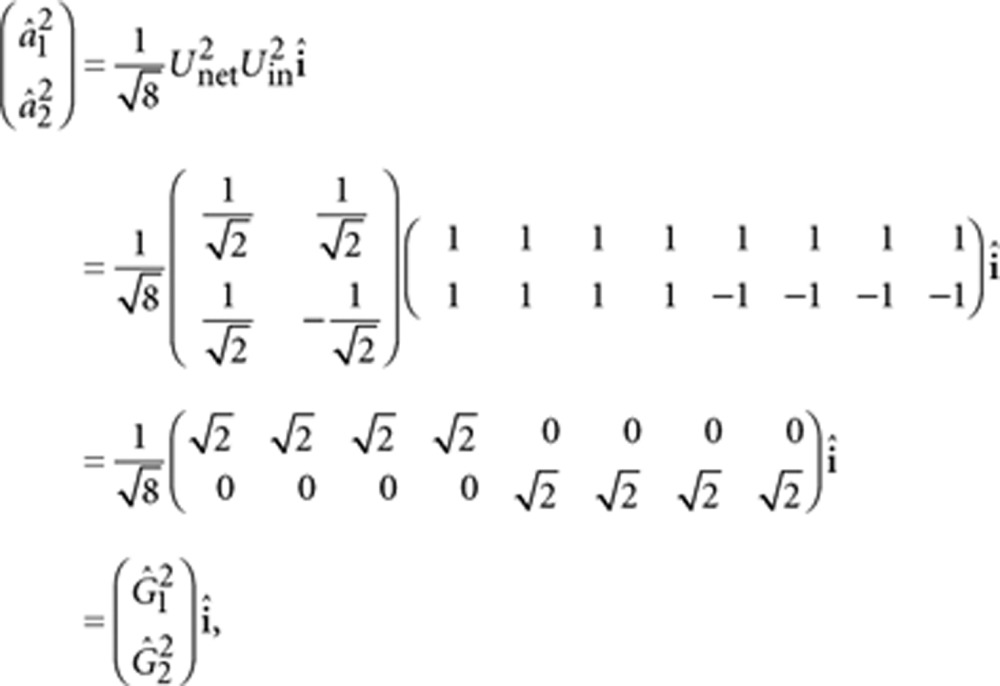 |
from which we see that indeed  and
and  share no part of the detected light. We show this ideal EPR basis in Fig. 2 in order to emphasize the spatial separation. Note that the factor
  has been omitted from the scale in Fig. 2 for clarity.
The optimized network uses a beam-splitter reflectivity of 48.8%, and produces the following output modes:
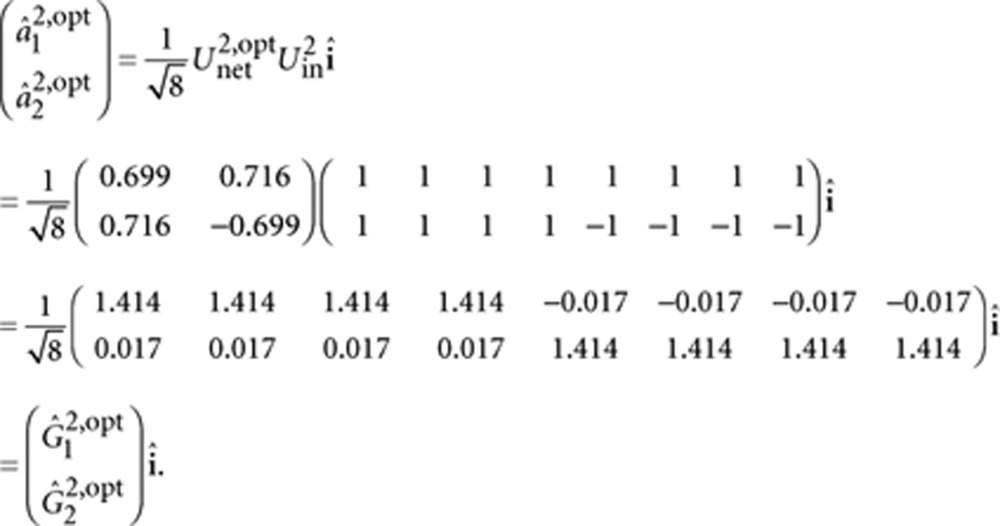 |
Measuring cluster states
The difference between a 2-mode cluster state and a 2-mode EPR state is a Fourier transform on one mode. The Fourier transform is a rotation of π/2 degrees:
 |
7 |
Therefore, we get 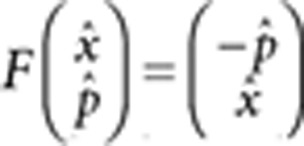 . It follows that the homodyne measurements we perform in the 2-mode cluster basis {p1−x2, p2−x1}cluster and the 2-mode EPR basis {x1−x2, p1+p2}EPR are equivalent. Therefore, we may perform local Fourier transforms so long as we can match the homodyne detection basis for individual modes. It is important to note that this convenient basis change will not always be possible for different clusters. However, by shaping the local oscillator we may have access to arbitrary cluster states within the one beam. This was out of scope for the current experiment.
The criteria for verifying the measurements of the various cluster states are given below15,17 with the results summarized in Table 2:
 |
8 |
 |
9 |
 |
10 |
 |
11 |
Author contributions
S.A., J.-F.M., J.J., N.T. and H.-A.B. designed the experiment. J.J. designed and built both of the OPAs. S.A., J.-F.M. and J.J. constructed and performed the experiment. B.H. designed and built the multi-photodiode homodyne detectors, taught S.A. how to code the digital locking system and designed the software filters used in data analysis. P.K.L. and H.-A.B. supervised the experiment. S.A. calculated and optimized the virtual networks, performed the data analysis and wrote the manuscript. J.-F.M. wrote the data acquisition code and provided support in the data analysis.
Additional information
How to cite this article: Armstrong, S. et al. Programmable multimode quantum networks. Nat. Commun. 3:1026 doi: 10.1038/ncomms2033 (2012).
Acknowledgments
This research was conducted by the Australian Research Council Centre of Excellence for Quantum-Atom Optics (project number CE0348178), in collaboration with the network 'High-dimensional entangled systems' (HIDEAS FP7-ICT-221906) funded by the European Union, as well as the Australian Research Council Centre of Excellence for Quantum Computation and Communication Technology (Project number CE110001027). We thank Akira Furusawa and the Furusawa group for discussions. S.A. is grateful for funding from the Australia-Asia Prime Minister`s Award. B.H. acknowledges funding from the Alexander von Humboldt foundation.
References
- Furusawa A. & van Loock P. Quantum Teleportation and Entanglement (Wiley-VCH, Weinheim, 2011). [Google Scholar]
- Raussendorf R. & Briegel H. J. A one-way quantum computer. Phys. Rev. Lett. 86, 5188–5191 (2001). [DOI] [PubMed] [Google Scholar]
- Menicucci N. C. et al. Universal quantum computation with continuous-variable cluster states. Phys. Rev. Lett. 97, 110501 (2006). [DOI] [PubMed] [Google Scholar]
- Kimble J. The quantum internet. Nature 453, 1023–1030 (2008). [DOI] [PubMed] [Google Scholar]
- Yao X. -C. et al. Experimental demonstration of topological error correction. Nature 482, 489–494 (2012). [DOI] [PubMed] [Google Scholar]
- Aoki T. et al. Quantum error correction beyond qubits. Nat. Phys. 5, 541–546 (2009). [Google Scholar]
- van Loock P. & Braunstein S. L. Multipartite entanglement for continuous variables: a quantum teleportation network. Phys. Rev. Lett. 84, 3482–3485 (2000). [DOI] [PubMed] [Google Scholar]
- Janousek J. et al. Optical entanglement of co-propagating modes. Nat. Photonics 3, 399–402 (2009). [Google Scholar]
- Lassen M., Leuchs G. & Andersen U. L. Continuous variable entanglement and squeezing of orbital angular momentum states. Phys. Rev. Lett. 102, 163602 (2009). [DOI] [PubMed] [Google Scholar]
- Pysher M., Miwa Y., Shahrokhshahi R., Bloomer R. & Pfister O. Parallel generation of quadripartite cluster entanglement in the optical frequency comb. Phys. Rev. Lett. 107, 030505 (2011). [DOI] [PubMed] [Google Scholar]
- Beck M. Quantum state tomography with array detectors. Phys. Rev. Lett. 84, 5748–5751 (2000). [DOI] [PubMed] [Google Scholar]
- Dawes A. M. & Beck M. Mode optimization for quantum-state tomography with array detectors. Phys. Rev. A 67, 032102 (2003). [DOI] [PubMed] [Google Scholar]
- Delaubert V. Generation of a phase-flipped Gaussian mode for optical measurements. J. Opt. A 4, 393–399 (2002). [Google Scholar]
- Einstein A., Podolsky B. & Rosen N. Can quantum-mechanical description of physical reality be considered complete? Phys. Rev. 47, 777–780 (1935). [Google Scholar]
- van Loock P., Weedbrook C. & Gu M. Building Gaussian cluster states by linear optics. Phys. Rev. A 76, 032321 (2007). [Google Scholar]
- Nielsen M. A. Cluster-state quantum computation. Rep. Math. Phys. 57, 147–161 (2006). [Google Scholar]
- Yukawa M., Ukai R., van Loock P. & Furusawa A. Experimental generation of four-mode continuous-variable cluster states. Phys. Rev. A 78, 012301 (2008). [Google Scholar]
- Su X. et al. Experimental preparation of quadripartite cluster and Greenberger-Horne-Zeilinger entangled states for continuous-variables. Phys. Rev. Lett. 98, 070502 (2007). [DOI] [PubMed] [Google Scholar]
- van Loock P. & Furusawa A. Detecting genuine multipartite continuous-variable entanglement. Phys. Rev. A 67, 052315 (2003). [Google Scholar]
- Reid M. D. & Drummond P. D. Quantum correlations of phase in nondegenerate parametric oscillation. Phys. Rev. Lett. 60, 2731–2733 (1988). [DOI] [PubMed] [Google Scholar]
- Bowen W. P., Lam P.- K. & Ralph T. C. Biased EPR entanglement and its application to teleportation. J. Mod. Opt. 50, 801–813 (2003). [Google Scholar]
- Wagner K. et al. Asymmetric EPR entanglement in continuous variable systems, Preprint at http://arxiv.org/abs/1203.1980v1 (2012).
- Bennett C. H. et al. Teleporting an unknown quantum state via dual classical and Einstein-Podolsky-Rosen channels. Phys. Rev. Lett. 70, 1895–1899 (1993). [DOI] [PubMed] [Google Scholar]
- Furusawa A. et al. Unconditional quantum teleportation. Science 282, 706–709 (1998). [DOI] [PubMed] [Google Scholar]
- Ukai R. et al. Demonstration of unconditional one-way quantum computations for continuous variables. Phys. Rev. Lett. 104, 240504 (2011). [DOI] [PubMed] [Google Scholar]
- Ukai R. et al. Universal linear Bogoliubov transformations through one-way quantum computation. Phys. Rev. A. 81, 032315 (2010). [Google Scholar]
- Morizur J. -F. et al. Programmable unitary spatial mode manipulation. J. Opt. Soc. Am. A 27, 2524–2531 (2010). [DOI] [PubMed] [Google Scholar]
- Morizur J. -F., Armstrong S., Treps N., Janousek J. & Bachor H. -A. Spatial reshaping of a squeezed state of light. Eur. Phys. J. D 61, 237–239 (2011). [Google Scholar]
- Morizur J. -F. Quantum Protocols with Transverse Spatial Modes (PhD Thesis, Aust. Nat. Univ., 2011). [Google Scholar]
- Aoki T. et al. Experimental creation of a fully inseparable tripartite continuous-variable state. Phys. Rev. Lett. 91, 080404 (2003). [DOI] [PubMed] [Google Scholar]
- Braunstein S. L. Quantum error correction for communication with linear optics. Nature 394, 47–49 (1998). [Google Scholar]


