

Abstract
Events mediating transformation from the pre-malignant monoclonal gammopathy of undetermined significance (MGUS) to multiple myeloma (MM) are unknown. We analyzed a gene expression datasets generated on the Affymetrix U133 platform from 22 MGUS and 101 MM patients using gene-set enrichment analysis. Genes over-expressed in MM were enriched for cell cycle, proliferation and MYC activation gene-sets. Upon dissecting the relationship between MYC and cell cycle genesets, we identified and validated a MYC activation signature dissociated from proliferation. Applying this signature, MYC is activated in 67% of myeloma, but not in MGUS. This was further confirmed by immunohistochemistry using membrane CD138 and nuclear MYC double staining. We also showed that almost all tumors with RAS mutations expressed the MYC activation signature, and multiple mechanisms may be involved in activating MYC. MYC activation, whether assessed by gene expression signature or immunohistochemistry is associated with hyperdiploid MM, and shorter survival even in tumors that are not proliferative. Bortezomib treatment is able to overcome the survival disadvantage in patients with MYC activation.
Keywords: Myeloma, MYC, Bortezomib, MGUS, Hyperdiploid
Introduction
Multiple myeloma is a B-cell malignancy characterized by an accumulation of neoplastic plasma cells that usually secrete monoclonal proteins. Recent studies have shown that most if not all patients with myeloma have a preceding monoclonal gammopathy of undetermined significance phase1, 2.
The primary genetic events involved in disease initiation have been well established in myeloma. Translocations involving maf genes, t(4;14), t(11;14), and hyperdiploidy, with its typical pattern of trisomies of chromosome 3, 5, 7, 9, 11, 15, 19, 21, are present in about 90% of all myeloma 3. These abnormalities are already present in MGUS, often times in patients without transformation to MM for many years 4-6. Large-scale epidemiological studies showed that MGUS progress to MM at the rate of 1% per year 7. These data suggest that secondary or cooperating genetic events are probably required for MGUS to MM transition. However, these secondary genetic events have not been identified. The best characterized genetic difference between MGUS and MM is RAS mutations which is extremely rare in MGUS and present in about 20-30% of newly diagnosed MM 8, 9. An initial gene expression analysis showed that the expression profile of MM and MGUS is very similar 10. A more recent analysis using a denser chip and larger number of patients indentified some genes that are differentially expressed but the functional implications of these genes are unknown 11.
In this study, we derived and validated a MYC activation signature that is dissociated from cell cycle / proliferation and showed that this signature is activated in about two-thirds of MM but not MGUS. In addition, MYC activation is associated with unique genetic subtypes, is functionally relevant and identifies patient with poorer diagnosis, who responds better to bortezomib and has improved outcome compared to dexamethasone.
Materials and Methods
Primary Gene expression dataset
Gene expression was performed on CD138+ selected bone marrow PCs using the Affymetrix U133A chip from 15 healthy donors, 22 MGUS, and 101 MM from the Mayo Clinic (GEP data are available from GEO, accession #GSE6477). RNA isolation, purification, and microarray hybridization have previously been reported 12. Samples were collected after informed consent was obtained in accordance with the Declaration of Helsinki, and the study was approved by the Mayo Clinic Institutional Review Board.
Gene expression analysis
Gene expression intensity values were generated using the Affymetrix MAS 5.0 software, median-centered, and analyzed using GeneSpring 7.3.1 (Agilent Technologies, Palo Alto, CA). To examine the biological and functional relevance of the differentially expressed genes between MM and MGUS, we performed gene set enrichment analysis (GSEA), which has been described elsewhere 13.
To define the enrichment of MYC pathway genes and the other correlated pathways or functional program at the individual sample level, we made a modification to the GSEA algorithm, called iGSEA (individual sample GSEA) that allow us to generate enrichment scores for different genesets for individual samples. Using a method analogous to leading edge analysis, several core gene signatures were derived from highly correlated genesets that may represent similar biological processes or pathways. We further summarized the expression of genes constituting the core gene signatures into a single value using iPASA (see supplementary methods for details) so that each signature is represented by a number on a continuous scale.
IHC
The C-MYC and CD138 IHC double stain was carried out using the BondMax Autostainer (Leica Microsystems) which utilizes the Define Polymer technique. Five-μm tissue section containing the tissue microarrays (TMA) was placed onto the BondMax with covertile positioned over the slide, which was deparaffinized and hydrated. Heat-induced epitope retrieval was accomplished for C-MYC using ER1 for 20 min. Endogenous peroxidase was blocked using hydrogen peroxide. For detection of C-MYC, we used a new anti-C-MYC antibody that has been validated using control experiments with genetically defined C-MYC expression 14.The slide was incubated in the first primary antibody, C-MYC (Epitomics, clone Y69, 1:50), for 30 mins followed by incubation in a post-primary DAB for 10 mins, polymer DAB for 10 mins and chromogen DAB for 10 mins (Bond Polymer Refine detection kit, catalogue no. DS9800). Subsequently, heat-induced epitope retrieval was performed for the second primary antibody, CD138, using ER1 for 20 min. This was followed by incubation with the second primary antibody, CD138 (DAKO, clone MI 15, 1:100) for 30 mins, application of the post-primary AP for 20 mins, polymer AP for 30 mins and Fast Red for 20 mins (Bond Polymer AP Red detection kit, catalogue no. DS9305). The nuclei were counterstained with hematoxylin and the slide dehydrated, cleared in xylene and coverslipped. Appropriate positive controls were used. The number of plasma cells expressing C-MYC was counted and scored as a percentage of the total CD138-positive plasma cell population
Detection of RAS Mutation
RAS mutation was detected as previously described 8. Briefly, polymerase chain reaction (PCR) primers were designed to amplify DNA segments of K-RAS and NRAS codon 12, 13 and 61. The radiolabeled amplicons were run through 15% mild-denaturing 0.4 mm polyacrylamide gel for 4 hours at 40 watts. The gel was dried and placed on a phosphorimager screen for analysis. Abnormal banding patterns were subsequently directly sequenced.
Statistical Analysis
The Student's test was used for comparison of continuous variables. Categorical variables were compared using the chi-square or Fisher's exact test. The distribution for progression-free survival (PFS) and overall survival (OS) was estimated using the method of Kaplan and Meier. The log-rank test was used to test for differences in survival between groups. P < 0.05 was considered significant.
Results
Derivation and Validation of Proliferation Dissociated MYC signature
We have previously shown that MYC and cell cycle related genesets are enriched in MM compared to MGUS15. It is unclear whether the enrichment of MYC genesets are due to greater proliferation of MM cells or implicated actual activation of the MYC pathways. To delineate this, we examined the genes that were enriched in the different MYC genesets and cell cycle genesets using the leading edge analysis tool in GSEA. Although some of the enriched genes in the MYC genesets were also enriched in the cell cycle genesets, there was a cluster of genes that was consistently enriched in the different MYC genesets but not in cell cycle / proliferation genesets (Figure 1a). These genes are involved in different functions not necessarily related to cell cycle, most of them have been validated as DNA binding target of MYC and all of them are upregulated by MYC (http://www.myccancergene.org/, supplementary table 1), suggesting that this will constitute a good gene signature for MYC activation that is dissociated from cell cycle and proliferation.
Figure 1. Derivation and Validation of MYC signature dissociated from cell cycle.


(a) Leading edge analysis of enriched MYC and cell cycle genesets identified a set of genes which are consistently enriched (red squares) across the different MYC genesets (in black box) that are not enriched in the cell cycle genesets. This set of genes constitutes our MYC signature that is dissociated from cell cycle and proliferation. In the grid, the columns represent genes that constitute the main enrichments (leading edge genes) in the different genesets (row). We then validated this signature in a (b) mouse fibroblast and (c) human mammary cell line gene expression dataset. In the heatmaps, each row represents a gene and each column a sample. Red represents upregulation and blue downregulation of the respective genes.
To further validate this signature, we examined the expression of these genes in 2 independent dataset where the objective of the original studies was to overexpress different oncogenes in either mouse fibroblast (GEO Accession GSE3151) 16 or human mammary cell lines (GEO Accession GSE3158) 17 to identify oncogene specific gene expression signatures. Our MYC activation signature was over-expressed in the cell lines transfected with MYC in both datasets but not those cells lines with RB knocked out or over-expressing E2F, which were also expected to be proliferative. A consistent observation was the expression of this signature in cell lines expressing activating RAS mutation in both datasets. This may suggest a relationship between activating RAS mutations and MYC activation (Figure 1b and 1c).
MYC Activation Signature is expressed in MM but not MGUS
Having defined and validated a MYC activation signature that is dissociated from cell cycle or proliferation, we assessed this signature in human myeloma dataset, together with other cell types for comparison: normal B-cells, normal plasma cells, Burkitt's lymphoma, chronic lymphocytic leukemia and Waldenstroms macroglobulinemia 18. As expected, the signature was expressed highly in Burkitt's lymphoma, which harbours IgH-MYC translocations. The signature was not expressed in normal plasma cells or MGUS but was expressed in about 67% of myeloma (Figure 2a). When the MYC activation signature was summarized as the MYC Activation Index (MAI) using the median expression of the genes constituting the signature, the MAI was similar between new MM and relapse MM but significantly higher than normal plasma cells and MGUS (p < 0.001) (Figure 2b). It was also apparent that some tumors with low proliferation and low expression of MYC also have a high MAI. This suggests that there may be different mechanisms that lead to MYC activation. As we had observed an association between activating RAS mutation and expression of the MYC signature in the different validation datasets, we assessed our patient dataset for such an association. Indeed, almost all cases with RAS mutations (there is no difference between the percentages of K- and N-RAS mutations in those with high and low MAI, so both are analyzed together as RAS mutants) had a high MAI, confirming our previous observation. Of note, some MM have very high MYC mRNA expression that are possibly driven by IgH-MYC translocations but do not have RAS mutations and vice versa (Figure 2c).
Figure 2. Expression of MYC activation signature in MM and not MGUS.


(a) The derived MYC signature is highly expressed in Burkitt's lymphoma and also expressed in a substantial number of MM but not MGUS. (b) When the MYC activation signature is summarized as the MYC Activation Index (MAI), based on median expression of genes constituting the signature, it is significantly higher in both newly diagnosed and relapsed MM compared to MGUS and normal plasma cells (NPC). The MAI is similar in both new and relapse MM. (c) The samples are arranged according to the MAI. Each row represents a different parameter, with MAI followed by proliferation index, and MYC mRNA expression. In the MAI row, the colored bars represent samples with RAS mutations (red), ‘spiked’ MYC expression (5 fold or greater expression than median) and both RAS mutations and ‘spiked’ MYC expression (green). It is clear that RAS mutations and ‘spiked’ MYC expression (resulting from IgH-MYC translocations) are generally mutually exclusive. Amongst the MM with high MAI, some of them have low proliferation (PI) or low expression of MYC itself or both.
Other Pathways Enriched in MM Compared to MGUS
Using iGSEA and leading edge analysis of correlated genesets, a number of core signatures were identified. Besides MYC and proliferation, proteasome, tRNA, metabolic pathway and interferon (IFN) pathway genesets were also enriched. In addition, there is a close correlation between MYC activation, proliferation, tRNA synthesis, increase proteasome subunits and metabolic activity. On the other hand, a subgroup of MM has mainly enrichment of IFN genes without enrichment of MYC and the other correlated signatures (Figure 3a). Similar pattern and relation was seen in a separate MM GEP dataset from UAMS (Supplementary Figure 1).
Figure 3. Core Signatures correlated with MYC activation signature.


(a) In the Mayo MM dataset, enrichment for MYC, Cell cycle, proteasome, tRNA and metabolic genesets are highly correlated whereas the IFN pathway genesets are enriched in a subset of MM without MYC activation. (b) In the P493-6 cell line model where MYC expression can be manipulated and graduated. Similar patterns among these pathways are seen. In addition, increasing MYC expression and activation also lead to suppression of NFKB signature extracted from 2 recent studies designated as NFKB_9 29 and NFKB_New 51.
To further investigate the relationship between these pathways, we assessed their expression in the P493-6 cell line model system (GEO Accession GSE 19703) 19 using iPASA. The P493-6 cells were established from primary peripheral blood B cells 20, 21. This cell line was immortalized by an Epstein-Barr viral (EBV) genome that was complemented with an Epstein-Barr Nuclear Antigen-Estrogen Receptor (EBNA2-ER) fusion protein and a tetracycline repressible MYC transgene. It is therefore possible to manipulate the cells to achieve at least three states of MYC activation22. Using this model system, we showed that all of these core signatures except the IFN signature were induced upon MYC activation (Figure 3b), similar to the pattern observe in the tumors expressing the MYC activation signature in the clinical datasets.
MYC Activation and IRF4 Activity
A recent study suggests that MM cells are addicted to aberrant IRF4 activation and that IRF4 forms a positive auto-regulatory loop with MYC in MM 23. When we assess the IRF4 index (calculated from 35 IRF4 target genes23 using iPASA) in our dataset, MM with high MAI have higher IRF4 Index (mean±SD, 2.43±0.29 versus 1.14±0.23, p-value = 0.005). This provides further evidence that the MAI is identifying functionally relevant MYC activation.
MYC activation and the NFKB pathway
The activity of the NFKB pathway can be modulated by MYC and vice versa 24-27. Indeed, the tumors with MYC activation (higher MAI) had lower expression of NFKB gene signature (mean NFKB Index, calculated as median expression of genes constituting the NFKB signature, 0.94±0.6 versus 1.35±0.9 arbitrary units, t-test p-value = 0.01). This relation was also seen upon modulation of MYC expression in the P493-6 cell line system (Figure 3b).
MYC staining on IHC correlates with MYC activation signature
Using double staining for surface CD138 and nuclear MYC by IHC in 48 MM cases (36 newly diagnosed and 12 relapse) and 8 MGUS (Figure 4), MYC activation was not detected in MGUS but was identified in 29 out of 48 (60%) MM (p-value = 0.07) (Table 1). This confirms that MYC is activated in a substantial proportion of myeloma but not in the premalignant MGUS.
Figure 4. Expression of MYC is present in CD138 positive plasma cells in MM but not MGUS by IHC, and increase with increasing MAI.

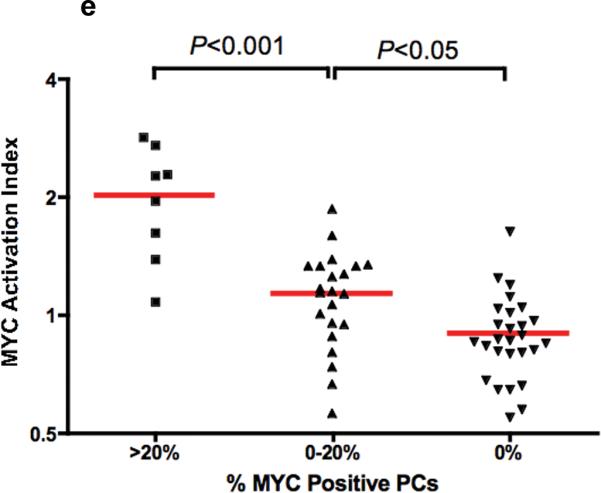
These bone marrow sections are double-stained with CD138 (red - membrane) and MYC (brown -nuclear). (A) MM with high CD138 infiltration showing positivity for nuclear MYC expression in CD138 positive cells (3 examples indicated by open arrowheads). However, there are MM cases with both (B) high or (C) low CD138 plasma cell infiltration that are negative for MYC. (D) CD138 positive plasma cells in MGUS are universally negative for nuclear MYC (2 examples indicated by closed arrowheads). (e) The MAI increase significantly across the categories of increasing percentage of MYC positive plasma cells.
Table 1.
Correlation of Genetic and Clinical Parameters with MYC staining
| %MYC Positive PCs |
||||
|---|---|---|---|---|
| 0% | 0-20% | >20% | p-value | |
| Stage | 0.007 | |||
| MM | 19 | 21 | 8 | |
| MGUS | 8 | 0 | 0 | |
| Ploidy | 0.005 | |||
| H | 7 | 17 | 3 | |
| NH | 12 | 3 | 5 | |
| 13 Deletion | 0.36 | |||
| Yes | 8 | 7 | 5 | |
| No | 11 | 14 | 3 | |
| TC Class | ||||
| 11q13+6p21 | 7 | 2 | 1 | 0.09 |
| 4p16 | 0 | 1 | 3 | 0.004 |
| D1 & D1+D2 | 6 | 16 | 2 | 0.006 |
| D2 | 4 | 0 | 1 | 0.09 |
| Maf | 1 | 2 | 1 | 0.8 |
The percentage of plasma cells with MYC expression is variable. As the distribution of the clinical parameters and the percentage of MYC staining cells was not statistically different between the newly diagnosed and relapse MM in our TMA dataset (supplementary table 2), we grouped them together for analysis. The percentage of MYC staining cells increases with increasing MAI (Figure 4e).
Genetic and clinical association of MYC expression
High MYC expression (>20% PCs) was significantly more common in tumors with t(4;14) although numbers were small while MYC expression (<20%) was significantly more common in tumors over-expressing CCND1 with or without CCND2 (Table 1). As most tumor over-expressing CCND1 are hyperdiploid, we sought to assess if a high MAI was more common in hyperdiploid MM. Indeed, in the Mayo dataset where ploidy was assessed using FISH, MAI > 1 was found in 81% (46 of 57) of patients with hyperdiploid MM and only 62% (26 of 42) of patients with non-hyperdiploid MM (2-sided Fisher's Exact test p-value = 0.04).
We also assessed the association of MAI with clinical parameters such as PCLI, beta-2 microglobulin, and ISS stage. Patients with MAI > 1 had higher PCLI (median 1 versus 0.25, p=0.007) and ISS III disease (90% ISS III versus 62% ISSI/II have high MAI, p=0.03) although there is no difference in beta-2 microglobulin level (median 3.89 versus 2.6 mg/dL, p=0.15).
In order to investigate the prognostic impact of MYC expression separate from proliferation, we excluded tumors with PCLI greater than one from the survival analysis. Of the remaining tumors, the PCLI of tumors with or without MYC staining was similar (data not shown), yet patients with MYC expressing tumors still had significantly shorter survival suggesting that the prognostic impact of MYC expression is independent of proliferation (Figure 5a). As there is an association between MYC activation by IHC and the gene expression based MAI, we assessed the prognostic impact of MAI on survival. Indeed, amongst new diagnosed MM patients, patients with MAI >1 have significantly shorter survival, even when only patients with lowly proliferative tumors were assessed (Figure 5b).
Figure 5. Survival according to the MAI and MYC staining by IHC.

(a) When only newly diagnosed tumors with PCLI<1 are analyzed, those with no MYC staining (n=13) still have significantly longer survival than those with MYC staining (n=13) (median survival 77.7 mths versus 37.9 months, log-rank p-value = 0.04). (b) Overall survival is significantly shorter in newly diagnosed MM patients with high MAI compared to those with low index even when only patients with low proliferation are considered (median survival 39.2 mths versus not yet reached; log-rank p-value 0.007). (c) In patients entered into a randomized study of bortezomib versus dexamethasone, those with MAI > 1 have significantly better PFS when treated with bortezomib compared to dexamethasone (6.3 months (n=37) compared to 2.9 months (n=28), log-rank p-value = 0.02). (d) In contrast, for those patients with MAI ≤ 1, there is no difference in PFS with either treatment (5.6 months (n=43) versus 3.5 months (n=48), log-rank p-value = 0.34).
Recent studies have shown that bortezomib-induced apoptosis is via tumor specific upregulation of NOXA in a MYC dependent manner 28. We therefore hypothesize that tumors with MYC activation may be more sensitive to bortezomib treatment. We analyzed a gene expression dataset of MM patients entered into a randomized study of bortezomib versus dexamethasone to determine if there was any relationship between the MAI and outcome with bortezomib. Although single agent bortezomib is rarely used in clinical practice now, this dataset is ideal for testing if bortezomib treatment itself may have an impact on MYC expressing tumors. Consistent with our hypothesis, patients with MAI > 1 had significantly better response (57% versus 27%, p-value = 0.03) to bortezomib whereas response rates to bortezomib and dexamethasone were similar for patients with MAI ≤ 1 (51% versus 48%, p-value = 0.83). This was translated into better PFS and OS for patients with MAI>1 when treated with bortezomib compared to dexamethasone. On the other hand, this benefit was not observed in patients with MAI ≤ 1 (Figure 5c and 5d and supplementary figure 2).
Furthermore, as we had demonstrated similar advantage for bortezomib in patients with low TRAF3 expression previously29, we wanted to assess the association between the MAI and TRAF3 level. Treating the normalized expression values as continuous variables, there was no correlation between the MAI and TRAF3 expression levels with a Pearson correlation coefficient of -0.07 (p-value = 0.38). When we categorized patient into those with MAI>1 (MYC activation) and TRAF3<0.6 (TRAF3 inactivation), there was again no association (Fisher's exact p-value = 0.56). When we assessed the interactions between TRAF3 expression levels and MAI on outcome following Bortezomib treatment compared to dexamethasone, only patients with MAI>1 and TRAF3<0.6 had significantly better PFS when treated with bortezomib compared to dexamethasone. In terms of OS, there was a trend towards better OS for patients with MAI>1 regardless of TRAF3 level when treated with bortezomib compared to dexamethasone. On the other hand, in patients with MAI≤1, even when TRAF3<0.6, the OS was similar between those treated with bortezomib and dexamethasone (Table 2).
Table 2.
Impact of MAI and TRAF3 expression on PFS and OS in MM patients treated with bortezomib or dexamethasone.
| MAI and TRAF3 combination | N | Progression Free Survival | Overall Survival | ||||
|---|---|---|---|---|---|---|---|
| Bort, mths | Dex, mths | p-value | Bort, mths | Dex, mths | p-value | ||
| MAI>1, TRAF3<0.6 | 16 | 6.1 | 2.1 | 0.02 | Not reached | 12.1 | 0.10 |
| MAI>1, TRAF3≥0.6 | 49 | 6.3 | 4.7 | 0.35 | 19 | 9.6 | 0.12 |
| MAI≤1, TRAF3<0.6 | 18 | 7.2 | 4.6 | 0.21 | 25.5 | 26.2 | 0.95 |
| MAI≤1. TRAF3≥0.6 | 73 | 3.1 | 4.2 | 0.96 | 23.1 | 31.9 | 0.26 |
Discussion
MYC abnormalities have been classically described as a late event in myeloma pathogenesis typically characterized by complex rearrangement involving multiple partners 30. These types of abnormalities are particularly prevalent in human myeloma cell lines 31. In contrast, our study suggests that MYC activation is also likely to be an early event in myeloma pathogenesis. Indeed, MYC rearrangement has been reported to be present in about 15% of newly diagnosed myeloma 32. We see a similar percentage of patients in our dataset with very high expression of MYC (‘spike’ expression), at levels seen in Burkitt's lymphoma, suggesting the presence of IgH-MYC or IgL-MYC translocations. However, this mechanism could not account for most of the cases with MYC activation in our dataset.
RAS mutation is present in about 30% of newly diagnosed myeloma and rarely seen in MGUS suggesting that it is a possible transforming event 8, 9. In our analysis, the MYC activation signature is present in almost all cases of MM with RAS mutations, regardless of K- or N-RAS mutations, and in the validation datasets when activating mutations of RAS was expressed, suggesting an association between RAS mutations and MYC activation. Our observation is consistent with previous studies showing cooperation between RAS mutations and MYC activation in tumorigenesis and stabilization of the MYC protein by RAS mutants, prolonging the oncogenic activity of MYC 33, 34. This suggests that RAS mutation is another mechanism leading to MYC activation in MM.
As RAS mutation and ‘spiked’ expression of MYC occur in a mutually exclusive manner, these aberrations would account for the majority of patients with MYC activation. The remaining mechanisms leading to MYC activation is currently unknown, but may include loss of miRNA that regulate MYC translation 35-37, or cytokine-mediated via IL-6, an important survival factor for MM 38, 39.
Our result is also consistent with a recent transgenic mouse model of myeloma based on sporadic activation of MYC in mice that developed background asymptomatic gammopathy, akin to MGUS 15. It is also consistent with a recent analysis in a single case where rapid emergence of clonal cells with MYC rearrangements preceded progression from smoldering MM to MM 40. MYC activation as a cooperating event to cyclin D dysregulation 41, a universal primary molecular event observed in MGUS, is also mechanistically consistent with the recently described non-transcriptional activity of MYC on DNA replication forks during S-phase of the cell cycle 42. The cooperative deregulation of 2 different phases of the cell cycle, G1M and S phase, may result in transformation into myeloma.
Other pathways may be involved in transformation. In our analysis, we found that proteasome signature, tRNA core signature, cell cycle signature, metabolic signature and interferon signature were enriched in MM compared to MGUS. In particular, the interferon signature is enriched in samples where the MYC activation signature is not present and vice versa. On the other hand, the other pathways are enriched in a correlated fashion with MYC activation. These results are consistent with published data that MYC activation lead to increase metabolic activity, protein synthesis and cell proliferation 43-45 and suppression of interferon response 26. Furthermore, we showed that myeloma with MYC activation has lower expression of NFKB pathway signature. It has been shown that MYC activation suppresses NFKB pathways 26, 27and NFKB is not needed by MYC induced tumorigenesis 24, 25, consistent with the lack of expression of NFKB pathways genes in MYC-driven Burkitt's lymphoma 46. These correlations were further verified by the gene expression data derived from the P-493-6 cell model upon MYC induction. We also demonstrated a strong association between MYC activation and higher IRF4 activity in the patients, providing further verification of a recent study showing an auto-regulatory loop between IRF4 and MYC in MM 47. These observations strongly suggest that the predominant signatures seen in the gene expression analysis are due to functionally relevant MYC activation.
MYC activation was associated with protein synthesis (tRNA core signature) and hyperdiploid myeloma in our analysis. This is consistent with our previous observations from gene expression study that hyperdiploid myeloma over-express genes related to ribosome biogenesis and protein synthesis12. It is intriguing that while the dichotomy between hyperdiploid and non-hyperdiploid myeloma occur at the earliest stages of pathogenesis, the secondary events also appear to be subtype specific with MYC activation preferred by hyperdiploid MM whereas chromosome 13 deletion with potentially RB haploinsufficiency more common in tumors with t(4;14) and translocations involving MAF family genes.
Our analysis also showed that MYC activation detected either using the MYC activation signature or nuclear MYC immunoreactivity by IHC has prognostic importance. Although a previous study shows that MYC rearrangements as detected by FISH lack prognostic relevance32 but as mentioned, MYC activation in myeloma is likely mediated by different mechanisms other than genetic rearrangement. Of note, the prognostic relevance of MYC activation also applies to patients with nonproliferative tumors. Although it is not an independent prognostic factor on multivariate analysis (Supplementary Table 3), this nevertheless highlights the functional and clinical relevance of MYC activation in MM.
As MYC activation is seen in a substantial number of newly diagnosed MM and is of functional relevance, it may be potentially exploited for therapy. Indeed, we found that MM with MYC activation benefit from bortezomib treatment. Within the limitations of these being a subgroup analysis, these observations are interesting and should be confirmed in other bortezomib gene expression datasets as well as prospective studies. A previous report showed that induction of apoptosis in myeloma cells by bortezomib requires upregulation of NOXA via a MYC-dependent mechanism 28. In addition, in T-cell lymphoma, bortezomib can downregulate IRF4 and MYC 48. These are possible reasons for the greater efficacy for bortezomib seen in patients with MYC activation.
An important limitation is that even though we used CD138+ sorted cells from MGUS patients, a large amount of these will be the normal component compared to MM, resulting in potential bias. However, the corroboration of GEP results by IHC using a double staining method allowing for visualization of individual cells further supports our conclusion.
In summary, MYC activation may be a common transforming event in myeloma. This activation may be mediated by multiple mechanisms, and tumors with MYC activation have a more aggressive course associated with shorter survival. Targeting MYC either directly 49, or indirectly, through synthetic lethal targets, such as CDK150, may be useful therapeutic avenues in myeloma.
Supplementary Material
Acknowledgement
We express our gratitude to Ms Choo Shoa Nian from department of pathology, National University of Singapore, for performing immunohistochemistry. We also thank Prof Chi Van Dang, from John Hopkins, for his helpful suggestions and sharing the gene expression data for the P493-6 cell line model.
Funding Support
WJC is supported by NMRC Clinician Scientist Investigator award. This work is partly supported by Singapore Cancer Syndicate Grant (SCS-GRN102), and the Singapore National research Foundation and the Ministry of Education under the Research Center of Excellence Programme. RF is a Clinical Investigator of the Damon Runyon Cancer Research Fund. This work is supported by grants R01 CA83724-01, SPORE P50, CA100707-01and P01 CA62242 from the National Cancer Institute. Dr Fonseca is also supported by the grant CA015083 from the National Cancer Institute.
Footnotes
Authorship Contributions
Chng WJ – Design study, perform analysis and wrote paper
Huang GF – Perform gene expression analysis
Chung TH – Perform statistical analysis
Ng SB – Perform IHC analysis
Gonzalez-Paz N – Perform RAS mutation analysis
Price-Troska T – Perform RAS mutation analysis
Mulligan G – Provided Bortezomib GEP data and analysis
Chesi M – Design study and approve final manuscript
Bergsagel PL – Design study and approve final manuscript
Fonseca R – Designed study, provide TMAs and approve final manuscript
Supplementary Information accompanies the paper on the Leukemia website (http://www.nature.com/leu)
Conflict-of-interest disclosure: Chng WJ has received honorariums from Janssen Cilag. Mulligan G is an employee of Millenium Pharmaceuticals which makes Bortezomib.
References
- 1.Weiss BM, Abadie J, Verma P, Howard RS, Kuehl WM. A monoclonal gammopathy precedes multiple myeloma in most patients. Blood. 2009;113:5418–5422. doi: 10.1182/blood-2008-12-195008. [DOI] [PMC free article] [PubMed] [Google Scholar]
- 2.Landgren O, Kyle RA, Pfeiffer RM, Katzmann JA, Caporaso NE, Hayes RB, et al. Monoclonal gammopathy of undetermined significance (MGUS) consistently precedes multiple myeloma: a prospective study. Blood. 2009;113:5412–5417. doi: 10.1182/blood-2008-12-194241. [DOI] [PMC free article] [PubMed] [Google Scholar]
- 3.Chng WJ, Glebov O, Bergsagel PL, Kuehl WM. Genetic events in the pathogenesis of multiple myeloma. Best Pract Res Clin Haematol. 2007;20:571–596. doi: 10.1016/j.beha.2007.08.004. [DOI] [PMC free article] [PubMed] [Google Scholar]
- 4.Chng WJ, Van Wier SA, Ahmann GJ, Winkler JM, Jalal SM, Bergsagel PL, et al. A validated FISH trisomy index demonstrates the hyperdiploid and nonhyperdiploid dichotomy in MGUS. Blood. 2005;106:2156–2161. doi: 10.1182/blood-2005-02-0761. [DOI] [PMC free article] [PubMed] [Google Scholar]
- 5.Fonseca R, Bailey RJ, Ahmann GJ, Rajkumar SV, Hoyer JD, Lust JA, et al. Genomic abnormalities in monoclonal gammopathy of undetermined significance. Blood. 2002;100:1417–1424. [PubMed] [Google Scholar]
- 6.Kaufmann H, Ackermann J, Baldia C, Nosslinger T, Wieser R, Seidl S, et al. Both IGH translocations and chromosome 13q deletions are early events in monoclonal gammopathy of undetermined significance and do not evolve during transition to multiple myeloma. Leukemia. 2004;18:1879–1882. doi: 10.1038/sj.leu.2403518. [DOI] [PubMed] [Google Scholar]
- 7.Kyle RA, Therneau TM, Rajkumar SV, Offord JR, Larson DR, Plevak MF, et al. A long-term study of prognosis in monoclonal gammopathy of undetermined significance. N Engl J Med. 2002;346:564–569. doi: 10.1056/NEJMoa01133202. [DOI] [PubMed] [Google Scholar]
- 8.Chng WJ, Gonzalez-Paz N, Price-Troska T, Jacobus S, Rajkumar SV, Oken MM, et al. Clinical and biological significance of RAS mutations in multiple myeloma. Leukemia. 2008;22:2280–2284. doi: 10.1038/leu.2008.142. [DOI] [PMC free article] [PubMed] [Google Scholar]
- 9.Rasmussen T, Kuehl M, Lodahl M, Johnsen HE, Dahl IM. Possible roles for activating RAS mutations in the MGUS to MM transition and in the intramedullary to extramedullary transition in some plasma cell tumors. Blood. 2005;105:317–323. doi: 10.1182/blood-2004-03-0833. [DOI] [PubMed] [Google Scholar]
- 10.Zhan F, Hardin J, Kordsmeier B, Bumm K, Zheng M, Tian E, et al. Global gene expression profiling of multiple myeloma, monoclonal gammopathy of undetermined significance, and normal bone marrow plasma cells. Blood. 2002;99:1745–1757. doi: 10.1182/blood.v99.5.1745. [DOI] [PubMed] [Google Scholar]
- 11.Zhan F, Barlogie B, Arzoumanian V, Huang Y, Williams DR, Hollmig K, et al. Gene-expression signature of benign monoclonal gammopathy evident in multiple myeloma is linked to good prognosis. Blood. 2007;109:1692–1700. doi: 10.1182/blood-2006-07-037077. [DOI] [PMC free article] [PubMed] [Google Scholar]
- 12.Chng WJ, Kumar S, Vanwier S, Ahmann G, Price-Troska T, Henderson K, et al. Molecular dissection of hyperdiploid multiple myeloma by gene expression profiling. Cancer Res. 2007;67:2982–2989. doi: 10.1158/0008-5472.CAN-06-4046. [DOI] [PubMed] [Google Scholar]
- 13.Subramanian A, Tamayo P, Mootha VK, Mukherjee S, Ebert BL, Gillette MA, et al. Gene set enrichment analysis: a knowledge-based approach for interpreting genome-wide expression profiles. Proc Natl Acad Sci U S A. 2005;102:15545–15550. doi: 10.1073/pnas.0506580102. [DOI] [PMC free article] [PubMed] [Google Scholar]
- 14.Gurel B, Iwata T, Koh CM, Jenkins RB, Lan F, Van Dang C, et al. Nuclear MYC protein overexpression is an early alteration in human prostate carcinogenesis. Mod Pathol. 2008;21:1156–1167. doi: 10.1038/modpathol.2008.111. [DOI] [PMC free article] [PubMed] [Google Scholar]
- 15.Chesi M, Robbiani DF, Sebag M, Chng WJ, Affer M, Tiedemann R, et al. AID-Dependent Activation of a MYC Transgene Induces Multiple Myeloma in a Conditional Mouse Model of Post-Germinal Center Malignancies. Cancer Cell. 2008;13:167–180. doi: 10.1016/j.ccr.2008.01.007. [DOI] [PMC free article] [PubMed] [Google Scholar]
- 16.Huang E, Ishida S, Pittman J, Dressman H, Bild A, Kloos M, et al. Gene expression phenotypic models that predict the activity of oncogenic pathways. Nat Genet. 2003;34:226–230. doi: 10.1038/ng1167. [DOI] [PubMed] [Google Scholar]
- 17.Bild AH, Yao G, Chang JT, Wang Q, Potti A, Chasse D, et al. Oncogenic pathway signatures in human cancers as a guide to targeted therapies. Nature. 2006;439:353–357. doi: 10.1038/nature04296. [DOI] [PubMed] [Google Scholar]
- 18.Chng WJ, Schop RF, Price-Troska T, Ghobrial I, Kay N, Jelinek DF, et al. Gene-expression profiling of Waldenstrom macroglobulinemia reveals a phenotype more similar to chronic lymphocytic leukemia than multiple myeloma. Blood. 2006;108:2755–2763. doi: 10.1182/blood-2006-02-005488. [DOI] [PMC free article] [PubMed] [Google Scholar]
- 19.Yustein JT, Liu YC, Gao P, Jie C, Le A, Vuica-Ross M, et al. Induction of ectopic Myc target gene JAG2 augments hypoxic growth and tumorigenesis in a human B-cell model. Proc Natl Acad Sci U S A. 2010;107:3534–3539. doi: 10.1073/pnas.0901230107. [DOI] [PMC free article] [PubMed] [Google Scholar]
- 20.Pajic A, Spitkovsky D, Christoph B, Kempkes B, Schuhmacher M, Staege MS, et al. Cell cycle activation by c-myc in a burkitt lymphoma model cell line. Int J Cancer. 2000;87:787–793. doi: 10.1002/1097-0215(20000915)87:6<787::aid-ijc4>3.0.co;2-6. [DOI] [PubMed] [Google Scholar]
- 21.Schuhmacher M, Staege MS, Pajic A, Polack A, Weidle UH, Bornkamm GW, et al. Control of cell growth by c-Myc in the absence of cell division. Curr Biol. 1999;9:1255–1258. doi: 10.1016/s0960-9822(99)80507-7. [DOI] [PubMed] [Google Scholar]
- 22.Schlee M, Krug T, Gires O, Zeidler R, Hammerschmidt W, Mailhammer R, et al. Identification of Epstein-Barr virus (EBV) nuclear antigen 2 (EBNA2) target proteins by proteome analysis: activation of EBNA2 in conditionally immortalized B cells reflects early events after infection of primary B cells by EBV. J Virol. 2004;78:3941–3952. doi: 10.1128/JVI.78.8.3941-3952.2004. [DOI] [PMC free article] [PubMed] [Google Scholar]
- 23.Shaffer AL, Emre NC, Lamy L, Ngo VN, Wright G, Xiao W, et al. IRF4 addiction in multiple myeloma. Nature. 2008;454:226–231. doi: 10.1038/nature07064. [DOI] [PMC free article] [PubMed] [Google Scholar]
- 24.Klapproth K, Sander S, Marinkovic D, Baumann B, Wirth T. The IKK2/NF-{kappa}B pathway suppresses MYC-induced lymphomagenesis. Blood. 2009;114:2448–2458. doi: 10.1182/blood-2008-09-181008. [DOI] [PubMed] [Google Scholar]
- 25.Keller U, Nilsson JA, Maclean KH, Old JB, Cleveland JL. Nfkb 1 is dispensable for Myc-induced lymphomagenesis. Oncogene. 2005;24:6231–6240. doi: 10.1038/sj.onc.1208779. [DOI] [PubMed] [Google Scholar]
- 26.Schlee M, Holzel M, Bernard S, Mailhammer R, Schuhmacher M, Reschke J, et al. C-myc activation impairs the NF-kappaB and the interferon response: implications for the pathogenesis of Burkitt's lymphoma. Int J Cancer. 2007;120:1387–1395. doi: 10.1002/ijc.22372. [DOI] [PubMed] [Google Scholar]
- 27.You Z, Madrid LV, Saims D, Sedivy J, Wang CY. c-Myc sensitizes cells to tumor necrosis factor-mediated apoptosis by inhibiting nuclear factor kappa B transactivation. J Biol Chem. 2002;277:36671–36677. doi: 10.1074/jbc.M203213200. [DOI] [PubMed] [Google Scholar]
- 28.Nikiforov MA, Riblett M, Tang WH, Gratchouck V, Zhuang D, Fernandez Y, et al. Tumor cell-selective regulation of NOXA by c-MYC in response to proteasome inhibition. Proc Natl Acad Sci U S A. 2007;104:19488–19493. doi: 10.1073/pnas.0708380104. [DOI] [PMC free article] [PubMed] [Google Scholar]
- 29.Keats JJ, Fonseca R, Chesi M, Schop R, Baker A, Chng WJ, et al. Promiscuous mutations activate the noncanonical NF-kappaB pathway in multiple myeloma. Cancer Cell. 2007;12:131–144. doi: 10.1016/j.ccr.2007.07.003. [DOI] [PMC free article] [PubMed] [Google Scholar]
- 30.Kuehl WM, Bergsagel PL. Multiple myeloma: evolving genetic events and host interactions. Nat Rev Cancer. 2002;2:175–187. doi: 10.1038/nrc746. [DOI] [PubMed] [Google Scholar]
- 31.Dib A, Gabrea A, Glebov OK, Bergsagel PL, Kuehl WM. Characterization of MYC translocations in multiple myeloma cell lines. J Natl Cancer Inst Monogr. 2008;2008:25–31. doi: 10.1093/jncimonographs/lgn011. [DOI] [PMC free article] [PubMed] [Google Scholar]
- 32.Avet-Loiseau H, Attal M, Moreau P, Charbonnel C, Garban F, Hulin C, et al. Genetic abnormalities and survival in multiple myeloma: the experience of the Intergroupe Francophone du Myelome. Blood. 2007;109:3489–3495. doi: 10.1182/blood-2006-08-040410. [DOI] [PubMed] [Google Scholar]
- 33.Sears R, Nuckolls F, Haura E, Taya Y, Tamai K, Nevins JR. Multiple Ras-dependent phosphorylation pathways regulate Myc protein stability. Genes Dev. 2000;14:2501–2514. doi: 10.1101/gad.836800. [DOI] [PMC free article] [PubMed] [Google Scholar]
- 34.Sears R, Leone G, DeGregori J, Nevins JR. Ras enhances Myc protein stability. Mol Cell. 1999;3:169–179. doi: 10.1016/s1097-2765(00)80308-1. [DOI] [PubMed] [Google Scholar]
- 35.Gutierrez NC, Sarasquete ME, Misiewicz-Krzeminska I, Delgado M, De Las Rivas J, Ticona FV, et al. Deregulation of microRNA expression in the different genetic subtypes of multiple myeloma and correlation with gene expression profiling. Leukemia. 2010;24:627–637. doi: 10.1038/leu.2009.274. [DOI] [PubMed] [Google Scholar]
- 36.Lionetti M, Biasiolo M, Agnelli L, Todoerti K, Mosca L, Fabris S, et al. Identification of microRNA expression patterns and definition of a microRNA/mRNA regulatory network in distinct molecular groups of multiple myeloma. Blood. 2009;114:e20–26. doi: 10.1182/blood-2009-08-237495. [DOI] [PubMed] [Google Scholar]
- 37.Pichiorri F, Suh SS, Ladetto M, Kuehl M, Palumbo T, Drandi D, et al. MicroRNAs regulate critical genes associated with multiple myeloma pathogenesis. Proc Natl Acad Sci U S A. 2008;105:12885–12890. doi: 10.1073/pnas.0806202105. [DOI] [PMC free article] [PubMed] [Google Scholar]
- 38.Shi Y, Frost PJ, Hoang BQ, Benavides A, Sharma S, Gera JF, et al. IL-6-induced stimulation of c-myc translation in multiple myeloma cells is mediated by myc internal ribosome entry site function and the RNA-binding protein, hnRNP A1. Cancer Res. 2008;68:10215–10222. doi: 10.1158/0008-5472.CAN-08-1066. [DOI] [PMC free article] [PubMed] [Google Scholar]
- 39.Shi Y, Frost P, Hoang B, Benavides A, Gera J, Lichtenstein A. IL-6-induced enhancement of c-Myc Translation in multiple myeloma cells: critical role of cytoplasmic localization of the rna-binding protein hnRNP A1. J Biol Chem. 2011;286:67–78. doi: 10.1074/jbc.M110.153221. [DOI] [PMC free article] [PubMed] [Google Scholar]
- 40.Chiecchio L, Dagrada GP, Protheroe RK, Stockley DM, Smith AG, Orchard KH, et al. Loss of 1p and rearrangement of MYC are associated with progression of smouldering myeloma to myeloma: sequential analysis of a single case. Haematologica. 2009;94:1024–1028. doi: 10.3324/haematol.2008.004440. [DOI] [PMC free article] [PubMed] [Google Scholar]
- 41.Bergsagel PL, Kuehl WM, Zhan F, Sawyer J, Barlogie B, Shaughnessy J., Jr Cyclin D dysregulation: an early and unifying pathogenic event in multiple myeloma. Blood. 2005;106:296–303. doi: 10.1182/blood-2005-01-0034. [DOI] [PMC free article] [PubMed] [Google Scholar]
- 42.Dominguez-Sola D, Ying CY, Grandori C, Ruggiero L, Chen B, Li M, et al. Non-transcriptional control of DNA replication by c-Myc. Nature. 2007;448:445–451. doi: 10.1038/nature05953. [DOI] [PubMed] [Google Scholar]
- 43.Dang CV. c-Myc target genes involved in cell growth, apoptosis, and metabolism. Mol Cell Biol. 1999;19:1–11. doi: 10.1128/mcb.19.1.1. [DOI] [PMC free article] [PubMed] [Google Scholar]
- 44.Schmidt EV. The role of c-myc in regulation of translation initiation. Oncogene. 2004;23:3217–3221. doi: 10.1038/sj.onc.1207548. [DOI] [PubMed] [Google Scholar]
- 45.Iritani BM, Eisenman RN. c-Myc enhances protein synthesis and cell size during B lymphocyte development. Proc Natl Acad Sci U S A. 1999;96:13180–13185. doi: 10.1073/pnas.96.23.13180. [DOI] [PMC free article] [PubMed] [Google Scholar]
- 46.Dave SS, Fu K, Wright GW, Lam LT, Kluin P, Boerma EJ, et al. Molecular diagnosis of Burkitt's lymphoma. N Engl J Med. 2006;354:2431–2442. doi: 10.1056/NEJMoa055759. [DOI] [PubMed] [Google Scholar]
- 47.Duque RE, Andreeff M, Braylan RC, Diamond LW, Peiper SC. Consensus review of the clinical utility of DNA flow cytometry in neoplastic hematopathology. Cytometry. 1993;14:492–496. doi: 10.1002/cyto.990140507. [DOI] [PubMed] [Google Scholar]
- 48.Zhao WL, Liu YY, Zhang QL, Wang L, Leboeuf C, Zhang YW, et al. PRDM1 is involved in chemoresistance of T-cell lymphoma and down-regulated by the proteasome inhibitor. Blood. 2008;111:3867–3871. doi: 10.1182/blood-2007-08-108654. [DOI] [PubMed] [Google Scholar]
- 49.Soucek L, Whitfield J, Martins CP, Finch AJ, Murphy DJ, Sodir NM, et al. Modelling Myc inhibition as a cancer therapy. Nature. 2008;455:679–683. doi: 10.1038/nature07260. [DOI] [PMC free article] [PubMed] [Google Scholar]
- 50.Goga A, Yang D, Tward AD, Morgan DO, Bishop JM. Inhibition of CDK1 as a potential therapy for tumors over-expressing MYC. Nat Med. 2007;13:820–827. doi: 10.1038/nm1606. [DOI] [PubMed] [Google Scholar]
- 51.Compagno M, Lim WK, Grunn A, Nandula SV, Brahmachary M, Shen Q, et al. Mutations of multiple genes cause deregulation of NF-kappaB in diffuse large B-cell lymphoma. Nature. 2009;459:717–721. doi: 10.1038/nature07968. [DOI] [PMC free article] [PubMed] [Google Scholar]
Associated Data
This section collects any data citations, data availability statements, or supplementary materials included in this article.