

Abstract
Nicotinic acetylcholine receptors (nAChRs) containing α6 subunits are expressed in only a few brain areas, including midbrain dopamine (DA) neurons, noradrenergic neurons of the locus ceruleus, and retinal ganglion cells. To better understand the regional and subcellular expression pattern of α6-containing nAChRs, we created and studied transgenic mice expressing a variant α6 subunit with green fluorescent protein (GFP) fused in-frame in the M3-M4 intracellular loop. In α6-GFP transgenic mice, α6-dependent synaptosomal DA release and radioligand binding experiments confirmed correct expression and function in vivo. In addition to strong α6* nAChR expression in glutamatergic retinal axons, which terminate in superficial superior colliculus (sSC), we also found α6 subunit expression in a subset of GABAergic cell bodies in this brain area. In patch-clamp recordings from sSC neurons in brain slices from mice expressing hypersensitive α6* nAChRs, we confirmed functional, postsynaptic α6* nAChR expression. Further, sSC GABAergic neurons expressing α6* nAChRs exhibit a tonic conductance mediated by standing activation of hypersensitive α6* nAChRs by ACh. α6* nAChRs also appear in a subpopulation of SC neurons in output layers. Finally, selective activation of α6* nAChRs in vivo induced sSC neuronal activation as measured with c-Fos expression. Together, these results demonstrate that α6* nAChRs are uniquely situated to mediate cholinergic modulation of glutamate and GABA release in SC. The SC has emerged as a potential key brain area responsible for transmitting short-latency salience signals to thalamus and midbrain DA neurons, and these results suggest that α6* nAChRs may be important for nicotinic cholinergic sensitization of this pathway.
Introduction
Nicotinic acetylcholine receptors containing α6 subunits (α6* nAChRs) exhibit a unique expression pattern in the mammalian brain. Using radiolabeled α-conotoxin-MII, a cone snail toxin selective for α3/α6β2* nAChRs, α6* nAChRs have been localized chiefly to ventral tegmental area (VTA) and substantial nigra pars compacta (SNc) dopamine (DA) neurons, norepinephrine (NE)-producing locus ceruleus (LC) neurons, and optic nerve axons and their terminal areas (Whiteaker et al., 2000b; Champtiaux et al., 2002; Gotti et al., 2005; Cox et al., 2008). Native α6* nAChRs exhibit a variety of alternative stoichiometries. In DA neurons, α6 subunits require β2 subunits (Salminen et al., 2004), but assemble with and without α4 and β3 (Salminen et al., 2007; Drenan et al., 2010). LC NE neurons likely produce both α6β4* and α6β2* nAChRs (Léna et al., 1999; Azam and McIntosh, 2006; Azam et al., 2010). Retinal axons contain a variety of α6* nAChRs, including α4α6β2β3*, α3α4α6β2*, α3α6β2, and α6β2β3* (Cox et al., 2008).
Studies of α6* nAChR function in vivo have led to several important findings. α6 knock-out (KO) mice have decreased nicotine-stimulated DA release (Champtiaux et al., 2003) and acute intravenous (IV) nicotine self-administration (Pons et al., 2008). IV self-administration is restored by selective re-expression of α6 in VTA (Pons et al., 2008). Chronic intracranial nicotine self-administration is largely normal in α6 KO mice, but activity-dependent DA release in striatum is perturbed in these animals (Exley et al., 2011). In rats, VTA α6* nAChRs mediate the psychomotor stimulant effect of systemic nicotine (Gotti et al., 2010). Mice that express hypersensitive α6* L9′S nAChRs exhibit spontaneous locomotor hyperactivity and nicotine-stimulated locomotor activation at doses specific for α6* nAChRs (Drenan et al., 2008a). These phenotypes likely arise from enhanced activity of ventral midbrain DA neurons in response to α6* nAChR activation (Drenan et al., 2008a), and/or altered activity-dependent DA release in striatum (Drenan et al., 2010).
DA neurons switch among tonic firing (1–5 Hz), phasic firing (20–100 Hz), and brief cessation of firing depending on the value of received versus expected outcomes. Recently, it has been appreciated that the superior colliculus (SC) sends excitatory projections to midbrain DA neurons, influencing their firing activity and DA release in striatum (Comoli et al., 2003; Dommett et al., 2005; May et al., 2009). αCtxMII-sensitive (α3* or α6*) nAChRs are expressed at extremely high density in superficial layers of SC (Whiteaker et al., 2000b; Champtiaux et al., 2002; Cox et al., 2008). αCtxMII-sensitive nAChRs were also detected postsynaptically in SC (Endo et al., 2005), but the subunit composition of these receptors was not determined. To gain a better understanding of α6* nAChR expression, we generated and studied a bacterial artificial chromosome (BAC) transgenic mouse expressing a variant α6 subunit with enhanced GFP fused in-frame in the M3/M4 intracellular loop. Also, we recorded from SC neurons in mice expressing a hypersensitive variant of the mouse α6 subunit (α6 L9′S). In these studies, we demonstrate high levels of expression of α6* nAChRs in the DA system, and we reveal new details regarding α6* nAChR expression and function in mouse visual system.
Materials and Methods
Materials.
[3H]-dopamine was obtained from PerkinElmer (7,8-[3H] at 30–50 Ci/mmol). HEPES, free acid, and sodium salt were products of Amresco. Ultra centrifugation grade sucrose was obtained from Fisher Chemicals. Sigma-Aldrich was the source for the following compounds: l(+)-arabinose, ascorbic acid, atropine sulfate, bovine serum albumin (BSA), (−)-nicotine tartrate, nomifensine, streptomycin, ampicillin, chloramphenicol, kanamycin, tetracycline, and pargyline. Optiphase “SuperMix” scintillation fluid was from PerkinElmer Life Sciences. α-Conotoxin MII was synthesized by previously described methods (Azam et al., 2010).
BAC recombineering and transgenesis.
α6 L9′S mice were described previously (Drenan et al., 2008a), and served as a model for creation of α6-GFP mice. BAC RP24–149I12 containing the mouse α6 nicotinic receptor subunit gene (Chrna6) was obtained from the BACPAC Resource Center at Children's Hospital Oakland Research Institute (Oakland, CA). BAC recombineering was performed using a Counter Selection BAC modification kit (Genebridges). Recombineering in bacteria uses endogenous recombination activity, and allows the insertion of exogenous DNA into the BAC without residual sequences such as selection markers (neo) or loxP sites. α6 wild-type (WT) was mutated to α6-GFP using a two-step selection/counter selection protocol, similar to a previous study (Drenan et al., 2008a). First, a cassette containing a tandem selection (neo)/counter selection (rpsL) marker was introduced after the alanine at position 405, a previously tested insertion site for GFP (Drenan et al., 2008b). The rpsL/neo cassette was amplified by PCR using oligos designed to engineer α6 exon 5 homology arms flanking the sequence through A405 and after A405. The oligo sequences were as follows: forward primer: 5′-cc aaa ctt cta aag gaa tgc cac cac tgc caa aaa tca agt gac ata gca gtcgac GGC CTG GTG ATG ATG GCG GGA TCG-3′ and reverse primer: 5′- tt ctc tgc cac cca ccg tgc agg ctg ctg gct tga tct tct ctt tcc agg gtcgac TCA GAA GAA CTC GTC AAG AAG GCG-3′ (homology arms: lower case; SalI restriction site: underlined, lower case; rpsL/neo cassette priming sequence: upper case).
Neo was used to select positive recombinants, and an engineered SalI restriction site pair flanking the selection cassette was used to confirm the location of the exogenously inserted DNA within the BAC. In the second step, GFP was inserted and screened using counter selection. Bacterial cells were placed under selective pressure (via streptomycin sensitivity gained by insertion of the rpsL marker) to lose the neo-rpsL cassette and replace it with a nonselectable GFP cassette. The GFP cassette was amplified by PCR using oligos containing the same α6 exon 5 homology arms as the rpsL/neo cassette. Instead of a SalI restriction site, the GFP was flanked with a small, three amino acid linker, A-G-A, that also contains a KasI restriction site. The GFP cassette was amplified using the oligo sequences: 5′-cc aaa ctt cta aag gaa tgc cac cac tgc caa aaa tca agt gac ata gca gct ggc gcc ATG GTG AGC AAG GGC GAG GAG-3′ and 5′- tt ctc tgc cac cca ccg tgc agg ctg ctg gct tga tct tct ctt tcc agg ggc gcc tgc CTT GTA CAG CTC GTC CAT (homology arms: lower case; A-G-A linker: underlined, lower case; GFP cassette priming sequence: upper case). The resultant strain harbored a BAC with no ectopic DNA in or around the α6 gene. α6-GFP BAC DNA was confirmed to have the desired mutation by DNA sequencing, restriction mapping, and diagnostic PCR. The α6 nicotinic receptor gene is directly adjacent to the β3 nicotinic receptor gene (Chrnb3). To eliminate the possibility that any physiological or behavioral phenotypes of our transgenic mice could be attributed to the presence of extra copies of β3, but to retain the β3 locus, we silenced the β3 gene using homologous recombination. β3 was silenced by replacing exon 1 (containing the methionine initiation codon) with an ampicillin selection cassette. An ampicillin marker derived from pCDNA3.1zeo was amplified by PCR using oligos designed to engineer β3 homology arms and diagnostic SbfI restriction sites flanking the ampicillin marker. The oligo sequences were as follows: forward primer: 5′-agc ctc aca aga cct gac agc tca ctg ggc atc agt gaa gtg cac cctgcagg GAC GTC AGG TGG CAC-3′ and reverse primer: 5′-tga gag agt ggc act gag agc caa gaa gac ccg tag gaa gcc tgt cctgcagg GTC TGA CGC TCA GTG-3′ (homology arms: lower case; SbfI restriction site: underlined, lower case; ampicillin marker priming sequence: upper case). Two additional genes (4921537P18Rik and Tex24), which are not expressed in brain, are also contained on the final BAC construct.
Injection-grade α6-GFP BAC DNA was prepared via double CsCl banding (Lofstrand Labs). To produce transgenic animals, BAC DNA was injected into the pronucleus of fertilized B6D2F1 ova and implanted into pseudopregnant Swiss-Webster surrogates. Several transgenic founders were identified using tail biopsy DNA and PCR primers designed to detect both the GFP mutation (forward: 5′-ctc cgt tct gtc aag ctt g-3′, reverse: 5′-acg agt gct ctg aat tct ctg-3′), and the inserted ampicillin cassette within the β3 gene (forward: 5′-gct cat gag aca ata acc ctg-3′, reverse: 5′-cag tct tgg aag caa cat cca gc-3′). One transgenic line, “line 4,” is reported in detail in this study. Founders were crossed to C57BL/6J (The Jackson Laboratory) to obtain germline transmission and to establish a colony, and transgenic mice were continually backcrossed to C57BL/6J. Routine genotyping was done by multiplex PCR (forward primer #1: 5′-tga tga tga gga aac ctc tgg-3′; forward primer #2: 5′-ctg ctg ctc atc acc gag atc-3′; reverse primer #1: 5′-gtc gtg ctg ctt cat gtg gtc g-3′; and reverse primer #2: 5′-cag atg tca ccc aag atg ccg-3′) analysis of tail DNA from newly weaned mice. α6-GFP BAC copy number was calculated using the comparative CT method following real-time PCR (Livak and Schmittgen, 2001; Ballester et al., 2004; Lee et al., 2006; Schmittgen and Livak, 2008), as previously described (Cohen et al., 2012). α6-GFP transgenic mice contained six copies of the α6-GFP BAC.
Mice.
All experiments were conducted in accordance with the guidelines for care and use of animals provided by the National Institutes of Health (NIH), and protocols were approved by the Institutional Animal Care and Use Committee at Purdue University, the California Institute of Technology, or the University of Colorado. Mice were kept on a standard 12 h light/dark cycle at 22°C and given food and water ad libitum. On P21, mice were weaned and housed with same-sex littermates. At 21 to 28 d, tail biopsies were taken for genotype analysis by PCR. Tails were digested in 50 mm NaOH at 95°C for 45 min followed by neutralization with 0.5 M Tris-Cl, pH 5.5, and subsequent direct analysis by multiplex PCR.
Neurotransmitter release from synaptosomes.
Previously described methods were followed for measuring DA release (Salminen et al., 2007). Briefly, appropriate brain regions were homogenized in 0.5 ml of ice-cold 0.32 m sucrose buffered with 5 mm HEPES, pH 7.5. A crude synaptosomal pellet was prepared by centrifugation at 12,000 × g for 20 min. The pellets were resuspended in “uptake buffer” containing the following (in mm): 128 NaCl, 2.4 KCl, 3.2 CaCl2, 1.2 KH2PO4, 1.2 MgSO4, 25 HEPES, pH 7.5, and 10 glucose, supplemented with 1 ascorbic acid and 0.01 pargyline. After incubation at 37°C for 10 min, [3H]-DA (0.1 μm) was added and incubation continued for 5 min.
All superfusion experiments were conducted at room temperature (RT) using methods described previously (Salminen et al., 2007; McClure-Begley et al., 2009). In brief, aliquots of synaptosomes were distributed onto filters and superfused with buffer (uptake buffer containing 0.1% BSA and 1 μm atropine with 1 μm nomifensine) at 0.7 ml/min for 10 min, or buffer for 5 min followed by buffer with 50 nm αCtxMII. Aliquots of synaptosomes were then exposed to nicotine or high potassium (20 mm) in buffer for 20 s to stimulate release of [3H]-DA, followed by buffer. Fractions (∼0.1 ml) were collected for 4 min into 96-well plates at 10 s intervals, starting from 1 min before stimulation, using a Gilson FC204 fraction collector with a multicolumn adapter. Radioactivity was determined by scintillation counting using a 1450 MicroBeta Trilux scintillation counter (PerkinElmer Life Sciences) after addition of 0.15 ml Optiphase “SuperMix” scintillation mixture. Instrument efficiency was 40%.
Perfusion data were plotted as counts per minute versus fraction number. Fractions collected before and after the peak were used to calculate baseline as a single exponential decay. The calculated baseline was subtracted from the experimental data. Fractions that exceeded baseline by 10% or more were summed to give total released counts per minute (cpm) and then normalized to baseline to give units of release [(cpm-baseline)/baseline] (Drenan et al., 2008a, 2010). Agonist dose–response data were fit to the Hill equation.
Patch-clamp electrophysiology.
For slice electrophysiology, transgenic and nontransgenic mice were identified by genotyping new litters at 14–18 d after birth. P17–P25 mice were anesthetized with sodium pentobarbital (100 mg/kg; i.p.) followed by cardiac perfusion with oxygenated (95% O2/5% CO2) ice-cold glycerol-based artificial CSF (gACSF) containing the following in (mm): 252 glycerol, 1.6 KCl, 1.2 NaH2PO4, 1.2 MgCl2, 2.4 CaCl2, 18 NaHCO3, and 11 glucose. Following perfusion, brains were removed and retained in gACSF (0–4°C). Coronal slices (250 μm) were cut with a microslicer (DTK-Zero 1; Ted Pella) at a frequency setting of 9 and a speed setting of 3.25. Brain slices were allowed to recover for at least 1 h at 32°C in regular, oxygenated ACSF containing the following (in mm): 126 NaCl, 1.6 KCl, 1.2 NaH2PO4, 1.2 MgCl2, 2.4 CaCl2, 18 NaHCO3, and 11 glucose.
For recordings, a single slice was transferred to a 0.8 ml recording chamber (RC-27L bath with PH-6D heated platform; Warner Instruments). Slices were continually superfused with ACSF (1.5–2.0 ml/min) throughout the experiment. Cells were visualized with an upright microscope (FN-1; Nikon) using infrared or visible differential interference contrast optics. Patch electrodes were constructed from Kwik-Fil borosilicate glass capillary tubes (1B150F-4; World Precision Instruments) using a programmable microelectrode puller (P-97; Sutter Instrument). The electrodes had tip resistances of 4.5–8.0 MΩ when filled with internal pipette solution (pH adjusted to 7.25 with Tris base, osmolarity adjusted to 290 mOsm with sucrose) containing the following (in mm): 135 K+ gluconate, 5 EGTA, 0.5 CaCl2, 2 MgCl2, 10 HEPES, 2 Mg-ATP, and 0.1 GTP. Whole-cell recordings were taken at 32°C with an Axopatch 200B amplifier, a 16-bit Digidata 1440A A/D converter, and pCLAMP 10 software (all Molecular Devices Axon). Data were sampled at 5 kHz and lowpass filtered at 1 kHz. The junction potential between the patch pipette and the bath solution was nulled immediately before gigaseal formation. Series resistance was uncompensated.
To examine the function of somatic nAChRs, nicotine was locally applied using a Picospritzer III (General Valve). Using a high-resolution micromanipulator (Sutter Instruments), the pipette tip was moved within 20–40 μm of the recorded cell 1–2 s before drug application. Nicotine-containing recording solution was then puffed at 10–20 psi for 250 ms. Immediately after the application, the glass pipette was retracted.
Rb+ efflux from SC synaptosomes.
Nicotine-stimulated Rb+ efflux from SC was measured as described previously (Nashmi et al., 2007). Briefly, SC was dissected from adult mice and crude synaptosomes prepared as described above for neurotransmitter release. Each pellet was resuspended in load buffer (140 mm NaCl, 1.5 mm KCl, 2 mm CaCl2, 1 mm MgSO4, 25 mm HEPES, and 22 mm glucose) and aliquots incubated with 4 μCi of 86Rb+ for 30 min in a final volume of 35 μl of load buffer. Filters containing the synaptosomes loaded with 86Rb+ were superfused for 5 min with buffer (135 mm NaCl, 1.5 mm KCl, 5 mm CsCl, 2 mm CaCl2, 1 mm MgSO4, 25 mm HEPES, 22 mm glucose, 50 nm tetrodotoxin (TTX), and 0.1% BSA) and the effluent was pumped through a 200 μl Cherenkov cell and into a β-Ram detector (IN/US Systems). Radioactivity was measured for 3 min with a 3 s detection window providing 60 data points for each superfusion. Each aliquot was stimulated by one of four different nicotine concentrations, with a 5 s exposure for each concentration.
Epibatidine binding to membranes.
Membranes were prepared by previously described procedures (Whiteaker et al., 2000a) from SC, thalamus, striatum (caudate putamen and dorsal nucleus accumbens), olfactory tubercle (OT), cortex, and ventral midbrain, by homogenization in ice-cold hypotonic buffer (14 mm NaCl, 0.2 mm KCl, 0.2 mm CaCl2, 0.1 mm MgSO4, and 2 mm HEPES, pH 7.5) using a glass-Teflon tissue grinder. Particulate fractions were obtained by centrifugation at 20,000 g (15 min, 4°C) and washed by resuspension and centrifugation three times, then stored (in pellet form under homogenization buffer) at −70°C until use. Protein was quantified with a Lowry assay using BSA as the standard.
Binding of [125I]-epibatidine was quantified using methods previously described (Whiteaker et al., 2000a). Incubations were performed in 96-well polystyrene plates, in 30 μl of binding buffer (144 mm NaCl, 1.5 mm KCl, 2 mm CaCl2, 1 mm MgSO4, and 20 mm HEPES, pH 7.5) with 200 pm [125I]-epibatidine. Binding reactions were terminated by filtration of samples onto a single thickness of polyethyleneimine-soaked (0.5% w/v in binding buffer) GFA/E glass fiber filters (Gelman Sciences) using an Inotech Cell Harvester. Samples were subsequently washed six times with ice-cold binding buffer. Bound ligand was quantified by gamma counting at 83–85% efficiency, using a Packard Cobra counter. In experiments with competitive unlabeled αCtxMII (50 nm), the medium was supplemented with BSA (0.1% w/v) as a carrier protein. For cytisine inhibition, concentrations of 0, 50, or 150 nm were added to separate wells and cytisine-sensitive and -resistant binding of [125I]-epibatidine calculated using the equation B = [BH/(1+([cyt]/IC50H)]+[BL/(1+([cyt]/IC50L)] where B = measured binding, BH is binding with high affinity for cytisine, and BL is binding with low affinity for cytisine with respective IC50 values for inhibition of 200 pm epibatidine experimentally determined (IC50H = 3.5 nm; IC50L = 290 nm). For all experiments, nonspecific binding was determined in the presence of 1 mm (−)-nicotine tartrate.
Immunohistochemistry, c-Fos induction, and confocal imaging.
Methods for immunohistochemistry and confocal microscopy are similar to previous studies (Drenan et al., 2008a). For c-Fos experiments, mice were habituated to injections with saline injections for 3–4 d before the experimental injection. On the experimental day, mice were injected with nicotine (0.15 mg/kg; i.p.), and were perfused for immunohistochemistry 90 min later, as described below.
Mice were deeply anesthetized with sodium pentobarbital (100 mg/kg; i.p.) and perfused transcardially with 15 ml of ice-cold PBS followed by 25 ml of ice-cold 4% paraformaldehyde (PFA) in PBS. Brains were removed and postfixed for 2 h at 4°C with the same fixative and cryoprotected in PBS containing 30% sucrose until the brain sank. Coronal or sagittal sections (50 μm) were cut on a microslicer and collected into a 12-well tissue culture plate containing PBS. Following extraction from eye cups, several relief cuts were made on retinal tissue sheets used for whole-mount analysis, and flattened retinal sections were treated similarly to brain sections, as follows. Sections were permeabilized (20 mm HEPES, pH 7.4, 0.5% Triton X-100, 50 mm NaCl, 3 mm MgCl2, 300 mm sucrose) for 1 h at 4°C followed by blocking (0.1% Triton X-100, 5% donkey serum in TBS) for 1 h at RT. Slices were incubated overnight at 4°C in solutions containing primary antibodies (diluted in 0.1% Triton X-100, 5% donkey serum in TBS). Primary antibodies and final dilutions were as follows: 1:500 rabbit anti-GFP (A11122; Invitrogen), 1:500 sheep anti-tyrosine hydroxylase (TH; AB1542, Millipore), 1:500 mouse anti-GAD67 (MAB5406; Millipore), 1:500 mouse anti-NeuN (clone A60, MAB377; Millipore), 1:500 guinea pig anti-VGLUT1 (AB5905; Millipore), and 1:400 rabbit anti-c-Fos (sc-52; Santa Cruz Biotechnology). Sections were washed three times for 10 min each in TBST (0.1% Triton X-100 in TBS) and incubated for 1 h at RT with secondary antibodies (diluted in 0.1% Triton X-100, 5% donkey serum in TBS). Secondary antibodies and final dilutions were as follows: 1:1000 goat anti-rabbit Alexa 488 (A11008; Invitrogen), 1:1000 donkey anti-sheep Alexa 555 (A21436; Invitrogen), 1:1000 donkey anti-mouse Alexa 555 (A31570; Invitrogen), and 1:1000 goat anti-guinea pig Alexa 555 (A21435; Invitrogen). Sections were then washed four times in TBST for 10 min each. Sections that were costained with the nuclear dye, Qnuclear, were incubated after the third TBST wash in 1:1000 Qnuclear Deep Red Stain (Q10363; Invitrogen) in PBS for 20 min at RT followed by three 5 min washes in PBS. All sections were mounted on slides and coverslipped with Vectashield (Vector Laboratories), then imaged with a Nikon (Nikon Instruments) C1 or A1 laser-scanning confocal microscope system equipped with spectral imaging capabilities and a Prior (Rockland) remote-focus device. A Nikon Plan Apo 10× or 60× oil objective was used, and pinhole diameter was 30 μm. Sections were imaged at 12-bit intensity resolution over 512 × 512 pixels at a pixel dwell time of 2–4 μs. Alexa 488 was excited with an argon laser at 488 nm, and Alexa 555 was excited with a yellow solid-state laser at 561 nm. Qnuclear was excited with a diode laser at 636 nm. Imaging was performed using the Nikon DEES grating and spectral detector with 32 parallel photomultiplier tubes. Signal from dyes was unmixed from background autofluorescence similar to our previous studies (Briggs et al., 2006; Drenan et al., 2008a,b).
Immunohistochemistry on retinal cross sections was performed as follows. Eyes were removed and fixed in 4% PFA in PBS, followed by paraffin embedding and sectioning at 7 μm with a microtome. Epitopes were retrieved with 1 mm Na+ citrate buffer (pH 6.0), followed by H2O2 treatment. Sections were blocked, incubated with anti-GFP antibodies (1:200 dilution) for 60 min at RT, washed, and incubated with anti-rabbit horseradish peroxidase secondary antibodies (K4003, EnVision+ System; Dako) for 45 min at RT. Sections were reacted with diaminobenzidine reagent for 5 min at RT, rinsed, stained with hematoxylin for 3 min, rinsed, dehydrated with a graded alcohol series, cleared with xylene, and coverslipped.
Statistics and data analysis.
Physiology, neurochemistry, and real-time PCR data are reported as mean ± SEM. Statistical significance (p < 0.05) was determined with a Student's t test for continuous data meeting parametric assumptions for normality and equal variance. Neurochemistry data were analyzed for significance by one-way ANOVA with Tukey's post hoc analysis.
Results
Production and characterization of BAC α6-GFP transgenic mice
To faithfully express GFP-labeled α6* nAChRs, we selected a BAC clone (RP24–149I12) containing the Chrna6 (α6 nAChR) locus. This BAC was used previously to successfully express hypersensitive α6 L9′S nAChRs in their native brain regions. Using a two-step selection/counter selection recombineering protocol, a coding sequence for GFP was inserted in exon 5 of the Chrna6 gene within the coding sequence for the M3-M4 intracellular loop following Ala 405 (Fig. 1A). α6-GFP receptors with this mutation assemble appropriately with α4, β2, and β3 nAChR subunits, are trafficked to the cell periphery, and their function in electrophysiological assays is comparable to α4β2 nAChRs (Drenan et al., 2008b; Xiao et al., 2011).
Figure 1.

Production of α6-GFP BAC transgenic mice and α6* nAChR expression in visual system. A, Construction of α6-GFP BAC transgene. A BAC containing the full Chrna6 gene was modified by recombineering to allow expression of a variant α6 nAChR subunit with GFP fused in-frame within the M3–M4 intracellular loop. B, C, α6* nAChR expression in retina. Whole-mount retinal sections were prepared from α6-GFP transgenic mice and stained with anti-GFP antibodies. GFP(+) cells in the GCL were imaged with confocal microscopy at 10× (B1), 60× (B2), and 480× (B3). Retinal cross sections were prepared from α6-GFP transgenic mice (C), followed by anti-GFP staining (brown color) and hematoxylin counterstaining to label nuclei. α6 immunoreactivity was confined to the GCL. D, E, α6* nAChR expression in visual thalamus and SC. Brains from α6-GFP transgenic mice were fixed, sectioned at 50 μm (coronal), and stained with anti-GFP antibodies. dLGN (D) and SC (E) stained positive for α6* nAChR expression. PL, photoreceptor layer; ONL, outer nuclear layer; OPL, outer plexiform layer; INL, inner nuclear layer; IPL, inner plexiform layer.
Using anti-GFP immunostaining, we characterized α6-GFP expression in the CNS of α6-GFP BAC transgenic mice. Using [125I]-αCtxMII, which does not distinguish between α3* versus α6* nAChRs, investigators have concluded that α3* and/or α6* nAChRs are expressed strongly in visual pathways such as retina, optic nerve, visual thalamus (dorsal lateral geniculate nucleus, dLGN), and SC. We noted strong expression of α6-GFP nAChRs in retinal tissue using whole-mount preparations (Fig. 1B1). Strong expression was noted in the retinal ganglion cell (RGC) layer in this preparation (Fig. 1B2). In presumptive RGCs, α6-GFP nAChRs were expressed throughout the cell periphery, and were not concentrated on the cell surface (Fig. 1B3). To confirm that α6* nAChRs are expressed in RGCs, we prepared retinal cross sections and stained the tissue with anti-GFP antibodies. α6-GFP nAChRs were localized exclusively in the ganglion cell layer (GCL) in these sections (Fig. 1C), where we noted α6-GFP expression in 52 ± 2% of cells in this layer (data not shown). Additionally, α6-GFP nAChRs were strongly expressed in dLGN in thalamus (Fig. 1D) and in SC (Fig. 1E). α6-GFP nAChRs were also localized to optic tract axons, and to the medial terminal nucleus of the accessory optic tract (data not shown). These results are consistent with previous reports using [125I]-αCtxMII autoradiography, and with studies in α6 KO mice (Whiteaker et al., 2000b; Champtiaux et al., 2002).
Others have previously demonstrated robust expression of α6 nAChR mRNA in DA neurons in SNc and VTA, and in NE neurons in LC (Le Novère et al., 1996; Léna et al., 1999; Azam et al., 2002). At the protein level in α6-GFP mice, we found robust expression of α6-GFP nAChRs in these areas. Using dual anti-GFP and anti-TH immunostaining, we show that α6* nAChRs are specifically expressed in TH-expressing DA (Fig. 2A) or NE (Fig. 2B) neurons in these brain regions. In VTA, α6 subunits were expressed in 88 ± 2% of TH(+) neurons, and in SNc, α6 subunits were expressed in 98 ± 1% of TH(+) neurons (n = 2 mice; data not shown). These results are highly consistent with previous similar studies using α6 mRNA in situ hybridization (Azam et al., 2002). We did not find expression of α6* nAChRs in TH(−) neurons in these areas. In parasagittal sections, we report modest expression of α6* nAChRs in TH(+) fibers, presumably DA axons projecting to striatum and other forebrain targets (Fig. 2C). Staining experiments in nontransgenic control mice (Fig. 2D) demonstrated that punctate α6-GFP expression (Fig. 2C) was not a staining artifact. Axonal α6 staining was more punctate relative to TH staining (Fig. 2C), suggesting that α6* nAChRs were contained within vesicles in axons. Immunoelectron microscopy will be required to determine whether α6* nAChRs are expressed on the surface of DA axons, or only within these axons during their transport to DA terminals. Finally, in α6-GFP mice, we found modest α6* nAChR expression throughout striatum (Fig. 2E). Similar to DA axons, α6* nAChR expression in striatum was punctate, representing a subset of TH(+) axons/fibers (Fig. 2E). We found little to no α6* expression in TH(−) structures in striatum, and staining experiments in striatal sections from nontransgenic control mice (Fig. 2F) ruled out possible staining artifacts as an explanation for our results.
Figure 2.

α6* nAChR expression in catecholamine-producing neurons. A, α6* nAChR expression in ventral midbrain DA neurons. Coronal sections (bregma −3.5 mm) were prepared from α6-GFP transgenic mice, followed by dual staining with anti-GFP and anti- TH antibodies to label DA neurons. Sections were imaged with laser-scanning confocal microscopy, and fluorescence from both channels (green, anti-GFP; red, anti-TH) were merged to indicate coexpression of α6* nAChRs within TH(+) neurons. B, α6* nAChR expression in LC NE neurons. Coronal sections (bregma −5.52 mm) from α6-GFP transgenic mice containing LC were prepared and double stained as described in A. C, D, α6* nAChR expression in DA axons. Sagittal sections (lateral 0.96 mm) containing medial forebrain bundle (MFB) DA axons were prepared from α6-GFP transgenic mice (C) and nontransgenic control mice (D). Sections were stained for GFP and TH as in A and B. GFP and TH channels were merged, and yellow indicates α6-GFP staining within TH(+) DA axons. E, F, α6* nAChR expression in DA terminals in striatum. Coronal sections (bregma +0.14 mm) from α6-GFP transgenic mice (E) and nontransgenic control mice (F) containing dorsal striatum were prepared, stained for GFP and TH, and imaged as above. Yellow indicates α6-GFP staining within TH(+) DA terminals. CPu, caudate putamen.
To determine whether α6-GFP nAChRs were distributed like WT α6 nAChRs in the brain, we analyzed αCtxMII-sensitive and -resistant as well as cytisine-sensitive and -resistant epibatidine binding in several brain regions of α6-GFP transgenic mice and their nontransgenic littermates. In cortex, striatum, OT, thalamus, SC, and ventral midbrain, αCtxMII-sensitive and -resistant epibatidine binding were similar between α6-GFP and nontransgenic control mice. No significant differences in αCtxMII-sensitive or -resistant epibatidine binding were noted between α6-GFP and nontransgenic littermates in these brain regions (Table 1). This result was interesting given that α6-GFP transgenic mice possess six ectopic copies of the α6-GFP BAC transgene, and is consistent with previous studies in α6 L9′S mice, where multiple copies of the mutant α6 BAC did not result in increased α6* nAChRs as measured by radioligand binding (Drenan et al., 2008a).
Table 1.
Expression levels of α6* nAChRs in α6-GFP mice determined by radioligand binding assays
| [125I]-Epibatidine binding | Control | α6-GFP |
|---|---|---|
| CX MII-res | 63.3 ± 8.2 | 55.0 ± 9.5 |
| CX MII-sens | 2.0 ± 2.2 | 0.2 ± 0.9 |
| TH MII-res | 101.4 ± 15.6 | 99.9 ± 4.1 |
| TH MII-sens | 5.3 ± 2.7 | 9.8 ± 1.1 |
| ST MII-res | 45.6 ± 4.9 | 42.5 ± 2.4 |
| ST MII-sens | 7.1 ± 0.9 | 10.5 ± 0.8 |
| OT MII-res | 30.3 ± 1.9 | 28.6 ± 2.3 |
| OT MII-sens | 7.1 ± 1.1 | 6.5 ± 0.7 |
| SC MII-res | 73.2 ± 13.0 | 81.7 ± 6.1 |
| SC MII-sens | 15.1 ± 1.8 | 12.7 ± 7.3 |
| vMB MII-res | 81.7 ± 6.8 | 87.1 ± 7.6 |
| vMB MII-sens | 6.0 ± 1.7 | 5.8 ± 2.1 |
| CX cyt-res | −0.6 ± 0.7 | −0.2 ± 0.5 |
| CX cyt-sens | 65.9 ± 1.0 | 55.4 ± 0.8 |
| TH cyt-res | 4.3 ± 1.8 | 5.0 ± 1.4 |
| TH cyt-sens | 102.4 ± 2.6 | 104.6 ± 2.1 |
| ST cyt-res | 2.1 ± 0.0 | 2.1 ± 0.2 |
| ST cyt-sens | 47.5 ± 0.3 | 52.3 ± 0.0 |
| OT cyt-res | 3.8 ± 0.6 | 4.3 ± 0.5 |
| OT cyt-sens | 34.4 ± 0.9 | 29.6 ± 0.7 |
| SC cyt-res | 4.9 ± 1.2 | 4.8 ± 0.2 |
| SC cyt-sens | 79.0 ± 2.0 | 86.9 ± 0.8 |
| vMB cyt-res | 3.9 ± 0.8 | 3.9 ± 0.8 |
| vMB cyt-sens | 84.0 ± 2.0 | 89.0 ± 0.8 |
Each indicated brain region was dissected and the tissue was prepared for binding experiments as described in Materials and Methods. Samples were labeled with [125I]-epibatidine with or without competition with excess, unlabeled αCtxMII or cytisine. αCtxMII and cytisine-sensitive and -resistant components are shown. For all experiments, data from groups of α6-GFP and control (nontransgenic) littermate mice were compared. CX, cortex; OT, olfactory tubercle; SC, superior colliculus; ST, dorsal striatum; TH, thalamus; vMB, ventral midbrain. Data (in fmol/mg protein) are mean ± SEM (n = 5 mice).
To determine whether functional responses typically attributed (partially or fully) to α6* are altered in α6-GFP mice, we measured ACh-stimulated nAChR responses in Rb+ efflux and DA release assays. We prepared membranes from SC tissue for Rb+ efflux, which is a general assay of presynaptic nAChR function (Nashmi et al., 2007). α6-GFP Rb+ efflux responses were indistinguishable from those of nontransgenic littermates of α6-GFP mice. Both αCtxMII-sensitive (Fig. 3A) and resistant Rb+ efflux components were similar between these two genotypes at 0.3, 3, and 30 μm ACh (Table 2). Next, we prepared synaptosomes from dorsal striatum (ST) and OT and measured ACh-stimulated DA release. nAChR-dependent DA release was not altered in the α6-GFP mice, as there was no apparent difference between α6-GFP and nontransgenic control mice in this assay. For both ST and OT, both the αCtxMII-resistant and -sensitive (Fig. 3B,C) component of DA release (EC50 and Rmax) were unchanged by expression of α6-GFP nAChRs (Table 2). These nAChR binding and functional experiments suggest that α6-GFP nAChRs are functional, and that there is neither significant overexpression nor defective function of α6* nAChRs in α6-GFP BAC transgenic mice.
Figure 3.

Normal α6* nAChR function in α6-GFP transgenic mice. A, Normal Rb+ efflux in α6-GFP transgenic mice. A crude synaptosomal pellet was prepared from α6-GFP and their nontransgenic littermates, followed by Rb+ loading and stimulation of Rb+ efflux by ACh application. Rb+ efflux sensitive to αCtxMII (which includes α6-dependent efflux) is shown for 0.3, 3, and 30 μm ACh. B, C, Normal DA release in α6-GFP transgenic mice. ST (B) and OT (C) were dissected from α6-GFP and their nontransgenic littermates, followed by preparation of synaptosomes. Synaptosomes were loaded with [3H]-DA and stimulated with a range of ACh concentrations (10, 30, 100, and 300 nm and 1 and 3 μm) in the presence and absence of αCtxMII. Data were fitted to the Hill equation, and αCtxMII-sensitive concentration response curves are shown for ST (B) and OT (C).
Table 2.
Functional measurements of nAChR activity in α6-GFP mice
| DA release | Control | α6-GFP |
|---|---|---|
| ACh | ||
| ST MII-res Rmax | 12.61 ± 0.51 | 12.04 ± 1.20 |
| ST MII-res EC50 | 1.01 ± 0.09 | 1.12 ± 0.32 |
| OT MII-res Rmax | 15.86 ± 0.77 | 13.63 ± 0.83 |
| OT MII-res EC50 | 0.44 ± 0.05 | 0.39 ± 0.06 |
| ST MII-sens Rmax | 3.34 ± 0.55 | 3.93 ± 0.29 |
| ST MII-sens EC50 | 0.18 ± 0.05 | 0.23 ± 0.04 |
| OT MII-sens Rmax | 4.32 ± 0.52 | 4.86 ± 0.75 |
| OT MII-sens EC50 | 0.11 ± 0.04 | 0.19 ± 0.06 |
| K+ | ||
| ST K+ (20 mm) | 12.70 ± 1.29 | 10.61 ± 1.24 |
| ST K+ (20 mm) | 14.39 ± 0.35 | 12.69 ± 0.48 |
| Rb+ Efflux (ACh) | ||
| SC MII-res (0.3 μm) | 1.08 ± 0.29 | 0.82 ± 0.13 |
| SC MII-res (3 μm) | 3.04 ± 0.54 | 2.26 ± 0.56 |
| SC MII-res (30 μm) | 3.52 ± 0.15 | 3.45 ± 0.14 |
| SC MII-sens (0.3 μm) | 0.85 ± 0.32 | 0.40 ± 0.26 |
| SC MII-sens (3 μm) | 1.53 ± 0.51 | 1.31 ± 0.43 |
| SC MII-sens (30 μm) | 4.01 ± 0.77 | 3.23 ± 0.74 |
For the indicated measurement (Rb+ efflux and DA release), brain regions were dissected, synaptosomes were prepared, and assays were conducted using ACh as agonist. For DA release, a range of ACh concentrations were tested (or 20 mm K+ as a positive control), results were fit to the Hill equation, and Rmax and/or EC50 values for ACh were derived and are shown. K+ results are total response (units are cpm normalized to baseline). For Rb+ efflux, three ACh concentrations (0.3, 3.0, and 30 μm) were tested, and peak responses for each concentration are shown. For Rb+ efflux and DA release, αCtxMII-sensitive and -resistant activity components are shown. For all experiments, data from groups of α6-GFP and control (nontransgenic) littermate mice were compared. OT, olfactory tubercle; SC, superior colliculus; ST, dorsal striatum. Data (units are cpm normalized to baseline) are mean ± SEM (n = 4–6 mice).
Presynaptic and postsynaptic α6* nAChR expression in SC
To further study α6* nAChR expression in SC, we imaged α6-GFP expression at high resolution in α6-GFP mice. α6-GFP mice reveal strong α6* nAChR expression in the superficial gray layer of SC (Fig. 4A). In superficial SC (sSC), anti-GFP staining was notably diffuse, presumably indicating dense localization on axons and/or dendrites. Additionally, a population of neuronal somata in sSC and intermediate layers of SC also stained positive for α6-GFP, indicating the presence of several previously unappreciated α6* nAChR-expressing cell groups (Fig. 4A). Using anti-NeuN and anti-GFP double-staining, we determined that 13 ± 2% of sSC neurons are α6(+) (Fig. 4B). Double-label results with a nuclear stain (Qnuclear) were similar (Fig. 4C; data not shown). The location, size, and dendritic geometry of α6(+) neurons in sSC resembled sSC “horizontal cells” (Langer and Lund, 1974). Using confocal microscopy, we created a z-stack rendering of several α6(+) neurons in sSC. α6(+) sSC neurons were generally fusiform in geometry, typically having two or three primary dendrites that generally run tangentially to the surface of the colliculus (Fig. 4D).
Figure 4.

α6* nAChR expression in sSC neurons. A, α6* nAChR expression in a GFP-stained coronal section (bregma −4.16 mm) from α6-GFP transgenic mice is shown next to a diagram of the SC (Paxinos and Franklin, 2001). α6* nAChR expression is limited to the zonal layer (Zo), the superficial gray layer (SuG), and intermediate gray layer (InG). B, C, α6* nAChRs are expressed in a subset of neurons in sSC. In B, SC coronal sections were double stained with anti-GFP and anti-NeuN antibodies, followed by laser scanning confocal imaging. Individual GFP and NeuN channels and a merge micrograph are shown, at 60× magnification. In C, similar sections were double stained with anti-GFP antibodies and a nuclear stain, followed by confocal imaging as in B, D, Z-stack rendering of α6(+) neurons in sSC. Two α6(+) neurons in sSC were imaged with confocal microscopy and a 3D volume render of the cell body and its processes was created following serial Z-sectioning through the neuron. Op, optic nerve layer; InWh, intermediate white layer; DpG, deep gray layer; DpWh, deep white layer.
GAD67, a GABAergic marker, is densely expressed in superficial SC, including a population of GABAergic interneurons (Kaneda et al., 2008a). To further characterize α6(+) neurons in SC, we stained coronal SC sections with anti-GAD67 antibodies (Fig. 5A1). In sSC, we found modest to strong expression of GAD67 in nearly all α6(+) neurons (Fig. 5A2, single arrows). α6* nAChR expression defined only a subset of GAD67(+) neurons, however, as several GAD67(+) neurons in sSC did not express α6-GFP (Fig. 5A2, double arrows). Interestingly, the punctate/diffuse expression pattern seen surrounding α6(+) neurons in sSC did not colocalize with GAD67, supporting the idea that these puncta are axonal or presynaptic α6* nAChRs derived from glutamatergic RGC axons. To support this, we stained similar sections with anti-VGLUT1 antibodies (Fig. 5B1). VGLUT1 expression in sSC was modest and punctate, and a substantial fraction of α6(+) puncta also colocalized with VGLUT1 (Fig. 5B2, single arrows). α6-GFP expression in intermediate SC (iSC) was restricted to a small number of neurons, and did not exhibit a presynaptic expression profile similar to sSC (Figs. 4A, 5C1). Unlike sSC α6(+) neurons, iSC α6(+) neurons were not GABAergic (Fig. 5C2). Together, these results indicate that α6* nAChR subunits exhibit both presynaptic expression in glutamatergic axons and postsynaptic expression in a neuronal subpopulation in both the superficial and intermediate layers of the SC.
Figure 5.

Transmitter phenotypes of α6(+) neurons in SC. A, α6* nAChRs are expressed in GABAergic neurons in sSC. Coronal sections from α6-GFP transgenic mice containing sSC were double stained with anti-GFP and anti-GAD67 antibodies, followed by confocal microscopy. A2, Represents the boxed area in the A1 image. Single white arrows indicate cells coexpressing α6* nAChRs and GAD67, whereas double white arrows indicate cells expressing only GAD67. B, α6* nAChRs are also expressed in glutamatergic fibers in sSC. Coronal sections from α6-GFP transgenic mice containing sSC were double stained with anti-GFP and anti-VGLUT1 antibodies, followed by confocal microscopy. B2, Represents the boxed area in the B1 image. White arrows indicate colocalized VGLUT1 and α6* nAChRs. C, iSC α6(+) neurons are not GABAergic. Coronal sections from α6-GFP transgenic mice containing iSC were double stained with anti-GFP and anti-GAD67 antibodies, followed by confocal microscopy. C2, Represents the boxed area in the C1 image.
Functional expression of α6* nAChRs in GABAergic neurons
To determine whether α6* nAChRs are functional in sSC GABAergic neurons, we made whole-cell recordings from sSC neurons in slices from mice expressing hypersensitive α6 L9′S* nAChRs. These mutant receptors are 10- to 100-fold more sensitive to agonists than WT, allowing for selective activation of α6* nAChRs (Drenan et al., 2008a). In previous experiments with α6 L9′S* nAChRs expressed in midbrain DA neurons, 1 μm nicotine is sufficient to strongly activate an inward current only in neurons from mutant mice (Drenan et al., 2008a). In coronal slices, we locally applied nicotine (1 μm) to visually identified voltage-clamped neurons in the superficial layer of SC using a drug-filled micropipette and a Picospritzer. In 13 of 21 recorded neurons in α6 L9′S slices, we recorded inward currents (rise time <100 ms) characteristic of nAChR responses (Fig. 6A). These responses were blocked by αCtxMII (100 nm) (Fig. 6A), suggesting that they were mediated by α6* nAChRs. In α6 L9′S neurons with inward responses, the average peak amplitude of the nicotine-induced currents was −47 ± 5 pA (Fig. 6B). Responses to 1 μm nicotine in these neurons were specific to the α6 L9′S genotype, as we recorded no detectable responses to 1 μm nicotine in nontransgenic control slices (Fig. 6B,C). Higher concentrations of nicotine (100 μm) were required to elicit similar responses in sSC neurons from control slices (Fig. 6C). Responses to 1 μm nicotine in the remaining eight neurons from L9′S slices were either nonexistent or small but complex responses with inward and outward components (data not shown). We recorded α6* nAChR-mediated responses in a higher fraction of recorded neurons in α6 L9′S mice than we expected based on fluorescent neurons in α6-GFP mice. We often selected larger cells when searching for healthy neurons from which to record in sSC, and α6 nAChR subunits may be selectively present in larger sSC neurons. Alternatively, α6(+) neurons in sSC may be intrinsically healthier than α6(−) sSC cells, allowing them to preferentially survive the slicing procedure.
Figure 6.

α6* nAChRs function in sSC neurons. A, α6-dependent nicotinic currents in sSC neurons. Coronal slices were prepared from α6 L9′S transgenic mice, and sSC neurons were studied with patch-clamp electrophysiology. sSC cells recorded in whole-cell mode were stimulated with nicotine (1 μm) to activate nAChRs. Responses to 1 μm nicotine were sensitive to blockade by αCtxMII (lower current trace). A representative response is shown. Scale bar, 25 pA; 1 s. B, Quantification of peak nicotine-evoked currents in sSC neurons. Peak nicotine-elicited (1 μm nicotine) currents from each sSC neuron in nontransgenic control or α6 L9′S slices are plotted. C, Higher nicotine concentrations are required to activate nAChRs in nontransgenic control sSC neurons. sSC neurons in nontransgenic control slices did not respond to 1 μm nicotine but responded with typical nAChR inward currents when stimulated with 100 μm nicotine. Scale bar, 20 pA; 1 s. D, Firing responses of sSC α6(+) neurons. sSC neurons from α6 L9′S slices that respond to 1 μm nicotine were recorded in current-clamp mode. Membrane potential was recorded in response to depolarizing, zero, or hyperpolarizing current injections. Representative traces are shown, and the average resting membrane potential for all studied α6(+) sSC neurons is indicated. Scale bar, 30 mV; 400 ms. E, Ih current in α6(+) sSC neurons. The same group of cells analyzed in D were held in voltage-clamp mode at −60 mV, and membrane currents were recorded during hyperpolarizing voltage steps (−60 mV, −70 mV, −80 mV, −90 mV, −100 mV, −110 mV, and −120 mV). Representative traces are shown. Scale bar, 40 pA; 300 ms. F, Current-voltage relations for Ih currents shown in E. Peak current changes were measured immediately before the end of each hyperpolarizing pulse. Data are mean ± SEM. ***p < 0.0001.
To further characterize α6(+) neurons in sSC, we recorded several voltage-clamp and current-clamp responses in these cells. α6(+) sSC neurons had an average resting membrane potential of −56 ± 4 mV, and typically did not fire spontaneous action potentials. In response to depolarizing current injections of +20 to +40 pA, α6(+) neurons fired action potentials at 20–40 Hz (Fig. 6D). In response to hyperpolarizing current injections, typical α6(+) sSC neurons responded with a small but distinct and rapid adaptation in its membrane potential (Fig. 6D). This voltage “sag” is characteristic of expression of Ih currents. To determine whether these neurons express Ih currents, we voltage clamped α6(+) neurons and recorded current responses following hyperpolarizing voltage steps. α6(+) sSC neurons did express Ih currents (Fig. 6E), with a maximum hyperpolarization-activated current of −31 ± 6 pA during hyperpolarization to −120 mV (Fig. 6F).
α6-dependent responses in α6(+) neurons could be due to activation of somatodendritic nAChRs and cation influx through nAChRs, or they may result from indirect activation of cationic conductances. In our recording conditions, we voltage clamp sSC neurons at −60 mV, and ECl is ∼−83 mV. As a result, GABAA receptor activation is unlikely to play a major role in generating α6-dependent inward current responses. Furthermore, NMDA-dependent currents are an unlikely contributor, as these channels are largely blocked by intracellular Mg2+ at −60 mV. To determine whether inward current responses seen in α6(+) neurons in slices from α6 L9′S mice are mediated by postsynaptic versus presynaptic nAChRs, we treated slices with 6-cyano-7-nitroquinoxaline-2,3-dione (CNQX; 20 μm) to inhibit fast excitatory glutamatergic transmission. In the presence of CNQX, the amplitude and duration of nicotine-evoked currents were largely unchanged relative to control, suggesting that presynaptic AMPA receptors do not play a role in generating inward currents in α6(+) neurons (Fig. 7A, upper and middle trace). Next, we blocked voltage-gated Na+ channels with TTX (0.5 μm) to eliminate synaptic activity requiring action potentials. In the presence of CNQX and TTX, inward current responses in α6(+) neurons remained largely unaltered, again suggesting a direct cation influx through nAChRs is responsible for the inward current responses seen in our slice preparations (Fig. 7A, bottom trace).
Figure 7.

α6* nAChRs in sSC neurons are postsynaptic and respond to ambient ACh. A, Whole-cell nAChR responses in α6(+) neurons are postsynaptic. Responses to 1 μm nicotine in α6 L9′S sSC neurons were tested for sensitivity to CNQX (20 μm) and CNQX plus TTX (0.5 μm). Scale bar, 20 pA; 2 s. B, Holding currents in α6(+) sSC neurons exhibits greater membrane conductance fluctuations. sSC α6(+), α6(−), and nontransgenic neurons responding to 100 μm nicotine were recorded in voltage-clamp mode. Representative voltage-clamp records showing membrane conductance fluctuations in the indicated cell type are shown. Scale bar, 6 pA; 600 ms. C, Quantification of membrane conductance fluctuations in α6 L9′S α6(+) and α6(−) sSC neurons. Average root mean square noise for voltage-clamp membrane currents recorded in sSC neurons identified as α6(+) or α6(−) is shown. Data are mean ± SEM. A Student's t test was used to compare α6(−) and α6(+) RMS noise. **p < 0.01. D, Increased membrane conductance fluctuations in α6(+) sSC neurons is blocked by αCtxMII. Identified α6(+) sSC neurons in α6 L9′S slices were recorded in voltage-clamp mode, and membrane conductance fluctuations were observed in the presence of CNQX, CNQX plus TTX, or αCtxMII (100 nm). Scale bar, 6 pA; 600 ms. E, Membrane conductance fluctuations in a6(+) sSC neurons are eliminated by inhibition of ACh release. α6(+) sSC neurons were recorded as in D, and membrane conductance fluctuations were observed in the presence of HC-3 (50 μm) and after drug washout. A representative experiment (n = 2) is shown.
α6(+) neurons in sSC were often characterized by a tonic membrane conductance that was apparent when voltage-clamped at −60 mV (Fig. 7B, upper trace). This enhanced membrane conductance was absent in α6(−) sSC neurons from α6 L9′S mice (Fig. 7B, middle trace), and was similarly absent in sSC neurons from nontransgenic slices expressing inward nAChR-mediated currents (Fig. 7B, bottom trace). Indeed, in α6 L9′S sSC neurons, there was an increased noise in the voltage-clamp record in α6(+) neurons compared withα6(−) neurons (Fig. 7C). These currents lacked the waveform of typical EPSCs or IPSCs that are generated via point-to-point synaptic transmission mechanisms, and were suggestive of volume transmission via ACh. These tonic membrane currents were largely unaffected by treatment of slices with CNQX and TTX (Fig. 7D, upper and middle trace). Tonic membrane currents in sSC α6(+) neurons were completely blocked, however, by αCtxMII (Fig. 7D, bottom trace). Bath application of hemicholinium-3 (HC-3; 50 μm), which blocks choline uptake into cholinergic presynaptic terminals and results in elimination of ACh release, was sufficient to eliminate tonic membrane currents in sSC α6(+) neurons (Fig. 7E; n = 2, representative results shown). These results in α6 L9′S slices, where α6* nAChR coupling to locally released ACh is exaggerated, suggest that WT α6* nAChRs in sSC neurons are strongly activated by tonic or phasic ACh. α6* nAChR activation by ACh may increase GABA release in sSC to influence processing of visual information.
To confirm in vivo that α6* nAChRs are expressed in sSC neurons, we measured c-Fos induction in this brain area following intraperitoneal injections of nicotine. α6 L9′S and nontransgenic control littermate mice were injected with saline, or a dose of nicotine (0.15 mg/kg; i.p.) that selectively induces a behavioral effect in L9′S mice but not control mice (Drenan et al., 2008a, 2010). At this dose, nicotine robustly induced c-Fos expression in α6 L9′S sSC, which was not the case in nontransgenic control mice (Fig. 8A). Saline injections in nontransgenic control mice and L9′S mice resulted in similar levels of c-Fos expression compared with nontransgenic control mice injected with nicotine (Fig. 8A). We sampled and quantified c-Fos expression at several points across the anterior to posterior extent of the sSC. c-Fos induction was significantly higher within the α6 L9′S line when we compared saline versus nicotine (0.15 mg/kg) (α6 L9′S, nicotine: 12.3 × 10⁻⁴ c-Fos(+) cells/μm2; α6 L9′S, saline: 7.1 × 10⁻⁴ c-Fos(+) cells/μm2; p < 0.0001) (Fig. 8B). There was no significant difference in c-Fos induction/expression within nontransgenic control mice when we compared saline versus nicotine (nontransgenic, nicotine: 5.7 × 10⁻⁴ c-Fos(+) cells/μm2; nontransgenic, saline: 6.0 × 10⁻⁴ c-Fos(+) cells/μm2; p = 0.68) (Fig. 8B). Together with our electrophysiology results from α6 L9′S mice, these results support the idea that α6* nAChRs function in sSC, and that activation of these nAChRs can influence neuronal excitability.
Figure 8.
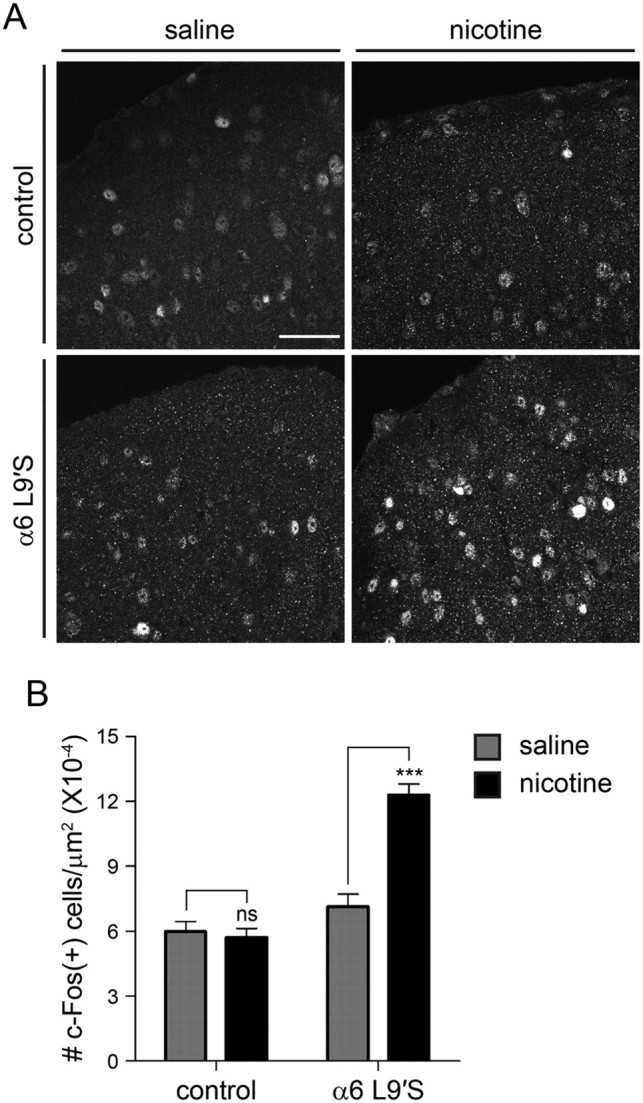
Activation of sSC α6* nAChRs in vivo. A, Induction of c-Fos expression following nicotine injections in control and α6 L9′S mice. Mice of the indicated genotype were injected with saline or nicotine (0.15 mg/kg; i.p.), perfused, and brains were removed and sectioned for anti-c-Fos staining. Representative sSC-containing brain sections stained with anti-c-Fos antibodies are shown for control and α6 L9′S mice. Scale bar, 50 μm. B, Quantification of c-Fos staining. Images (n = 10 for each genotype) of c-Fos-stained sSC brain sections, sampled from multiple bregma levels, were analyzed for the number of c-Fos immunoreactive cells per square micrometer of brain tissue. Results from saline and nicotine injections for control and α6 L9′S mice are plotted. Data are mean ± SEM. A Student's t test was used to compare saline versus nicotine within mouse lines; ***p < 0.0001.
Discussion
Previous pioneering studies on nAChR expression in visual and DAergic areas have often relied on radiolabeled probes such as αCtxMII and epibatidine (Whiteaker et al., 2000a,b, 2002). Because αCtxMII does not discriminate well between α6* nAChRs and α3* nAChRs, there remain uncertainties about which nAChR subtypes are most important without concomitant use of other tools that help amplify or isolate the function of particular nAChRs. Here, we have used a new transgenic reporter mouse expressing GFP-labeled α6 nAChR subunits to map α6* nAChR expression at high resolution. We demonstrate conclusively that α6* nAChR subunits exhibit a specific expression pattern in the mouse visual system, including expression in a subset of RGCs, a striated, presynaptic expression pattern in visual thalamus, and dense presynaptic and postsynaptic expression in superficial and intermediate/deep layers of SC. α6* nAChRs, as we and others have previously suggested (Le Novère et al., 1996; Léna et al., 1999; Azam et al., 2002; Drenan et al., 2008a), are specifically expressed in cell bodies, axons, and presynaptic terminals of catecholamine-producing neurons in the ventral midbrain (SNc/VTA) and dorsal pons (LC).
Our data demonstrating expression of α6* nAChRs in retinal cells and retinal axons are consistent with previous findings, including mRNA in situ hybridization studies (Moretti et al., 2004), eye enucleation experiments (Gotti et al., 2005), and studies on α6 KO mice (Champtiaux et al., 2002; Gotti et al., 2005). Our α6* nAChR expression data in the retina, where only ∼52% of GCL neurons (presumptive RGCs) express α6* nAChRs, suggests that α6* nAChRs perform a specific function(s) in one or more subsets of RGCs, rather than a uniform modulation of RGCs. This is consistent with recent evidence detailing numerous subpopulations of RGCs, each with unique features (Kim et al., 2010; Kay et al., 2011). Direction-selective RGCs express several nAChR subtypes (Strang et al., 2007), and α6* nAChRs may be expressed in some or all of these cells. We did not find significant expression of α6 subunits in putative RGC dendrites in the inner plexiform layer (Fig. 1C). Together with strong expression in optic nerve axons, these data suggest that retinal-derived α6* nAChRs may be selectively targeted to axons and/or presynaptic terminals. Dense yet specific expression of α6* nAChRs on a subset of retinal axons and/or glutamatergic presynaptic terminals in retinorecipient areas suggests that α6* nAChRs mediate cholinergic sensitization of specific visual signals, such as subsecond changes in contrast or the appearance of novel objects in the visual field.
Previous studies using [125I]-αCtxMII to detail α3/α6 nAChR binding and expression in retinorecipient structures such as dLGN and SC were not—due to the inherently low resolution provided by radiolabeled probes—able to resolve somatic expression of α6 versus dense localization in presynaptic structures. Our data using GFP-labeled α6 nAChR subunits coupled with high-resolution confocal microscopy confirm that α6* nAChRs are expressed not only in glutamatergic RGC axons (Fig. 5B), but in a particular cell population in sSC (Fig. 4). A previous report indicated that eye enucleation reduced α6* nAChRs in SC by 91% and β3* nAChRs by 92% (Gotti et al., 2005). The residual α6* nAChRs in these experiments could correspond to the postsynaptic sSC α6* nAChRs we describe here. The pattern of somatic α6* nAChR expression in sSC and iSC is nearly identical to mRNA in situ hybridization data available for α6* and β3* nAChR subunits from the Allen Brain Atlas (www.brain-map.org). sSC GABAergic α6(+) neurons are fusiform in shape with two or three primary dendrites (Fig. 4D), were found within 200 μm of the surface of the colliculus, and were characterized by a modest Ih current (Fig. 6E,F). These characteristics correspond best to sSC horizontal cells (Langer and Lund, 1974; Endo et al., 2003, 2008), which are GABAergic interneurons. This suggests that α6* nAChR activity may be important for shaping transmission of visual information as it proceeds from the optic nerve to the output layers of the SC. A previous report demonstrated agonist-evoked inward and outward currents in sSC neurons that were attributed to several nAChR subtypes. Putative horizontal cells in sSC often had αCtxMII-sensitive components to their inward current responses, implicating α6 and/or α3 nAChRs (Endo et al., 2005). Outward currents in other sSC neurons, which were partially mediated by presynaptic facilitation of GABA release, were also blocked by αCtxMII (Endo et al., 2005). These results, together with our data, suggest an important role for α6* nAChRs in shaping GABAergic transmission in sSC.
α4β2* and α6β2* nAChRs are critical regulators of nicotinic cholinergic transmission in the DA system, but is there a meaningful connection between DA transmission and visual processing? In awake behaving cats, Horvitz and et al. (1997) reported the production of phasic DA neuron firing in response to nonconditioned visual stimulation. The phasic responses in DA neurons occurred too rapidly (∼50–100 ms) to involve significant processing by visual cortex, suggesting a subcortical route for visual information to reach DA neurons. More recently, a direct projection from intermediate and deep layers of SC to ventral midbrain DA neurons has been described that likely mediates this rapid response in DA neurons (Comoli et al., 2003; May et al., 2009) and in downstream structures such as striatum (Dommett et al., 2005). In addition to their roles encoding motivation/value and salience, DA neurons also respond to sensory events not directly connected to reward or aversive experiences (Chiodo et al., 1980; Steinfels et al., 1983; Strecker and Jacobs, 1985; Horvitz, 2000; Horvitz et al., 1997). These responses occur at short latency (∼50–100 ms) and are strongest when the triggering stimulus is unexpected (Schultz and Romo, 1990). The latency of these sensory-evoked responses in DA neurons, along with the fact that they preferentially respond to novel cues, is highly consistent with their being generated by the SC (Bromberg-Martin et al., 2010). It is interesting that α6* nAChRs are not only expressed in presynaptic and postsynaptic structures in sSC, but also in sparse non-GABAergic cell bodies in iSC (Fig. 5C). Intermediate and deep layers of SC receive input from and provide feedback to superficial SC (Katsuta and Isa, 2003; Endo et al., 2008; Kaneda et al., 2008b; Phongphanphanee et al., 2011). These α6(+) neurons may be among those that project directly to midbrain DA neurons, and further studies are required to elucidate their function.
In light of this role of the SC in triggering DA neuron phasic firing in response to an unexpected visual stimulus, it is interesting that α6* nAChR expression is enriched in this pathway. Expression of α6* nAChRs in RGCs, the optic nerve, visual thalamus, the SC, DA neuron cell bodies, DA axons, and DA presynaptic terminals largely encompasses α6* nAChR expression in the mammalian brain. Together, our data along with previous findings suggest that α6* nAChRs may be uniquely suited to mediate cholinergic sensitization of brain pathways important for recognizing and responding to unexpected and potentially important sensory experiences. Although other nAChR subunits are also expressed in some of these brain areas (Moretti et al., 2004; Endo et al., 2005; Gotti et al., 2005; Cox et al., 2008), this role for α6* nAChRs contrasts with the action of α4(non-α6)β2* nAChRs, which are more widely expressed and may play a more general—though still crucial—role in cholinergic sensitization of neural circuits. What advantage do α6 nAChR subunits provide over nAChRs already containing α4 and β2 subunits? α6* nAChRs are among those with the highest sensitivity (Salminen et al., 2007), which could reflect the particular evolutionary importance of reliably alerting and responding to novel, potentially rewarding events in the environment. Additional studies are required to fully explore the role α6* nAChRs at the intersection of visual and DAergic systems.
Footnotes
This work was supported by NIH Grants DA030396, DA17279, DA12242, DA015663, DA03194, MH53631, and GM48677. Thanks to the Purdue Histology and Phenotyping Laboratory (Purdue University, School of Veterinary Medicine) for technical assistance with histology procedures.
The authors declare no competing financial interests.
References
- Azam L, McIntosh JM. Characterization of nicotinic acetylcholine receptors that modulate nicotine-evoked [3H]norepinephrine release from mouse hippocampal synaptosomes. Mol Pharmacol. 2006;70:967–976. doi: 10.1124/mol.106.024513. [DOI] [PubMed] [Google Scholar]
- Azam L, Winzer-Serhan UH, Chen Y, Leslie FM. Expression of neuronal nicotinic acetylcholine receptor subunit mRNAs within midbrain dopamine neurons. J Comp Neurol. 2002;444:260–274. doi: 10.1002/cne.10138. [DOI] [PubMed] [Google Scholar]
- Azam L, Maskos U, Changeux JP, Dowell CD, Christensen S, De Biasi M, McIntosh JM. α-Conotoxin BuIA[T5A;P6O]: a novel ligand that discriminates between α6β4 and α6β2 nicotinic acetylcholine receptors and blocks nicotine-stimulated norepinephrine release. FASEB J. 2010;24:5113–5123. doi: 10.1096/fj.10-166272. [DOI] [PMC free article] [PubMed] [Google Scholar]
- Ballester M, Castelló A, Ibáñez E, Sánchez A, Folch JM. Real-time quantitative PCR-based system for determining transgene copy number in transgenic animals. Biotechniques. 2004;37:610–613. doi: 10.2144/04374ST06. [DOI] [PubMed] [Google Scholar]
- Briggs CA, Gubbins EJ, Marks MJ, Putman CB, Thimmapaya R, Meyer MD, Surowy CS. Untranslated region-dependent exclusive expression of high-sensitivity subforms of α4β2 and α3β2 nicotinic acetylcholine receptors. Mol Pharmacol. 2006;70:227–240. doi: 10.1124/mol.105.020198. [DOI] [PubMed] [Google Scholar]
- Bromberg-Martin ES, Matsumoto M, Hikosaka O. Dopamine in motivational control: rewarding, aversive, and alerting. Neuron. 2010;68:815–834. doi: 10.1016/j.neuron.2010.11.022. [DOI] [PMC free article] [PubMed] [Google Scholar]
- Champtiaux N, Han ZY, Bessis A, Rossi FM, Zoli M, Marubio L, McIntosh JM, Changeux JP. Distribution and pharmacology of α6-containing nicotinic acetylcholine receptors analyzed with mutant mice. J Neurosci. 2002;22:1208–1217. doi: 10.1523/JNEUROSCI.22-04-01208.2002. [DOI] [PMC free article] [PubMed] [Google Scholar]
- Champtiaux N, Gotti C, Cordero-Erausquin M, David DJ, Przybylski C, Léna C, Clementi F, Moretti M, Rossi FM, Le Novère N, McIntosh JM, Gardier AM, Changeux JP. Subunit composition of functional nicotinic receptors in dopaminergic neurons investigated with knock-out mice. J Neurosci. 2003;23:7820–7829. doi: 10.1523/JNEUROSCI.23-21-07820.2003. [DOI] [PMC free article] [PubMed] [Google Scholar]
- Chiodo LA, Antelman SM, Caggiula AR, Lineberry CG. Sensory stimuli alter the discharge rate of dopamine (DA) neurons: evidence for two functional types of DA cells in the substantia nigra. Brain Res. 1980;189:544–549. doi: 10.1016/0006-8993(80)90366-2. [DOI] [PubMed] [Google Scholar]
- Cohen BN, Mackey ED, Grady SR, McKinney S, Patzlaff NE, Wageman CR, McIntosh JM, Marks MJ, Lester HA, Drenan RM. Nicotinic cholinergic mechanisms causing elevated dopamine release and abnormal locomotor behavior. Neuroscience. 2012;200:31–41. doi: 10.1016/j.neuroscience.2011.10.047. [DOI] [PMC free article] [PubMed] [Google Scholar]
- Comoli E, Coizet V, Boyes J, Bolam JP, Canteras NS, Quirk RH, Overton PG, Redgrave P. A direct projection from superior colliculus to substantia nigra for detecting salient visual events. Nat Neurosci. 2003;6:974–980. doi: 10.1038/nn1113. [DOI] [PubMed] [Google Scholar]
- Cox BC, Marritt AM, Perry DC, Kellar KJ. Transport of multiple nicotinic acetylcholine receptors in the rat optic nerve: high densities of receptors containing α6 and β3 subunits. J Neurochem. 2008;105:1924–1938. doi: 10.1111/j.1471-4159.2008.05282.x. [DOI] [PubMed] [Google Scholar]
- Dommett E, Coizet V, Blaha CD, Martindale J, Lefebvre V, Walton N, Mayhew JE, Overton PG, Redgrave P. How visual stimuli activate dopaminergic neurons at short latency. Science. 2005;307:1476–1479. doi: 10.1126/science.1107026. [DOI] [PubMed] [Google Scholar]
- Drenan RM, Grady SR, Whiteaker P, McClure-Begley T, McKinney S, Miwa JM, Bupp S, Heintz N, McIntosh JM, Bencherif M, Marks MJ, Lester HA. In vivo activation of midbrain dopamine neurons via sensitized, high-affinity α6* nicotinic acetylcholine receptors. Neuron. 2008a;60:123–136. doi: 10.1016/j.neuron.2008.09.009. [DOI] [PMC free article] [PubMed] [Google Scholar]
- Drenan RM, Nashmi R, Imoukhuede P, Just H, McKinney S, Lester HA. Subcellular trafficking, pentameric assembly, and subunit stoichiometry of neuronal nicotinic acetylcholine receptors containing fluorescently labeled α6 and β3 subunits. Mol Pharmacol. 2008b;73:27–41. doi: 10.1124/mol.107.039180. [DOI] [PubMed] [Google Scholar]
- Drenan RM, Grady SR, Steele AD, McKinney S, Patzlaff NE, McIntosh JM, Marks MJ, Miwa JM, Lester HA. Cholinergic modulation of locomotion and striatal dopamine release is mediated by α6α4* nicotinic acetylcholine receptors. J Neurosci. 2010;30:9877–9889. doi: 10.1523/JNEUROSCI.2056-10.2010. [DOI] [PMC free article] [PubMed] [Google Scholar]
- Endo T, Yanagawa Y, Obata K, Isa T. Characteristics of GABAergic neurons in the superficial superior colliculus in mice. Neurosci Lett. 2003;346:81–84. doi: 10.1016/s0304-3940(03)00570-6. [DOI] [PubMed] [Google Scholar]
- Endo T, Yanagawa Y, Obata K, Isa T. Nicotinic acetylcholine receptor subtypes involved in facilitation of GABAergic inhibition in mouse superficial superior colliculus. J Neurophysiol. 2005;94:3893–3902. doi: 10.1152/jn.00211.2005. [DOI] [PubMed] [Google Scholar]
- Endo T, Tarusawa E, Notomi T, Kaneda K, Hirabayashi M, Shigemoto R, Isa T. Dendritic Ih ensures high-fidelity dendritic spike responses of motion-sensitive neurons in rat superior colliculus. J Neurophysiol. 2008;99:2066–2076. doi: 10.1152/jn.00556.2007. [DOI] [PubMed] [Google Scholar]
- Exley R, Maubourguet N, David V, Eddine R, Evrard A, Pons S, Marti F, Threlfell S, Cazala P, McIntosh JM, Changeux JP, Maskos U, Cragg SJ, Faure P. Distinct contributions of nicotinic acetylcholine receptor subunit α4 and subunit α6 to the reinforcing effects of nicotine. Proc Natl Acad Sci U S A. 2011;108:7577–7582. doi: 10.1073/pnas.1103000108. [DOI] [PMC free article] [PubMed] [Google Scholar]
- Gotti C, Moretti M, Zanardi A, Gaimarri A, Champtiaux N, Changeux JP, Whiteaker P, Marks MJ, Clementi F, Zoli M. Heterogeneity and selective targeting of neuronal nicotinic acetylcholine receptor (nAChR) subtypes expressed on retinal afferents of the superior colliculus and lateral geniculate nucleus: identification of a new native nAChR subtype α3β2(α5 or β3) enriched in retinocollicular afferents. Mol Pharmacol. 2005;68:1162–1171. doi: 10.1124/mol.105.015925. [DOI] [PubMed] [Google Scholar]
- Gotti C, Guiducci S, Tedesco V, Corbioli S, Zanetti L, Moretti M, Zanardi A, Rimondini R, Mugnaini M, Clementi F, Chiamulera C, Zoli M. Nicotinic acetylcholine receptors in the mesolimbic pathway: primary role of ventral tegmental area α6β2* receptors in mediating systemic nicotine effects on dopamine release, locomotion, and reinforcement. J Neurosci. 2010;30:5311–5325. doi: 10.1523/JNEUROSCI.5095-09.2010. [DOI] [PMC free article] [PubMed] [Google Scholar]
- Horvitz JC. Mesolimbocortical and nigrostriatal dopamine responses to salient non-reward events. Neuroscience. 2000;96:651–656. doi: 10.1016/s0306-4522(00)00019-1. [DOI] [PubMed] [Google Scholar]
- Horvitz JC, Stewart T, Jacobs BL. Burst activity of ventral tegmental dopamine neurons is elicited by sensory stimuli in the awake cat. Brain Res. 1997;759:251–258. doi: 10.1016/s0006-8993(97)00265-5. [DOI] [PubMed] [Google Scholar]
- Kaneda K, Isa K, Yanagawa Y, Isa T. Nigral inhibition of GABAergic neurons in mouse superior colliculus. J Neurosci. 2008a;28:11071–11078. doi: 10.1523/JNEUROSCI.3263-08.2008. [DOI] [PMC free article] [PubMed] [Google Scholar]
- Kaneda K, Phongphanphanee P, Katoh T, Isa K, Yanagawa Y, Obata K, Isa T. Regulation of burst activity through presynaptic and postsynaptic GABA(B) receptors in mouse superior colliculus. J Neurosci. 2008b;28:816–827. doi: 10.1523/JNEUROSCI.4666-07.2008. [DOI] [PMC free article] [PubMed] [Google Scholar]
- Katsuta H, Isa T. Release from GABA(A) receptor-mediated inhibition unmasks interlaminar connection within superior colliculus in anesthetized adult rats. Neurosci Res. 2003;46:73–83. doi: 10.1016/s0168-0102(03)00029-4. [DOI] [PubMed] [Google Scholar]
- Kay JN, De la Huerta I, Kim IJ, Zhang Y, Yamagata M, Chu MW, Meister M, Sanes JR. Retinal ganglion cells with distinct directional preferences differ in molecular identity, structure, and central projections. J Neurosci. 2011;31:7753–7762. doi: 10.1523/JNEUROSCI.0907-11.2011. [DOI] [PMC free article] [PubMed] [Google Scholar]
- Kim IJ, Zhang Y, Meister M, Sanes JR. Laminar restriction of retinal ganglion cell dendrites and axons: subtype-specific developmental patterns revealed with transgenic markers. J Neurosci. 2010;30:1452–1462. doi: 10.1523/JNEUROSCI.4779-09.2010. [DOI] [PMC free article] [PubMed] [Google Scholar]
- Langer TP, Lund RD. The upper layers of the superior colliculus of the rat: a Golgi study. J Comp Neurol. 1974;158:418–435. doi: 10.1002/cne.901580404. [DOI] [PubMed] [Google Scholar]
- Lee C, Kim J, Shin SG, Hwang S. Absolute and relative QPCR quantification of plasmid copy number in Escherichia coli. J Biotechnol. 2006;123:273–280. doi: 10.1016/j.jbiotec.2005.11.014. [DOI] [PubMed] [Google Scholar]
- Léna C, de Kerchove D'Exaerde A, Cordero-Erausquin M, Le Novère N, del Mar Arroyo-Jimenez M, Changeux JP. Diversity and distribution of nicotinic acetylcholine receptors in the locus ceruleus neurons. Proc Natl Acad Sci U S A. 1999;96:12126–12131. doi: 10.1073/pnas.96.21.12126. [DOI] [PMC free article] [PubMed] [Google Scholar]
- Le Novère N, Zoli M, Changeux JP. Neuronal nicotinic receptor α6 subunit mRNA is selectively concentrated in catecholaminergic nuclei of the rat brain. Eur J Neurosci. 1996;8:2428–2439. doi: 10.1111/j.1460-9568.1996.tb01206.x. [DOI] [PubMed] [Google Scholar]
- Livak KJ, Schmittgen TD. Analysis of relative gene expression data using real-time quantitative PCR and the 2−ΔΔC(T) Method. Methods. 2001;25:402–408. doi: 10.1006/meth.2001.1262. [DOI] [PubMed] [Google Scholar]
- May PJ, McHaffie JG, Stanford TR, Jiang H, Costello MG, Coizet V, Hayes LM, Haber SN, Redgrave P. Tectonigral projections in the primate: a pathway for pre-attentive sensory input to midbrain dopaminergic neurons. Eur J Neurosci. 2009;29:575–587. doi: 10.1111/j.1460-9568.2008.06596.x. [DOI] [PMC free article] [PubMed] [Google Scholar]
- McClure-Begley TD, King NM, Collins AC, Stitzel JA, Wehner JM, Butt CM. Acetylcholine-stimulated [3H]GABA release from mouse brain synaptosomes is modulated by α4β2 and α4α5β2 nicotinic receptor subtypes. Mol Pharmacol. 2009;75:918–926. doi: 10.1124/mol.108.052274. [DOI] [PMC free article] [PubMed] [Google Scholar]
- Moretti M, Vailati S, Zoli M, Lippi G, Riganti L, Longhi R, Viegi A, Clementi F, Gotti C. Nicotinic acetylcholine receptor subtypes expression during rat retina development and their regulation by visual experience. Mol Pharmacol. 2004;66:85–96. doi: 10.1124/mol.66.1.85. [DOI] [PubMed] [Google Scholar]
- Nashmi R, Xiao C, Deshpande P, McKinney S, Grady SR, Whiteaker P, Huang Q, McClure-Begley T, Lindstrom JM, Labarca C, Collins AC, Marks MJ, Lester HA. Chronic nicotine cell specifically upregulates functional α4* nicotinic receptors: basis for both tolerance in midbrain and enhanced long-term potentiation in perforant path. J Neurosci. 2007;27:8202–8218. doi: 10.1523/JNEUROSCI.2199-07.2007. [DOI] [PMC free article] [PubMed] [Google Scholar]
- Paxinos G, Franklin KJB. The mouse brain in stereotaxic coordinates. Ed 2. San Diego, CA: Academic; 2001. [Google Scholar]
- Phongphanphanee P, Mizuno F, Lee PH, Yanagawa Y, Isa T, Hall WC. A circuit model for saccadic suppression in the superior colliculus. J Neurosci. 2011;31:1949–1954. doi: 10.1523/JNEUROSCI.2305-10.2011. [DOI] [PMC free article] [PubMed] [Google Scholar]
- Pons S, Fattore L, Cossu G, Tolu S, Porcu E, McIntosh JM, Changeux JP, Maskos U, Fratta W. Crucial role of α4 and α6 nicotinic acetylcholine receptor subunits from ventral tegmental area in systemic nicotine self-administration. J Neurosci. 2008;28:12318–12327. doi: 10.1523/JNEUROSCI.3918-08.2008. [DOI] [PMC free article] [PubMed] [Google Scholar]
- Salminen O, Murphy KL, McIntosh JM, Drago J, Marks MJ, Collins AC, Grady SR. Subunit composition and pharmacology of two classes of striatal presynaptic nicotinic acetylcholine receptors mediating dopamine release in mice. Mol Pharmacol. 2004;65:1526–1535. doi: 10.1124/mol.65.6.1526. [DOI] [PubMed] [Google Scholar]
- Salminen O, Drapeau JA, McIntosh JM, Collins AC, Marks MJ, Grady SR. Pharmacology of α-conotoxin mii-sensitive subtypes of nicotinic acetylcholine receptors isolated by breeding of null mutant mice. Mol Pharmacol. 2007;71:1563–1571. doi: 10.1124/mol.106.031492. [DOI] [PubMed] [Google Scholar]
- Schmittgen TD, Livak KJ. Analyzing real-time PCR data by the comparative C(T) method. Nat Protoc. 2008;3:1101–1108. doi: 10.1038/nprot.2008.73. [DOI] [PubMed] [Google Scholar]
- Schultz W, Romo R. Dopamine neurons of the monkey midbrain: contingencies of responses to stimuli eliciting immediate behavioral reactions. J Neurophysiol. 1990;63:607–624. doi: 10.1152/jn.1990.63.3.607. [DOI] [PubMed] [Google Scholar]
- Steinfels GF, Heym J, Strecker RE, Jacobs BL. Response of dopaminergic neurons in cat to auditory stimuli presented across the sleep-waking cycle. Brain Res. 1983;277:150–154. doi: 10.1016/0006-8993(83)90917-4. [DOI] [PubMed] [Google Scholar]
- Strang CE, Renna JM, Amthor FR, Keyser KT. Nicotinic acetylcholine receptor expression by directionally selective ganglion cells. Vis Neurosci. 2007;24:523–533. doi: 10.1017/S0952523807070435. [DOI] [PubMed] [Google Scholar]
- Strecker RE, Jacobs BL. Substantia nigra dopaminergic unit activity in behaving cats: effect of arousal on spontaneous discharge and sensory evoked activity. Brain Res. 1985;361:339–350. doi: 10.1016/0006-8993(85)91304-6. [DOI] [PubMed] [Google Scholar]
- Whiteaker P, Jimenez M, McIntosh JM, Collins AC, Marks MJ. Identification of a novel nicotinic binding site in mouse brain using [125I]-epibatidine. Br J Pharmacol. 2000a;131:729–739. doi: 10.1038/sj.bjp.0703616. [DOI] [PMC free article] [PubMed] [Google Scholar]
- Whiteaker P, McIntosh JM, Luo S, Collins AC, Marks MJ. [125I]-α-Conotoxin MII identifies a novel nicotinic acetylcholine receptor population in mouse brain. Mol Pharmacol. 2000b;57:913–925. [PubMed] [Google Scholar]
- Whiteaker P, Peterson CG, Xu W, McIntosh JM, Paylor R, Beaudet AL, Collins AC, Marks MJ. Involvement of the α3 subunit in central nicotinic binding populations. J Neurosci. 2002;22:2522–2529. doi: 10.1523/JNEUROSCI.22-07-02522.2002. [DOI] [PMC free article] [PubMed] [Google Scholar]
- Xiao C, Srinivasan R, Drenan RM, Mackey ED, McIntosh JM, Lester HA. Characterizing functional α6β2 nicotinic acetylcholine receptors in vitro: Mutant β2 subunits improve membrane expression, and fluorescent proteins reveal responsive cells. Biochem Pharmacol. 2011;82:852–861. doi: 10.1016/j.bcp.2011.05.005. [DOI] [PMC free article] [PubMed] [Google Scholar]