Abstract
The antimicrobial effects of garlic (Allium sativum) extract (25, 50, 75, 100, and 200 μl/ml) and diallyl sulfide (5, 10 and 20 μM) on Listeria monocytogenes and Escherichia coli O157:H7 cultivated in tryptic soy broth at 4, 22 and 35°C for up to 7 days were investigated. L. monocytogenes was more resistant to garlic extract and diallyl compounds treatment than E. coli O157:H7. Fourier transform Infrared (FT-IR) spectroscopy indicated that diallyl constituents contributed more to the antimicrobial effect than phenolic compounds. This effect was verified by Raman spectroscopy and Raman mapping on single bacteria. Scanning electron microscope (SEM) and transmission electron microscope (TEM) showed cell membrane damage consistent with spectroscopic observation. The degree of bacterial cell injury could be quantified using chemometric methods.
Keywords: Raman spectroscopy, infrared spectroscopy, garlic, diallyl sulfides, Escherichia coli O157:H7, Listeria monocytogenes
Listeria monocytogenes is ubiquitous in the environment and has been found in many species of domestic and wild animals, plants, soil and water sources. It can tolerate temperatures between 3 and 45°C, pH between 5.4 and 9.6, high temperature short time pasteurization processes, and long periods of freezing. Enterohemorrhagic Escherichia coli (EHEC) are pathogenic bacteria that cause human illness following direct contact with infected humans or animals, or indirectly after consuming contaminated food or water 1.
Controlling foodborne pathogens is critical and natural plant extracts are potential food preservatives with high consumer acceptability. Polyphenolic compounds that bind to plant sugars as glucosides 2, 3 have antimicrobial activity. Garlic (Allium sativum) and onion (Allium cepa) also contain organosulfur compounds that possess antibacterial, antioxidant and anti-inflammatory activities 4-7. Allicin 8, 9, ajoene 10, and diallyl sulfides 5-7 are mainly responsible for the bioactive properties; but phenolic compounds and steroid saponins in Allium species may behave synergistically 3, 4.
Understanding the mechanism of antimicrobial activity is critical if these compounds are to be promoted as food additives. Most antimicrobial agents alter microbial cell membranes causing leakage or autolysis thus inhibiting growth or causing cell death. Gene activity and protein expression 11 and changes in spectral features 12 are common methods for study. Vibrational spectroscopy provides a rapid and noninvasive alternative to studying injury and changes in bacterial cell membranes 13-17. Infrared and Raman spectroscopies could provide complementary spectral features of bacteria 18. Mid-infrared and Raman spectroscopy can identify and differentiate bacteria 14, 19, 20, and detect bacterial injury from: thermal and cold treatment 12, bacteriocin 21, chemical and antibiotic treatment 22-24, acid and alkaline treatment 12, and an exposure to silver nanoparticles 25.
Spectral interference from food matrices pose a problem and techniques to overcome this include capture with immunomagnetic beads 26 and filtration 27 often coupled with spectroscopic analysis. Raman spectroscopy can target single bacterial cells using confocal microscopy and mapping techniques 16. New techniques to improve Raman sensitivity such as a shell-isolated substrate designed for surface enhancement of Raman signals for bioanalytes can overcome poor reproducibility of surface enhanced Raman scattering (SERS) substrates 28. In current study, cell injury caused by garlic and its diallyl constituents on Gram positive Listeria monocytogenes and Gram negative Escherichia coli O157:H7 were studied. SEM and TEM were used to verify structural cell injury.
EXPERIMENTAL SECTION
Chemicals and reagents
Folin-Ciocalteu reagent, gallic acid, methanol, 2,2 diphyenyl-1-picrylhydrazyl (DPPH), 6-hydroxy-2,5,7,8-tetramethyl-2-carboxylic acid (Trolox), acetonitrile, and tetrahydrofuran were obtained from Sigma-Aldrich (HPLC grade, St. Louis, MO, USA). Sodium carbonate was purchased from J.T. Baker Inc. (Phillipsburg, NJ, USA). Diallyl sulfide (purity 98%) was purchased from Sigma.
Reverse-phase HPLC (Agilent 1100 HPLC system) with a diode-array detector (240 nm) (Palo Alto, CA, USA) was used to check purity and stability of diallyl sulfide (10 μl injection volume) by separation on a Nova-Pak C18 column (4 μm, 4.6 ×150 mm, Waters Corporation, Milford, MA, USA) with a symmetry C18 guard column (5 μm, 3.9 × 20 mm, Waters) and 70:27:3 (v/v: acetonitrile to water to tetrahydrofuran) mobile phase at a 1 ml/min.
Culture preparation
Bacterial strains were obtained from the School of Food Science culture collection Washington State University (Pullman, WA, USA): E. coli O157:H7 (ATCC 35150, ATCC 43889 and ATCC 43890) and L. monocytogenes (ATCC 7644, ATCC19113, and ATCC 19114). Bacteria were resuscitated aerobically on tryptic soy agar (TSA) for 24 h at 37°C then transferred to 50 ml of tryptic soy broth (TSB). Inoculated broth was incubated at 37°C overnight from resuscitated cultures (~109 CFU/ml). Cells were recovered from 10 ml broth by centrifugation (4000 ×g, 30 min); supernatant was discarded, and the precipitate (wet pellet) was resuspended in 0.2% peptone water (Difco, Sparks, MD, USA). This procedure was repeated 2 times to remove media components.
Media
The control (unstressed) and stressed E. coli O157:H7 and L. monocytogenes samples were 10-fold serially diluted in 0.2% peptone water and spread plated (0.1 ml) onto TSA and incubated for 2 h at 37°C to allow for adequate time for injured cells to recover. Then, a thin layer (8 ml) of selective media was overlaid onto TSA and the plates were incubated for additional 22-46 h at 37°C 29. This step was taken to preclude the growth of other bacteria. Selective m-Endo agar LES (Difco) was used for E. coli O157:H7 and PALCAM agar (Difco) for L. monocytogenes.
Antimicrobial treatments with garlic concentrate and diallyl constituents
Fresh garlic products was purchased from Global Farms Enterprises, Inc. (Los Angeles, CA, USA), stored at ca. 22°C and used within 2 weeks. Garlic juice was produced aseptically from peeled cloves using a juice extractor (WARING PRO®). The fresh garlic juice (50 ml) was immediately centrifuged at 4000 ×g for 10 min at 22°C. The supernatant was filtered under vacuum through: polycarbonate 10.0 micron pore size membrane (K99CP04700, GE Water & Process Technologies, Trevose, PA, USA) then a 1 micron (K10CP04700s) and finally a 0.4 micron membrane (K04CP04700) to remove potential microbial contamination to prepare the garlic concentrate. This whole process was completed within 30 minutes. The concentrate was stored at 4°C and protected from UV light. The concentrate was added into sterile tryptic soy broth (TSB) within 30 minutes to avoid the loss of volatile organosulfur compounds.
Garlic concentrate was diluted to 0, 25, 50, 75, 100 and 200 l/ml in 100 ml TSB. Diallyl sulfides (5, 10 and 20 μM) were also added into 100 ml TSB. Garlic and/or diallyl sulfide TSB was inoculated (1 ml ca. 107 CFU/ml of either E. coli O157:H7 or L. monocytogenes cocktail to achieve an initial inoculation level of ca. 105 CFU/ml. Each sample was mixed well by vortexing, then incubated at 4, 22 and 35°C for 0, 1, 3, 5 and 7 days for garlic treated and 0, 1, 2, 3, 4, 5, 6 and 7 days for diallyl sulfide treated cell suspensions. At each sampling time, the samples were serially diluted with 2% (w/v) sterile buffer peptone water and the appropriate dilution was spiral plated onto TSA and then the overlay method as described above. After incubation at 37°C for 24-48 h, viable cells were determined. All treatments were performed in triplicate (N=3).
Measurement of total phenolic content and total antioxidant capacity
Two grams of chopped garlic was extracted with 15 ml methanol under magnetic stirring for 2 h at room temperature (ca. 22°C). The extract was centrifuged at 4000 ×g for 20 min and the supernatant filtered. The extraction procedure was repeated three times and supernatants pooled together. The dry weight of the extracts was determined and test samples standardized to 1 mg dry matter/ml (N=2). Total phenolic content (Folin-Ciocalteu method) and antioxidant capacity (DPPH method) 30 were determined.
Electron Microscopy
Scanning electron microscopy (SEM) and trans mission electron microscopy (TEM) were performed to examine morphological changes of E. coli O157:H7 and L. monocytogenes cells before and after treatment with garlic-derived organosulfur compounds (10 μM diallyl sulfide) [SEM: FEI Quanta 200F Field Emission scanning electron microscope (Field Emission Instruments, Hillsboro, OR, USA) using an accelerating voltage of 30 kV; TEM: Philips electron microscope (Field Emission Instruments, Hillsboro, OR, USA) operated at 200 kV].
FT-IR spectroscopy analysis
At the end of each treatment, 100 ml of each bacterial culture was recovered by centrifugation at 5000 rpm for 10 min. The supernatant was discarded and the pellet resuspended in 100 ml 0.85% sterile saline. This procedure was repeated again to remove media components. Then, 100 ml was filtered through an aluminum oxide membrane filter (0.2 μm pore size, 25 mm OD) (Anodisc, Whatman Inc., Clifton, NJ, USA) using a Whatman vacuum glass membrane filter holder (Whatman catalog no. 1960-032) to harvest bacterial cells. The anodisc membrane filter does not contribute spectral features between the wavenumbers of 4000 to 1000 cm−1 and provides a smooth and flat surface onto which the bacterial film can form 31. The anodisc filters were then removed from the filtration apparatus and air dried under laminar flow at room temperature (ca. 22°C) for 60 min.
FT-IR spectra were collected using a Nicolet 380 FT-IR spectrometer (Thermo Electron Inc., San Jose, USA). The aluminum oxide membrane filter coated with a uniform and thin layer of bacterial cells was placed in direct contact with the diamond crystal cell (30,000–200 cm−1) of the attenuated total reflectance (ATR) cell. Infrared spectra were recorded from 4002 to 399 cm−1 at a resolution of 4 cm−1. Each spectrum was acquired by adding together 32 interferograms. Six spectra were acquired at room temperature (22°C) for each sample (N=3). Spectra from the first two experiments were used to establish chemometric models and the spectra from the third experiment were used for model validation.
Raman spectroscopy
A WITec alpha300 Raman microscope (WITec, Ulm, Germany) equipped with a UHTS-300 spectrometer was used in this study. This system is equipped with a 532-nm laser source and a 785-nm laser source. During the measurement, the 532-nm laser was focused onto the sample at a microscope scanning stage through a 100× objective (Nikon, Melville, NY, USA). Raman scattering spectra were detected by a 1600 × 200 pixel CCD array detector. The size of each pixel was 16 × 16 m. Spectral data were gathered in WITec Project software v2.02 (WITec, Ulm, Germany). Spectra of each bacteria sample were collected with a simultaneous detection range from 3700 to 200 cm−1 in the extended mode. For measurements at a single location, each full spectral measurement was conducted with a 1-s integration time with 50 spectral accumulations and approximately 2 mW incident laser power. Spectral data were taken from sample at specific wavenumbers in the so-called fingerprint region (300 to 1800 cm−1). Full area scans were also performed to create Raman maps, with single spectrum integration times of 100 ms, saving 15,000 spectra acquired over a regularly spaced array of sample locations in a grid pattern (150 by 100 arrays).
KlariteTM (Renishaw Diagnostics, Glasgow, UK) SERS-active substrates were used in this study. These substrates were fabricated on silicon wafers coated with gold. Treated microbial cells (10 μl) were deposited onto the substrate for Raman measurements taken after 2 h drying under a fume hood at ca. 22°C.
Chemometric analysis and statistical analysis
Vibrational (both infrared and Raman) spectra were firstly pre-processed by EZ OMNIC 7.1a (Thermo Electron Inc.). The raw spectra were subtracted from relative background (control, aluminum membrane filter coated with residue after filtration). Then, automatic baseline correction was employed to flatten baseline, following by a smooth of 5 (Gaussian function of 9.643 cm−1). The preprocessed spectra were read by Excel (Microsoft Inc., Redmond, WA). The height and area of spectral bands were measured and calculated by OMNIC and Origin® 8.1 (OriginLab Co., Northampton, MA). Second derivative transforms using a 9-point Savitzky-Golay filter and wavelet transforms (with a scale of 7) were performed for spectral processing in Matlab to enhance the resolution of superimposed bands and to minimize problems from unavoidable baseline shifts. The reproducibility of vibrational spectra from three independent experiments was investigated by calculating Dy1y2 32. The comparison of spectra was performed by calculating selectivity (S) that indicates the spectral variations between reference samples (control garlic concentrate) and actual samples (bacterial-inoculated garlic concentrate) 27.
Chemometric models were established based on processed spectra, including cluster analysis (principal component analysis, PCA), dendrogram analysis (discriminant function analysis, DFA), class analog analysis (soft independent class of analog, SIMCA) and partial least squares regression (PLSR). PCA is used to reduce the dimensionality of multivariate data while preserving most of the variances. Those selected unrelated principal components (PCs) are plotted and visualized in cluster forms 14. DFA can construct branched dendrogram structures with prior knowledge of biological sample’s information 12. SIMCA is a supervised classification method. The test samples are compared to study the degree of analogy with those of the training set of samples 32. A combination of different chemometric models can improve selectivity and sample differentiation. The PLSR was employed for quantitative analysis using Matlab. A total of 18 spectra from each bacterial sample were used to establish the calibration model. A leave-one-out cross validation was performed to evaluate the prediction power of the model by removing one sample from the data set at a time and applying a calibration to the remaining standards. The suitability of the developed models for predicting viable E. coli O157:H7 and L. monocytogenes concentrations was assessed by regression coefficient (R), latent variables, the root mean square error of estimation (RMSEE), and the root mean square error of cross validation (RMSECV) 27. The overall suitability of the prediction models for bacterial concentration was evaluated from the residual prediction deviation (RPD) values. The wavenumbers between 1800 cm−1 and 900 cm−1 were selected for infrared based chemometric analyses and the wavenumber between 1800 cm−1 to 400 cm−1 were selected for Raman based chemometric analyses.
Three independent trials were conducted. The results were expressed as the mean of 3 independent replicates ± standard deviation. The significant difference (P < 0.05) of band areas from raw spectra and second derivative transformed spectra was determined by one-way analysis of variance (ANOVA) following T-test in Matlab.
RESULTS AND DISCUSSION
Inhibitory effects of garlic concentrate and organosulfur compounds on E. coli O157:H7 and L. monocytogenes
Organosulfur compounds and polyphenols have both antimicrobial and antioxidant activity and these two properties are related to each other 7. The total phenolic content (TPC) of garlic extract is 3.11 ± 0.33 mg GAE/g DW and total antioxidant capacity (TAC) measured as the DPPH radical is 0.91 ± 0.23 mg Trolox/g DW. The purity and stability of diallyl sulfide was monitored throughout the study by HPLC maintained at 97%. The decrease of TPC and TAC and decomposition of diallyl sulfide occurred at 4°C without light exposure but only following a long storage period of 3–4 months. Purified organosulfur compounds were used within 2 weeks and fresh garlic extract was prepared and used daily.
The effect of garlic concentrate (Supporting Information Table S1 and Table S2) and garlic derived organosulfur compounds (Supporting Information Table S3 and Table S4) on the growth of E. coli O157:H7 and L. monocytogenes was investigated at different temperatures over 0, 1, 3, 5 and 7 days. The bactericidal effect is approximately proportional to garlic and diallyl sulfide concentration and treatment time intervals. Garlic concentrate was not an effective antimicrobial for either microbe at 4°C. L. monocytogenes demonstrated a higher resistance to garlic and diallyl sulfide than E. coli O157:H7.
A concentration of 10 M of diallyl sulfide effectively eliminated E. coli O157:H7 in broth at 22°C at 6 days and L. monocytogenes in broth at 22°C at 7 days. This concentration of diallyl sulfide was effective against E. coli O157:H7 but not L. monocytogenes at 4°C. The diallyl sulfide content (10 M) used in this study was equivalent to 250-480 g/kg garlic or 18-34 fresh cloves (10 ml). Previous sensory studies using 10 M diallyl disulfide did not produce a marked off aroma in ground beef while a strong garlic smell remained at an equivalent concentration of garlic extract 7. Organosulfur compounds provided significant antioxidant capacity and the use at these concentrations in various food systems should be safe and acceptable in savory and moderate to highly flavored meat or vegetable based foods. In addition, diallyl sulfide components (diallyl sulfide, diallyl disulfide and diallyl trisulfide) compose approximately 80% of commercial garlic oil) and significant antimicrobial effects of these organosulfur compounds may partially explain the antimicrobial effect of commercial garlic oil 5.
FT-IR and Raman spectral features of L. monocytogenes and E. coli O157:H7
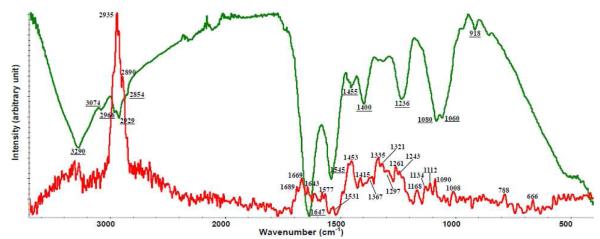
Complementary information on fundamental vibrational modes can be obtained from mid-IR and Raman spectra, as some vibrational motions are detected primarily with IR radiation and others primarily by Raman scattering with band assignments determined from earlier studies: Naumann (2001), Movasaghi et al. (2007), Movasaghi et al. (2008) and Lu et al. (2011c) 18, 32-34 and summarized in Supporting Information Table S5. Infrared and Raman spectral features of L. monocytogenes and E. coli O157:H7 intact cells are shown in Figure 1 (a) and (b).The wavenumber region below wavenumber of 1800 cm−1, in both FT-IR and Raman spectra provided detailed information about composition of bacterial cells.
Figure 1 (a).
Different raw vibrational spectroscopic spectra of E. coli O157:H7 (1) IR transmission spectrum (2) micro-Raman spectrum with an excitation wavelength of 532 nm.
Figure 1 (b).
Different raw vibrational spectroscopic spectra of L. monocytogenes (1) IR transmission spectrum (2) micro-Raman spectrum with an excitation wavelength of 532 nm.
Raman fingerprint provided a greater number of features for the bacterial cell membrane than FT-IR, but FT-IR bands were more intense at lower wavenumbers (1000–1100 cm−1) and less intense at higher wavenumbers (1200–1400 cm−1). Raman scattering relies on changes in the polarizability of functional groups as atoms vibrate while IR absorption requires a change in the intrinsic dipole moment to occur with molecular vibrations 18. Polar groups such as C=O, N-H and O-H have strong IR stretching vibrations and nonpolar groups such as C-C and S-S have intense Raman bands 20, 31.
Raman mapping and spectral reproducibility studies
Raman mapping combines the visual perception of microscopic digital imaging with Raman spectroscopy, creating a 3D spatially-accurate Raman scattering map or micrograph localized to the diffraction limit at a specific wavenumber 13, 14. Infrared spectroscopy can only determine bulk bacteria properties due to the illumination spot size and optical configuration; whereas confocal Raman microscopy can spectral information on single bacterial cells16. The Raman maps of E. coli O157:H7 and L. monocytogenes are in Figure 2.
Figure 2.
Raman mapping experiment of E. coli O157:H7 (a-c) and L. monocytogenes (d-e) cells at selective wavenumbers (a) 1208-1219 cm−1 (b) 1195-1520 cm−1 (c) 1525-1788 cm−1 (d) 1206-1539 cm−1 (e) 1535-1761 cm−1.
The first Raman map shows an example of a single-band spectral area plotted as a function of location; this analysis demonstrates how the sample plane begins at the optimal focal distance (top of map, highest intensities) and gradually falls out of focus as scanning continues (towards the bottom of map with decreasing intensities). The other four maps—two for each bacterium—illustrate the general variability across the fingerprint region of the Raman spectra resulting from morphological variation across the field of randomly positioned bacterial cells. Collectively, these maps are useful for quantifying the relative experimental effects due to the improbability of perfectly focusing on the membrane of a single bacterium at will.
The reproducibility of both FT-IR and Raman spectra from three independent experiments were calculated using the Pearson coefficient (expressed as Dy1y2 value). Mean D values between 7 and 10 are considered normal when analyzing the first or second derivative of samples prepared from cultures grown in independent assays and others asserted that D values can be as high as 300 when microorganisms from different genera are compared 32. The D value of FT-IR spectra of microorganisms is related to following factors: wavenumber region (window) and culture age. Firstly, five windows were selected to calculate and compare D value: (1) whole wavenumber region (3300 to 900 cm−1, w1), (2) 3000-2800 cm−1 (fatty acids, w2), (3) 1800-1500 cm−1 (proteins and peptides, w3), (4) 1500-1200 cm−1 (mixed region of proteins, fatty acids and other phosphate-carrying compounds, w4) and (5) 1200-900 cm−1 (carbohydrate, w5). For E. coli O157:H7, the low D values were obtained from w1 (17.35±1.28 to 24.59±1.93), w4 (12.39±1.03 to 18.43±2.18) and w5 (18.49±1.22 to 22.41±2.26) and high D values were obtained from w2 (72.23±10.32 to 86.56±15.14) and w3 (63.92±12.33 to 79.17±13.49). For L. monocytogenes, the low D values were obtained from w1 (11.21±0.98 to 14.12±1.32), w2 (18.29±1.57 to 20.95±2.01), and w5 (15.56±1.38 to 19.42±2.09) and high D values were obtained from w3 (57.92±11.16 to 68.39±14.93) and w4 (67.95±16.37 to 81.32±19.89). These results were acceptable and a bit higher since a cocktail rather than a single strain was used. The incubation time and its effect on spectral variation was also investigated and spectral reproducibility was consistent when the bacteria were cultivated within 20 h and longer cultivation time increased the D value tremendously (higher than 300). For both E. coli O157:H7 and L. monocytogenes, the shape of the cell and chemical composition change as the culture become old and both factors can significantly affect the reproducibility of vibrational spectral features 32.
The D value of Raman spectra of E. coli O157:H7 and L. monocytogenes was calculated only using 1800-400 cm−1 because of the large number of spectral features for analysis. The D values are 5.47±0.12 to 9.18±0.69 for E. coli O157:H7 and 2.39±0.25 to 7.37±0.79 for L. monocytogenes at 20 h cultivation time indicating that the consistency of Raman spectra is higher than FT-IR spectra. The reproducibility of Raman spectra was similar to FT-IR for different cultivation times. When incubation times are greater than 20 h, spectral variation increased significantly (P < 0.05) with an increase of D value (higher than 340 at 72 h). The reproducibility of Raman spectra was greater than FT-IR spectra while wavenumber (window) and cultivation time significantly affects spectral features emphasizing the need for standardized procedures for bacterial cultivation and spectral measurement.
Detection of bacterial injury
The variation of spectral features between the control (no treatment with garlic or sulfide) and garlic-untreated (sulfide-untreated) bacterial samples could be visually distinguished in second derivative transformed spectra 17, 19 and selectivity values (95% confidence interval) determined. Selectivity values greater than 1 are significant for bacterial detection 27. The presence of overlapping clusters indicates no segregation between treatments. At a concentration of 105 CFU/ml, the selectivity value is higher than 1, which is in agreement with previous studies 25 indicating that 105 CFU is the detection limit for filtration FT-IR methods for differentiation of bacterial spectral features. Furthermore, it is worth noting that the filtration FT-IR method provided a better selectivity compared to recent magnetic bead FT-IR method for pathogenic separation from complicated food matrices, such as fresh produce and meat 26.
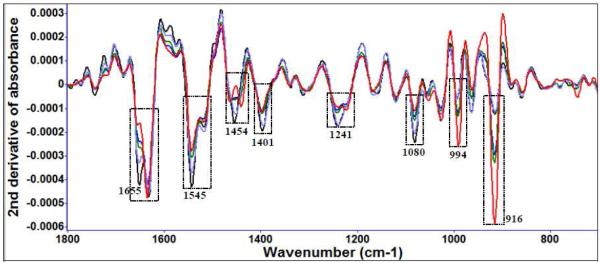
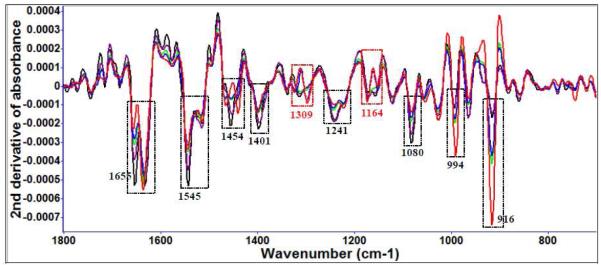
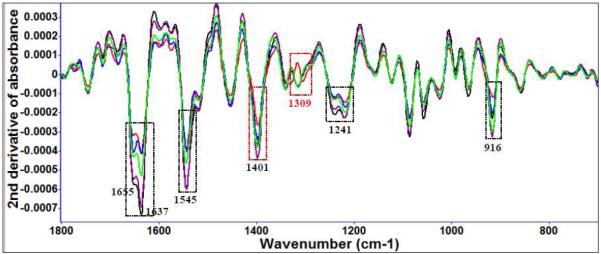
Diallyl sulfide (Figure 3 (a)) and garlic extract treatment (Figure 3 (b)) of E. coli O157:H7 show FT-IR spectral variations at several of the same locations and similar treatment times, for example, to protein amide and methyl features (Table 2). Other significant spectral features associated with bacterial cell injury included changes in nucleic acid and phospholipid features (Table 2).
Figure 3 (a).
Second derivative transformation of FT-IR spectral features of E. coli O157:H7 treated with 10 μM diallyl sulfide at 22°C for different time intervals (black: 0 day, purple: 1 day, green: 3 day, blue: 5 day, red: 7 day).
Figure 3 (b).
Second derivative transformation of FT-IR spectral features of E. coli O157:H7 treated with 25 μl/ml garlic concentrate at 22°C for different time intervals (black: 0 d, purple: 1 d, green: 3 d, blue: 5 d, red: 7 d). The red columns show differences in spectral features treated between garlic concentrate and organosulfur compounds.
Table 2.
Band assignments for bacterial injury from diallyl sulfide and garlic extract
| Bacteria | Antimicrobials | Cellular Structures Affected | FTIR Band Assignment | Raman Band Assignment | ||
|---|---|---|---|---|---|---|
| Proteins | amide I of α-helical structure | 1655 cm−1 | S-S disulfide stretch in proteins | 524 cm−1 | ||
| amide II | 1545 cm−1 | v(S-S) trans-gauche-trans (amino acid cysteine) | 540 cm−1 | |||
| sym bending modes of methyl groups in skeletal proteins | 1455 cm−1 | C-C twist aromatic ring | 620 cm−1 | |||
| asym CH3 bending of the methyl groups of proteins | 1449 cm−1 | C-S stretch mode of cysteine | 662 cm−1 | |||
| sym CH3 bending modes of the methyl groups of proteins | 1401 cm−1 | v(C-S) trans (amino acid cysteine) | 700 cm−1 | |||
| sym breathing of tryptophan | 756 cm−1 | |||||
| Diallyl sulfide | phenylalanine | 1008 cm−1 | ||||
| tyrosine | 1373 cm−1 | |||||
| E. coli O157:H7 | phenylalanine | 1582 cm−1 | ||||
|
|
||||||
| Lipids | CH2 scissoring mode of the acyl chain of lipids | 1465 cm−1 | phosphatidylinositol | 596 cm−1 | ||
| sym stretch of phosphate groups in phospholipids | 1224 cm−1 | phospholipid | 1130 cm−1 | |||
| sym phosphate stretching mode of phosphodiesters | 1080 cm−1 | |||||
| phosphodiester | 916 cm−1 | |||||
|
|
||||||
| Nucleic | acids asym phosphate stretch from phosphodiester groups of cellular nucleic acids | 1241 cm−1 | ND | |||
| C-O ribose and C-C | 994 cm−1 | |||||
|
|
||||||
| Phenolics | Proteins | C-O stretch mode of C-OH groups of serine, threonine, and tyrosine | 1164 cm−1 | ND | ||
| amide III | 1309 cm−1 | |||||
|
| ||||||
| amide I of α-helical structure | 1655 cm−1 | S-S disulfide stretch | 509 cm−1 | |||
| Proteins | amide I of β-sheet structures | 1637 cm−1 | v(S-S) trans-gauche-trans (amino acid cysteine) | 540 cm−1 | ||
| Diallyl sulfide | amide II | 1545 cm−1 | C-S stretch of proteins | 640 cm−1 | ||
|
|
||||||
| Lipids | phosphodiester | 916 cm−1 | ND | |||
|
|
||||||
| Nucleic acids | asym phosphate stretch from phosphodiester groups of cellular nucleic acids | 1241 cm−1 | ND | |||
|
|
||||||
| L. monocytogenes | Proteins | amide III | 1309 cm−1 | |||
| sym CH3 bending modes of methyl groups of proteins | 1401 cm−1 | ND | ||||
|
|
||||||
| Phenolics | Lipids | ND | C=O stretch | 1762 cm−1 | ||
|
|
||||||
| Polysaccharides | ND | saccharide | 1113 cm−1 | |||
| ring structures | 1416 cm−1 | |||||
note: sym: symmetric; asym: antisymmetric; ND: non detected
Some differences were observed between garlic and diallyl sulfide treatments in spectral regions associated with the C-O stretching mode of C-OH groups of serine, threonine, and tyrosine of proteins (1164 cm−1) and amide III (1309 cm−1). Proteins and phospholipids in bacterial cell membranes are the main targets attacked by plant antioxidants and these alterations to spectral features are consistent with previous findings. Band areas calculated using OMNIC and Origin® 8.1 varied significantly (P < 0.05) with different treatment times. For E. coli O157:H7, spectral variations resulting from damage by organosulfur compounds contributed more than 80% to the total spectral variation for the garlic extract treatments.
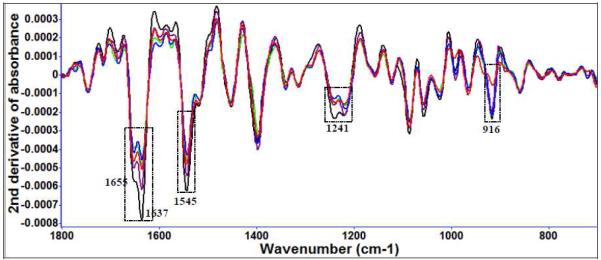
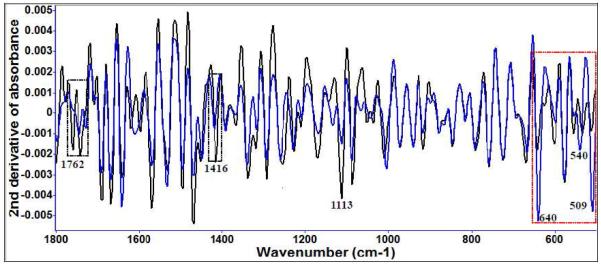
Diallyl sulfide (Figure 3 (c)) and garlic concentrate treatment (Figure 3 (d)) of L. monocytogenes show time and concentration affects indicative of cell injury (Table 2). The differences of FT-IR spectral variation between garlic-treated and diallyl sulfide-treated were observed at amide III (1309 cm−1) with similarities in the type of cell injury observed between E. coli and L. monocytogenes. Phenolic and organosulfur compounds contribute to protein damage as observed at 1401 cm−1 (symmetric CH3 bending modes of the methyl groups of proteins). Band area assessments using OMNIC and Origin® 8.1 indicated significant (P < 0.05) differences in the spectral features of L. monocytogenes indicated that organosulfur containing compounds contributed more than 75% of total affect seen for the garlic concentrate treatments.
Figure 3 (c).
Second derivative transformation of FT-IR spectral features of L. monocytogenes treated with 10 μM diallyl sulfide at 22°C for different time intervals (black: 0 d, purple: 1 d, green: 3 d, blue: 5 d, red: 7 d).
Figure 3 (d).
Second derivative transformation of FT-IR spectral features of L. monocytogenes treated with 25 μl/ml garlic concentrate at 22°C for different time intervals (black: 0 d, purple: 1 d, green: 3 d, blue: 5 d, red: 7 d). The red columns show differences in spectral features treated between garlic concentrate and organosulfur compounds.
L. monocytogenes was more resistant to cell injury from exposure to organosulfur compounds than E. coli O157:H7 and plating results validated this. Infrared spectroscopy results indicated that structural proteins, lipids and polysaccharides were affected. Structural proteins on the cell membrane appear to be a primary target of injury. Organosulfur compounds contributed more to antimicrobial effect against both bacteria with the remaining injury attributed to phenolic compounds.
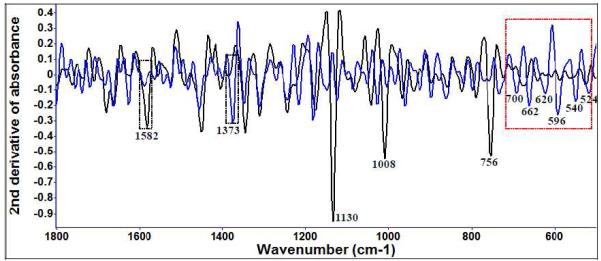
Raman spectroscopy provided additional insight as to the causes of cell injury at the level of a single bacterial cell. In the Raman spectra, the diallyl sulfide (10 μM) treatment at 22°C for E. coli O157:H7 (Figure 4 (a)) and Table 2 indicated that bands assigned to sulfur containing functional groups in proteins and other protein and polar lipid features were significantly altered.
Figure 4 (a).
Second derivative transformation of Raman spectral features of E. coli O157:H7 treated with 10 μM diallyl sulfide at 22°C for different time intervals (blue: treated for 5 days; black: control).
For L. monocytogenes (Figure 4 (b)) many signs of cell damage were apparent in the sulfur region (500–700 cm−1) (Table 2) affecting protein structure. Polysaccharides structures were also impacted. The significant variations in sulfur region of Raman spectra were similar for both L. monocytogenes and E. coli O157:H7. Previous studies suggest that inhibition of certain microbes is via rapid reaction of thiosulfinates with thiol groups in thiol-containing enzymes. For example, allicin and other sulfur components can freely penetrate through phospholipid bilayers and interact with the thiol-containing enzymes, causing microbial injury and death 9. In addition, the disulfide bond in ajoene appears to be necessary for antimicrobial activity, since reduction by cysteine, which reacts with disulfide bonds, destroys its antimicrobial activity 10. Allicin inhibits the activity of many –SH enzymes including xanthine oxidase, succinic dehydrogenase, and triose phosphate dehydrogenase 8, 9. The –S (O)–S– group shows inhibitory effect on –SH enzymes, while –S–S–, –S–, and –SO– groups were not effective 9.
Figure 4 (b).
Second derivative transformation of Raman spectral features of L. monocytogenes treated with 10 μM diallyl sulfide at 22°C for different time intervals (blue: treated for 5 days; black: control).
Here vibrational spectroscopy can verify bacterial inactivation from treatment with garlic extract and organosulfur compounds supporting earlier studies that protein and membrane damage are the primary factors in the inactivation of both Gram-positive and Gram-negative bacteria. L. monocytogenes is more resistant to garlic extract treatment than E. coli O157:H7. Coupling infrared and Raman spectroscopies provides a powerful method for monitoring bacterial stress and injury because some important markers (parameters), such as variation of sulfur compounds are measurable by Raman and other features such as phospholipid and secondary protein structure can be detected by FT-IR.
Electron microscopic examination of cell injury
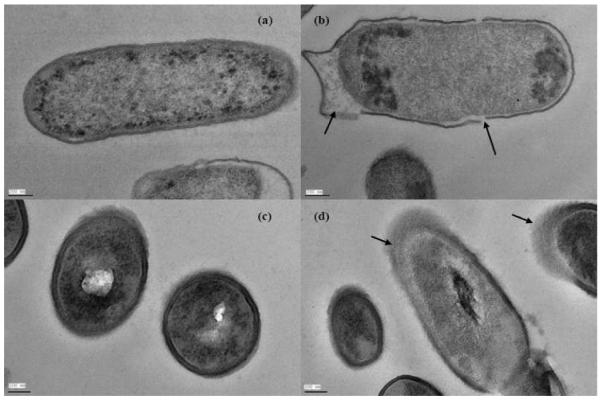
To correlate vibrational spectroscopic data with structure changes caused by garlic derived organosulfur compounds, SEM data (Supporting Information, Figure S1) and TEM data (Figure 5) were collected for untreated and treated bacteria (10 μM diallyl sulfide) following 5 days at 22°C. Figure 5 showed that untreated cells of E. coli O157:H7 and L. monocytogenes had uniform cellular structures with well-defined membranes and little debris in the cell’s surrounding environment. Exposure to organosulfur compounds resulted in morphological damage such as loss of the structural integrity of the wall, membrane, and intracellular matrix. Cell deformation, breakage of cell wall and membrane, condensation of cellular material, and presence of significant amounts of cytoplasmic material and membrane were observed from the damaged cells of E. coli O157:H7 and L. monocytogenes (Figure S1 and Figure 5).
Figure 5.
Transmission electron microscope images of Escherichia coli O157:H7 without (a) and with (b) the treatment of organosulfur compounds derived from garlic (Allium sativum) and Listeria monocytogenes without (c) and with (d) the treatment of organosulfur compounds derived from garlic (Allium sativum).
Spectral differentiation of cellular injury
The injury levels of L. monocytogenes and E. coli O157:H7 were investigated using three different segregation models, including cluster analysis (principal component analysis, PCA), dendrogram analysis (discriminant function analysis, DFA) and class analog analysis (soft independent modeling of class analog, SIMCA). All three analyses are based upon principal component selection with PCA being a nonsupervised chemometric model and DFA and SIMCA being supervised models 15, 22. Due to the features of high dimensional vectors for infrared and Raman spectra (wavenumber vs. signal intensity), major PCs extraction is important to chemometric model analysis 16, 35. Figure S2 (Supporting Information) and Figure S3 (Supporting Information) show clear segregation of L. monocytogenes and E. coli O157:H7 samples treated with garlic-derived organosulfur compound and/or garlic concentrate during various time intervals (0, 1, 3, 5 and 7 days) at 22°C. Tight clusters (PCA) (Figure S2) and clear segregation (DFA) (Figure S3) indicated significant (P < 0.05) treatment differences using interclass distance ranging from 7.38 to 41.12 based upon Mahalanobis distance measurements computed between the centroids of the classes. Clusters with interclass distance values higher than 3 are believed to be significantly different from each other 32. Class analog results provided a ~90% correction rate for data classifying was achieved for both infrared and Raman spectra. Thus, segregation models could differentiate and predict bacterial injury levels based on bacterial vibrational spectral features.
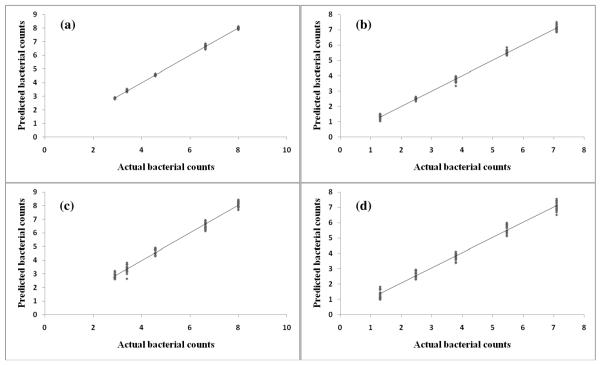
PLSR model analyses
PLSR using wavenumbers below 1800 cm−1 as x and an indicator variable (loading plot) as y was performed for both infrared and Raman spectroscopies for E. coli O157:H7 and L. monocytogenes to predict the level of injury between different bacterial treatments. The linear regression is shown in Figure 6 and model parameters are summarized in Table 1. Due to the limited sample numbers, leave-one-out method was performed as cross validation step. A good PLS model should have high values for R (>0.95) and RPD (>5), and low values for RMSEE and RMSECV (<1) for calibration and cross validation 27. Furthermore, a reasonable number of latent variable (generally, <10) is desired for PLSR model to avoid overfitting16. FT-IR and Raman PLSR models showed promising results for predicting survival E. coli O157:H7 and L. monocytogenes exposed to garlic extracts. Both infrared and Raman based PLSR models provided similar model behavior and prediction ability on the basis of R, RPD and RMSEE (Figure 6).
Figure 6.
Representative partial least squares regression for actual bacteiral survivial counts prediction in sterilized broth containing 10 μM diallyl sulfide for different time intervals at room temperature (22°C) for L. monocytogenes (a) and E. coli O157:H7 (b) using Raman spectra and L. monocytogenes (c) and E. coli O157:H7 (d) using infrared spectra.
Table 1.
Partial least squares regression models for quantification of live pathogenic strains treated with garlic derived organosulfur compounds (10 μM diallyl sulfide) in sterilized broth.
| Spectra | Range | No. of Samples | Latent Variables | R-Cal# | RMSEE-Cal | RPD-Cal | R-Val* | RMSEE-Val | RPD-Val |
|---|---|---|---|---|---|---|---|---|---|
| Listeria FT-IR | 2.85-8.03 | 90 | 8 | ≥ 0.96 | ≤ 0.16 | ≥ 17.55 | ≥ 0.92 | ≤ 0.31 | ≥ 10.73 |
| Listeria Raman | 2.87-7.96 | 90 | 7 | ≥ 0.99 | ≤ 0.23 | ≥ 12.11 | ≥ 0.96 | ≤ 0.42 | ≥ 8.97 |
| E. coli FT-IR | 1.28-6.89 | 90 | 7 | ≥ 0.95 | ≤ 0.32 | ≥ 20.91 | ≥ 0.91 | ≤ 0.52 | ≥ 15.28 |
| E. coli Raman | 1.32-7.01 | 90 | 7 | ≥ 0.99 | ≤ 0.27 | ≥ 14.46 | ≥ 0.97 | ≤ 0.40 | ≥ 10.83 |
Note: #Cal: calibration;
Val: validation. For FT-IR, the wavenumber 1800 to 700 cm−1 was used for model analyses; for Raman, the wavenumber between 1800 to 400 cm−1 was used for model analyses.
CONCLUSIONS
Garlic extract and the organosulfur compounds that they contain inhibit the growth of both E. coli O157:H7 and L. monocytogenes. FT-IR and Raman spectroscopies could predict the type and degree of cell injury providing insight into the antimicrobial mechanism of garlic extract and diallyl sulfides. Chemometric techniques could differentiate injury levels and PLSR models could be used to quantify actual bacterial survival. FT-IR and Raman spectroscopies provide complementary assessments of the antimicrobial effects and alteration to cell membrane structure providing a useful new tool to study antimicrobial effects of bioactive compounds from fruits and vegetables against important foodborne pathogens.
Supplementary Material
ACKNOWLEDGEMENT
We deeply appreciated Dr. Valerie Jean Lynch-Holm who aided us with electron microscope work (sample preparation and imaging) in the Franceschi Microscopy and Imaging Center at Washington State University, Pullman. This work was supported from funds awarded to B.A.R through a USDA special food security grant and from the School of Food Science at WSU. The authors also gratefully acknowledge the support of the National Science Foundation (award DMR-0619310), USDA-NIFA grant #2010-34479-20715, and the University of Idaho Biological Applications of Nanotechnology (BANTech) Center. Research in the laboratory of M.E.K. is supported by the National Institute of Health, Department of Health and Human Services, under contract number NO1-Al-30055, and, in part, from funds provided by the School of Molecular Biosciences at WSU. We also thank Dr. Douglas Call for critical reviewing the manuscript.
Footnotes
SUPPORTING INFORMATION AVAILABLE Additional information as noted in text.
References
- (1).Wu VCH. Food Microbiol. 2008;25:735–744. doi: 10.1016/j.fm.2008.04.011. [DOI] [PubMed] [Google Scholar]
- (2).Friedman M, Henika PR, Mandrell RE. J. Food Prot. 2002;65:1545–1560. doi: 10.4315/0362-028x-65.10.1545. [DOI] [PubMed] [Google Scholar]
- (3).Kim JW, Kim YS, Kyung KH. J. Food Prot. 2004;67:499–504. doi: 10.4315/0362-028x-67.3.499. [DOI] [PubMed] [Google Scholar]
- (4).Kyung KH, Lee YC. Food Rev. Int. 2001;17:183–198. [Google Scholar]
- (5).O’Gara EA, Hill DJ, Maslin DJ. Appl. Environ. Microbiol. 2000;66:2269–2273. doi: 10.1128/aem.66.5.2269-2273.2000. [DOI] [PMC free article] [PubMed] [Google Scholar]
- (6).Ross ZM, O’Gara EA, Hill DJ, Sleightholme HV, Maslin DJ. Appl. Environ. Microbiol. 2001;67:475–480. doi: 10.1128/AEM.67.1.475-480.2001. [DOI] [PMC free article] [PubMed] [Google Scholar]
- (7).Yin M-C, Cheng W-S. Meat Sci. 2003;63:23–28. doi: 10.1016/s0309-1740(02)00047-5. [DOI] [PubMed] [Google Scholar]
- (8).Feldberg RS, Chang SC, Kotik AN, Nadler M, Neuwirth Z, Sundstrom DC, Thompson NH. Antimicrob. Agents Chemother. 1998;32:1763–1768. doi: 10.1128/aac.32.12.1763. [DOI] [PMC free article] [PubMed] [Google Scholar]
- (9).Miron T, Rabinkov A, Mirelman D, Wilchek M, Weiner L. Biochim. Biophys. Acta. 2000;1463:20–30. doi: 10.1016/s0005-2736(99)00174-1. [DOI] [PubMed] [Google Scholar]
- (10).Naganawa R, Iwata N, Ishikawa K, Fukuda H, Fujino T, Suzuki A. Appl. Environ. Microbiol. 1996;62:4238–4242. doi: 10.1128/aem.62.11.4238-4242.1996. [DOI] [PMC free article] [PubMed] [Google Scholar]
- (11).Call DR, Bakko MK, Krug MJ, Roberts MC. Antimicrob. Agents Chemother. 2003;47:3290–3295. doi: 10.1128/AAC.47.10.3290-3295.2003. [DOI] [PMC free article] [PubMed] [Google Scholar]
- (12).Alvarez-Ordóñez A, Prieto M. Appl. Environ. Microbiol. 2010;76:7598–7607. doi: 10.1128/AEM.00312-10. [DOI] [PMC free article] [PubMed] [Google Scholar]
- (13).Huang WE, Griffiths RI, Thompson IP, Bailey MJ, Whiteley AS. Anal. Chem. 2004;76:4452–4458. doi: 10.1021/ac049753k. [DOI] [PubMed] [Google Scholar]
- (14).Jarvis RM, Goodacre R. Anal. Chem. 2004;76:40–47. doi: 10.1021/ac034689c. [DOI] [PubMed] [Google Scholar]
- (15).López-Díez E, Goodacre R. Anal. Chem. 2004;76:585–591. doi: 10.1021/ac035110d. [DOI] [PubMed] [Google Scholar]
- (16).Maquelin K, Choo-Smith L-P, van Vreeswijk T, Endtz HP, Smith B, Bennett R, Bruining HA, Puppels GJ. Anal. Chem. 2000;72:12–19. doi: 10.1021/ac991011h. [DOI] [PubMed] [Google Scholar]
- (17).Schuster KC, Reese I, Urlaub E, Gapes JR, Lendl B. Anal Chem. 2000;72:5529–5534. doi: 10.1021/ac000718x. [DOI] [PubMed] [Google Scholar]
- (18).Naumann D. Appl. Spectrosc. Rev. 2001;36(2&3):239–298. [Google Scholar]
- (19).Knauer M, Ivleva NP, Liu X, Niessner R, Haisch C. Anal. Chem. 2010;82:2766–2772. doi: 10.1021/ac902696y. [DOI] [PubMed] [Google Scholar]
- (20).Oust A, Moretro T, Naterstad K, Sockalingum GD, Adt I, Manfait M, Kohler A. Appl. Environ. Microbiol. 2006;72:228–232. doi: 10.1128/AEM.72.1.228-232.2006. [DOI] [PMC free article] [PubMed] [Google Scholar]
- (21).Castellano P, Vignolo G, Farias RN, Arrondo JL, Chehin R. Appl. Environ. Microbiol. 2007;73:415–420. doi: 10.1128/AEM.01293-06. [DOI] [PMC free article] [PubMed] [Google Scholar]
- (22).López-Díez EC, Winder CL, Ashton L, Currie F, Goodacre R. Anal. Chem. 2005;77:2901–2906. doi: 10.1021/ac048147m. [DOI] [PubMed] [Google Scholar]
- (23).Moritz TJ, Taylor DS, Polage CR, Krol DM, Lane SM, Chan JW. Anal. Chem. 2010b;82:2703–2710. doi: 10.1021/ac902351a. [DOI] [PubMed] [Google Scholar]
- (24).Neugebauer U, Schmid U, Baumann K, Ziebuhr W, Kozitskaya S, Holzgrabe U, Schmitt M, Popp J. J. Phys. Chem. A. 2007;111:2898–2906. doi: 10.1021/jp0678397. [DOI] [PubMed] [Google Scholar]
- (25).Wang H, Law N, Pearson G, van Dongen BE, Jarvis RM, Goodacre R, Lloyd JR. J. Bacteriol. 2010;192:1143–1150. doi: 10.1128/JB.01277-09. [DOI] [PMC free article] [PubMed] [Google Scholar]
- (26).Ravindranath SP, Mauer LJ, Deb-Roy C, Irudayaraj J. Anal. Chem. 2009;81:2840–2846. doi: 10.1021/ac802158y. [DOI] [PubMed] [Google Scholar]
- (27).Davis R, Irudayaraj J, Reuhs BL, Mauer LJ. J. Food Sci. 2010;75:M340–M346. doi: 10.1111/j.1750-3841.2010.01686.x. [DOI] [PubMed] [Google Scholar]
- (28).Li J, Huang Y, Ding Y, Yang Z, Li S, Zhou X, Fan F, Zhang W, Zhou Z, Wu D, Ren B, Wang Z, Tian Z. Nature. 2010;464:392–395. doi: 10.1038/nature08907. [DOI] [PubMed] [Google Scholar]
- (29).Kang D-H, Fung DY. J. Food Prot. 1999;62:1346–1349. doi: 10.4315/0362-028x-62.11.1346. [DOI] [PubMed] [Google Scholar]
- (30).Sun T, Powers JR, Tang J. Food Chem. 2007;105:101–106. [Google Scholar]
- (31).Lu X, Al-Qadiri HM, Lin M, Rasco BA. Food Bioprocess Technol. 2011c doi: 10.1007/s11947-011-0516-8, In press. [Google Scholar]
- (32).Mouwen DJM, Weijtens MJBM, Capita R, Alonso-Calleja C, Prieto M. Appl. Environ. Microbiol. 2005;71:4318–4324. doi: 10.1128/AEM.71.8.4318-4324.2005. [DOI] [PMC free article] [PubMed] [Google Scholar]
- (33).Movasaghi Z, Rehman S, Rehman IU. Appl. Spectrosc. Rev. 2007;42:493–541. [Google Scholar]
- (34).Movasaghi Z, Rehman S, Rehman IU. Appl. Spectrosc. Rev. 2008;43:134–179. [Google Scholar]
- (35).Moen B, Oust A, Langsrud O, Dorrell N, Marsden GL, Hinds J, Kohler A, Wren BW, Rudi K. Appl. Environ. Microbiol. 2005;71:2086–2094. doi: 10.1128/AEM.71.4.2086-2094.2005. [DOI] [PMC free article] [PubMed] [Google Scholar]
Associated Data
This section collects any data citations, data availability statements, or supplementary materials included in this article.


