

Abstract
Detailed knowledge of mechanical parameters such as cell elasticity, stiffness of the growth substrate, or traction stresses generated during axonal extensions is essential for understanding the mechanisms that control neuronal growth. Here, we combine atomic force microscopy-based force spectroscopy with fluorescence microscopy to produce systematic, high-resolution elasticity maps for three different types of live neuronal cells: cortical (embryonic rat), embryonic chick dorsal root ganglion, and P-19 (mouse embryonic carcinoma stem cells) neurons. We measure how the stiffness of neurons changes both during neurite outgrowth and upon disruption of microtubules of the cell. We find reversible local stiffening of the cell during growth, and show that the increase in local elastic modulus is primarily due to the formation of microtubules. We also report that cortical and P-19 neurons have similar elasticity maps, with elastic moduli in the range 0.1–2 kPa, with typical average values of 0.4 kPa (P-19) and 0.2 kPa (cortical). In contrast, dorsal root ganglion neurons are stiffer than P-19 and cortical cells, yielding elastic moduli in the range 0.1–8 kPa, with typical average values of 0.9 kPa. Finally, we report no measurable influence of substrate protein coating on cell body elasticity for the three types of neurons.
Introduction
In the developing brain neuronal cells extend neurites (axons and dendrites), which navigate and make connections with other neurons to wire the nervous system. The outgrowth of neurites from the cell body of a neuron is a highly complex process involving interactions with an inhomogeneous and changing extracellular environment (1,2), detection and interpretation of multiple biochemical and geometrical cues (1–6), activation of many different transduction pathways (1,2,7,8), and several types of intracellular polymerization-depolymerization processes (1,7–10). Mechanical interactions and physical stimuli play a key role in many of these processes whether one considers the rearrangements of the cytoskeleton and the generation of traction forces as a result of neurite growth, the adhesion of neurites to extracellular matrix (ECM) proteins, the change in orientation and velocity of the growth cone in response to guidance cues, or the axonal navigation over tissues of varying stiffness (11–15).
Knowledge of various mechanical parameters such as the elastic properties of the cells and the growth substrate, or adhesion forces and traction stresses generated during axonal extensions are therefore essential for a deep understanding of the mechanisms that control neuronal growth and development. For example, recent studies have also shown that substrate stiffness plays an important role in the growth of peripheral dorsal root ganglion (DRG) neurons (16). During neurite outgrowth DRG cells generate relatively large adhesion forces and traction stresses, and they also display a large degree of sensitivity to substrate stiffness, showing maximal outgrowth on substrates with elastic modulus of the order of 1 kPa. It was hypothesized that these strong neurite-substrate mechanical couplings enable DRG neurons to grow very long axons and also to sustain relatively large external forces exerted by the surrounding tissue (16). Other groups have reported that glial cells display maximum growth on even stiffer substrates of the order of several kPa (17–19). In contrast to the mechanical response displayed by DRG neurons and glial cells, primary cortical and spinal cord neurons have been reported to grow well on softer substrates with elastic moduli on the order of a few hundred Pa, comparable to the average stiffness of central nervous system (CNS) tissue (16,18,20). Moreover, several studies have shown that in general, CNS neurons are much less sensitive to substrate stiffness than peripheral neurons or glial cells (16,21). It was argued that this difference in mechanosensitivity between glial cells, cortical neurons, and DRG neurons could play an essential role in the initial structuring of the nervous system (15).
When studying neuronal cells and other constituents of the nervous tissue (glial cells, ECM proteins, etc.) one has to take into account that these are heterogeneous, viscoelastic materials and that their mechanical response depends on the timescale, magnitude, and loading rates of the externally applied forces (13,19,22). Many experimental techniques have been used to measure mechanical responses from cells and growth substrates, including traction force microscopy (16,23), optical and magnetic tweezers (24,25), microneedle pulling (13,26), coated microbeads pulling (27,28) and atomic force microscope (AFM)-based nanoindentation (29–34). The particular capabilities of the AFM, such as nanometer-scale spatial resolution and positioning on the cell surface, high degree of control over the magnitude (sub-nN resolution) and orientation of the applied forces, minimal sample damage, and the ability to image and interact with cells in physiologically relevant conditions make this technique particularly suitable for measuring mechanical properties of living neurons.
Previous studies using AFM or other methods suggest that the mechanisms of neurite outgrowth and cytoskeletal dynamics in response to mechanical properties of the surrounding environment are extremely complex and that different types of neurons respond distinctly to the same physical cues. Furthermore, there is growing evidence that the elastic properties of cells are important for mechanosensitivity and that they are strongly correlated with cellular health, development, and function (15,29,33,35,36). For example, recent AFM measurements have revealed significant quantitative differences between the mechanical properties of cancerous and healthy cells (36). AFM force spectroscopy combined with bulk rheology measurements have shown that CNS glial cells are softer than the surrounding neuronal tissue, suggesting that, at least in certain areas of the CNS glial cells act as a soft shock absorbing tissue, which protects neuronal cells in the case of mechanical trauma (22). Moreover, it was also reported that radial glial cells, along which neuronal cells grow during the initial stages of development, have mechanical properties that vary significantly between different regions of the CNS (15,22,37). Despite the fundamental role played by the interactions between mechanical stimuli and cell elastic properties during neuronal growth and development, currently there are no systematic studies that show how the intrinsic mechanical properties of the neurons change during growth, how the cell elasticity and stiffness vary between different types of neuronal cells, or how the variations in cellular elastic properties are related to differences in the local environment faced by different types of neurons.
To gain new insight into neuronal cell mechanics and outgrowth, the goal of this study was to use combined AFM imaging, AFM force spectroscopy, and fluorescence microscopy to produce systematic, high-resolution elasticity maps for three different types of live neuronal cells: cortical neurons obtained from rat embryos, chick DRG, and neurons derived from P-19 mouse embryonic carcinoma stem cells. These types of neurons are representative for: a), cells that grow in CNS (cortical), which typically interact with soft environments; b), the peripheral nervous system (DRGs), which face stiffer environments; and c), stem cell-derived neurons (P19), which are measured for comparison with the other two cell types. We also measure how the elastic properties of each type of neuronal cell are influenced by the cell interaction with three different growth factors: poly-D-lysine (PDL), laminin (LN), and fibronectin (FN). Furthermore, by taking advantage of the ability of AFM to both image and apply controllable forces to live cells over time, we monitor how the dynamics of axonal growth affects the stiffness maps of neuronal cell bodies, and how the cell stiffness changes upon chemical modification (disruption of microtubules) of the cell. We present the first, to our knowledge, use of AFM elasticity mapping to monitor differences in neuronal cell body elasticity over time, resolving internal changes to live and healthy cells due to neurite extension and drug response. We also find support for DRG neurons interacting with their surrounding environment via larger forces and stresses than cortical cells.
Materials and Methods
Surface preparation, cell culture, and plating
Cells were cultured on 3.5 cm glass disks designed to fit in the Asylum Research Bioheater fluid cell (Asylum Research, Santa Barbara, CA). PDL (Sigma-Aldrich, St. Louis, MO) coated plates were made by immersing the disks in a PDL solution (0.1 mg/ml) for 2 h at room temperature. The plates were rinsed twice with sterile water and sterilized using ultraviolet light for ≥30 min. AFM disks were similarly coated with LN or FN. LN plates were coated with 50 μg/ml natural mouse LN (Life Technologies, Grand Island, NY) solution in buffered saline for 1 h at 37°C. FN coated plates used a 0.1 mg/ml bovine plasma FN (Life Technologies) solution in buffered saline for 2 h at 37°C.
DRG (surgically isolated from day 9 chick embryos), rat cortical neurons (obtained from embryonic day 18 rats), and P-19 neurons (obtained from mouse teratocarcinoma stem cells) were plated and incubated following standard procedures (See Text S1 in the Supporting Material for details). For all cell types, immunostaining experiments have indicated cultures of high neuron purity (see Fig. S1 for details).
Force map acquisition and data analysis
Force Maps were taken using an MFP3D AFM (Asylum Research) with an inverted Nikon Eclipse Ti optical microscope (Micro Video Instruments, Avon, MA). The samples were mounted in an Asylum Research Bioheater chamber with cell culture medium and maintained at 37°C during all experiments. All measurements were taken using Olympus Biolever cantilevers (Asylum Research) with a nominal spring constant of .03 N/m. Before measurement on a new sample, each cantilever was calibrated both in air and in the sample medium. 16 × 16 μm maps of individual force versus indentation curves were taken on each cell with a resolution of 1 μm between points (See Text S2 in the Supporting Material for details).
The elastic modulus values were determined by fitting the Hertz model for a 30° conical indenter to the acquired force versus. indentation curves using the Asylum Research MFP-3D Hertz analysis tools (See Text S2 in the Supporting Material for additional details). These values can be combined with surface height information to produce a topographical rendering with elastic modulus values mapped on the surface (see Fig. 1 a).
Figure 1.
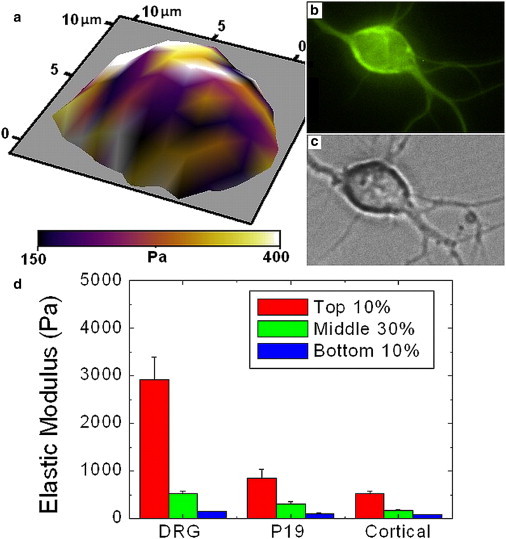
(a) Three-dimensional topographical rendering of live cortical neuron body with color/shade indicating elastic modulus (Pa). (b) Optical fluorescence image of cell is shown in (a) stained for microtubules with 50 nM Tubulin Tracker Green. (c) Bright field optical image of cell shown in a and b. (d) Averages overall highest values (top 10%), medium values (middle 30%), and lowest values (bottom 10%) obtained from individual force maps of chick DRG, mouse P-19, and rat cortical neurons. Error bars represent standard deviation of the mean. Cortical and P-19 somas present significantly different highest, medium, and lowest values from DRGs (p ≤ 0.001 one-way ANOVA). All cells were measured in the passive (no neurite extension) state (see text).
For the cell type and surface coating data (see Fig. 1 and Fig. 2), each map was characterized by three values. The top 10% of elastic modulus values measured on an individual cell were averaged to obtain the Top 10% (henceforth referred to as the highest values) for that cell. The middle 30% of values from that same cell were averaged to obtain the value for Middle 30% for that cell (henceforth referred to as medium values). Finally, the lowest 10% of values were averaged to obtain the Bottom 10% (referred to as lowest values). These three values allow a simple way to compare stiffness between maps of different cells (see Fig. S2 for additional details). A typical force point has a fitting error of ≤ 20% and is typically repeatable to within this error. For the cell type comparison graph (see Fig. 1 d), the highest, medium, and lowest values for all cells of each type were averaged. The error bars represent the standard deviation of the mean. For the cell dynamics and drug study data, each map was characterized by a histogram of all points measured over the cell body. Each histogram was binned into groups of 200 Pa/bin. Because each map varies slightly in the total number of points taken above the cell, these histograms were plotted as the percent of total measured map points per bin rather than total number of points. In this way the stiffness distributions of two different maps of the same cell with a slightly different total number of points may be directly compared.
Figure 2.
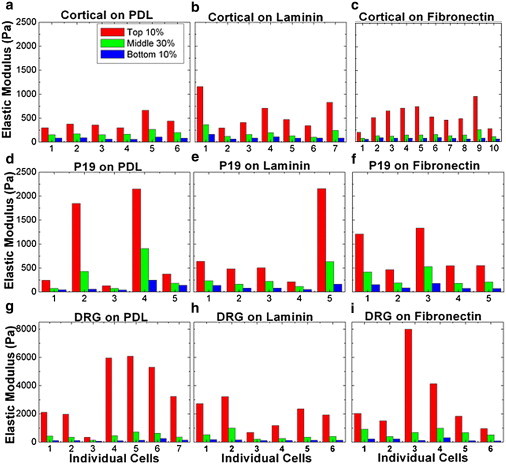
Elastic modulus values measured by AFM for individual cells (average of top 10% of values for each cell, average of middle 30% of values for each cell, and average of lowest 10% of values for each cell). The x axis denotes individual cells. (a–c) Cortical neurons on (a) PDL, (b) LN, and (c) FN. (d–f). P-19 neurons on PDL, LN, or FN, respectively. (g–i) DRG neurons on PDL, LN, or FN, respectively. All cells were measured in the passive (no neurite extension) state (see text).
All measured cells from all three types (cortical, P19, and DRG) had similar soma size, with an average diameter of (13 ± 4) μm.
Fluorescence microscopy
Two types of fluorescent dyes were used in this study. For microtubule staining, the live cortical samples were rinsed with phosphate buffered saline (PBS) and then incubated at 37°C with 50 nM Tubulin Tracker Green (Oregon Green 488 Taxol, bis-Acetate) (Life Technologies) in PBS. The samples were then rinsed twice and transferred to the AFM Bioheater chamber and maintained at 37°C, whereas bright field and fluorescence images (using a standard Fluorescein isothiocyanate - filter: excitation/emission of 495 nm/521 nm) were taken before and after each AFM elasticity map. All cells were measured within the first 2 h on the AFM stage.
For F-actin staining, each set of live cortical cells was optically located on the premarked surface, and force maps were acquired for a small number (2,3) of cells. Immediately after the last map was taken, the sample was removed from the AFM stage and fixed in 10% Formalin for 15 min. The sample was then rinsed twice with PBS and permeabilized for 10 min with 0.1% Triton-100 (Sigma-Aldrich) in PBS (Life Technologies). The sample was then incubated at room temperature for 20 min in 50 μM Alexa Fluor 564 Phalloidin (Life Technologies), and rinsed with PBS. The same cells mapped via AFM were relocated optically using the sample marking and imaged fluorescently using a standard Texas Red (excitation/emission of 596/615) filter.
Results
Comparison between DRG, P-19 derived, and cortical neurons
Force maps were performed on cultures of each neuronal cell type, with a minimum of 15 cells examined in each data set to provide statistical significance for our results. For each cell we define an average highest, medium, and lowest value for the elastic modulus, which allows us a simple way to compare stiffness between maps of different cells (see Force Map acquisition and data analysis section, and Fig. S2). Fig. 1 d shows that the average highest, medium, and lowest elasticity values for the P-19-derived neurons are similar to those obtained on cortical neurons despite the large morphological variation present in the P-19-derived neuronal cells. P-19 neurons (15 individual cells) yield an average highest value for the elastic modulus of (854 ± 181) Pa, compared with (521 ± 52) Pa for cortical neurons (24 individual cells). Similarly, the respective average value for the medium stiffness region is (301 ± 61) Pa for P-19 and (163 ± 15) Pa for cortical, and the average values for the lowest stiffness region are (104 ± 15) Pa (P-19) and (82 ± 5) Pa (cortical). All uncertainties in the values quoted here and in the following sections are standard deviations of the mean. All measured highest, medium, and lowest values of elastic moduli for cortical neurons fall in the range of the corresponding values measured on P-19s (with a significantly larger standard deviation of the mean present in the P19 sample set). These results support previous studies that indicate P-19-derived neurons exhibit some measureable characteristics of cortical region cells (32,38).
DRG neurons yield significantly stiffer highest and medium elasticity values than P-19 or cortical neurons (Fig. 1 d). DRGs (19 individual cells) yield an average highest stiffness of (2920 ± 480) Pa, an average value for the medium stiffness region of (524 ± 58) Pa, and an average lowest stiffness of (144 ± 15) Pa (typical average value for the entire cell being ∼900 Pa). These values are significantly different than the respective measured values for P-19 and cortical neurons (p ≤ 0.001, one-way ANOVA). The average values yielded by the DRG neurons also fall around the range of the optimal substrate stiffness for DRG growth (1000 Pa) (16) indicating a possible stiffness match between cell body and optimal growth environment. The lowest stiffness values of the DRGs are very close to the corresponding lowest values of the generally much softer P-19 and cortical neurons. The regions of the cells corresponding to these values likely correlate to some similar soft internal components, such as fluid components of the cytoplasm.
Effect of surface coating on cell body elasticity
Many reports have shown that surfaces coated with different types of growth factors or ECM proteins can produce very different growth and adhesion dynamics for neuronal cells (1,28,39). Here, we explore the effects of surface coating on the biomechanical properties of neuronal cells. Specifically, we take 1 μm resolution elasticity maps of P-19, cortical, and DRG neurons plated on glass disks, each coated respectively with LN, FN, and PDL. These are the most common types of proteins used in literature for in vitro neuronal culture. Fig. 2 shows the elastic modulus data collected for all the three cell types and surface coatings. All measured neuron types: cortical (Fig. 2, a–c), P-19 (Fig. 2, d–f), and DRG (Fig. 2 g–i) display significant variations in stiffness values among individual cells. For each cell type these cell-to-cell variations in stiffness are larger than the measured variations due to surface coating. One-way ANOVA tests (see Table S1) indicates no measureable correlation between variation in elasticity values and surface coating for the majority of combinations of neuronal cell type and surface coatings. In addition, for each cell type we have calculated cumulative distributions of measured elastic moduli for individual cells (see Fig. S2 b), as well as average cumulative distributions for each surface (Fig S2, c and d). These data show that the variations among average cumulative distributions for each surface are smaller than the calculated standard deviations (see Fig S2), further confirming a low probability for an effect due to surface coating outside one standard deviation.
Cytoskeletal dynamics measured by combined AFM and fluorescence microscopy
In an effort to better understand the regions of high stiffness on cortical neurons we used combined AFM and fluorescence microscopy to monitor the dynamics of these regions and characterize their underlying components. We have chosen cortical neurons to perform dynamics and fluorescence studies because this cell type has reproducibly shown both active and passive growth states (defined in the next section). To verify map consistency a number of N = 6 cells that underwent no neurite growth were mapped multiple times (between 20 min and 2 h apart). Average elastic modulus values for a given cell yielded consistent values, with cell-wide elastic modulus averages agreeing within 86% (see Fig. S3).
Effects of neurite length extension on cell body elasticity for cortical neurons
Living cortical neurons on PDL coated glass disks were mounted in the AFM's temperature-controlled Bioheater chamber on the second day after plating. The neurite extensions from these cells were observed in one of two primary states: an active state, where the growth cone was changing location and the neurite increased significantly in length (> 5 μm) (compare Fig. 3, a and b), or a passive state, where the growth cone was not observably active and the neurite length remained constant (compare Fig. 3, c and d). Neurites were seen to transition, over the course of 30 min to an hour, between passive and active states. To monitor the changes in cell body elasticity due to active neurite extension, elasticity maps were taken in succession (∼15 min for each map) on a given cell both before and during (or during and after) a phase of active neurite growth. Neurite extension was determined from the optical images of the cell taken before (Fig. 3, a and c), and after (Fig. 3, b and d), the acquisition of the force maps.
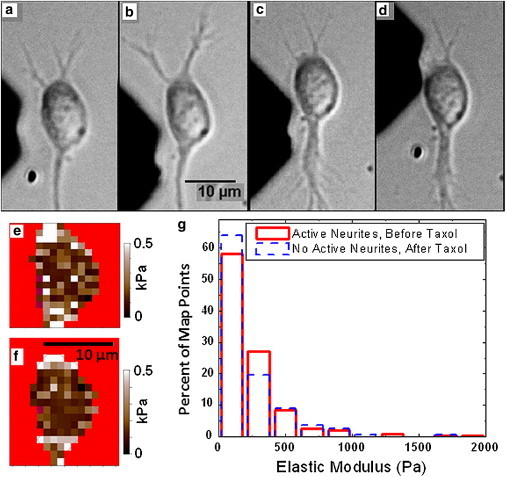
Figure 3.
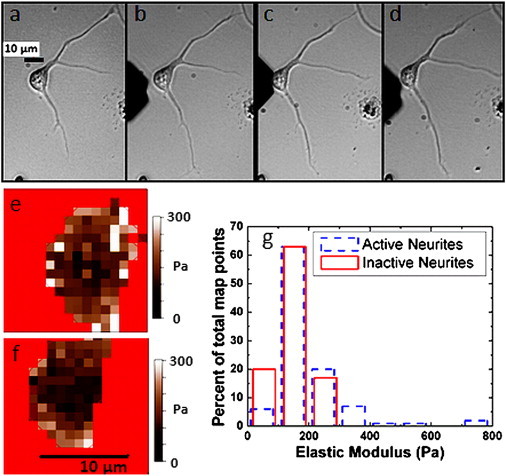
(a and b) Optical images before (a) and after (b) force measurements of a live cortical neuron undergoing active neurite extension during 15 min force-map acquisition (i.e., change in growth cone position and morphology for the top neurite, increased in length for the bottom neurite). (c and d) Optical images before (c) and after (d) force measurements of the same live cortical neuron at a later time not undergoing active neurite extension (passive phase). Scale bar shown in (a) is the same for all images (a–d). (e) Elasticity map for the active extension phase shown in (a and b). (f) Elasticity map for the passive phase shown in (c and d). Scale bar shown in e is the same for both maps. (g) Histogram of percent of total map points in each elastic modulus bin (see Materials and Methods). Dashed line: data for active extension state. Solid line: data for the passive state. The average elastic modulus value increases by 35% during growth. Similar results were obtained on four additional cells.
During the active neurite extension phase we have measured an overall increase in the average values of the elastic modulus across the entire soma between 23% and 175%. In all cases (N = 5 cells) the largest increase in stiffness (accounting for >75% of the observed overall increase) was found in those regions of the cell body located in the proximity of the active neurite junction. Interestingly, after the active phase ended (typically in <1 h) the stiffness of these regions decreased to the initial values displayed before the neurite extension started. This phenomenon is illustrated in Fig. 3. Fig. 3 a shows a cell that undergoes neurite extension with an active growth cone region, monitored via optical microscopy. Over the course of 15 min (duration of the force map acquisition) the cell shows a minor change in growth cone location for the top neurite, and a substantial increase in neurite length for the bottom neurite (compare Fig. 3 a and Fig. 3 b). The force map (Fig. 3 e) and the histogram of elastic modulus (Fig. 3 g, dash line) are compared with those measured on the same cell (Fig. 3, f and g, solid line), during a subsequent phase of no growth. Fig. 3, c and d, display optical images of this later phase, where the neurites exhibit no visibly active growth cone and no neurite length extension over the course of the force map. Overall, we see a significant stiffening of the area local to the neurite junction during neurite outgrowth (Fig. 3 e) as compared to the stiffness map during no extension (Fig. 3 f). We also see a general shift in the histogram plot (Fig. 3 g) toward stiffer values during neurite extension, with an increase in the highest value measured, as well as number of stiff points at or above 400 Pa. The average overall measured values of elastic moduli on the cell shifts from (192 ± 11) Pa during extension, down to (142 ± 6) Pa during the subsequent passive phase. This global value shift of over 30% is well above the typical ≤14% variation in the average of the elastic modulus for a nongrowing cell between two subsequent maps (see Fig. S3). Similar results were obtained for all the cells that exhibited active growth during force map acquisition (N = 5 cells, see Fig. S4 for an additional example).
Effect of Taxol and Nocodazole on cell body elasticity
Taxol is a well-studied drug with known microtubule stabilizing effects in neurons (40,41). By mapping the elasticity of live neuronal cell bodies before and after the addition of Taxol, we were able to determine the effect of microtubule stabilization on live cell body elasticity. We performed elasticity maps on live cells at 37°C, and then exchanged the cell media with new media containing Taxol at a concentration of 10 μM. The cells were then incubated in the new media for a minimum of 20 min, and the new elasticity maps were performed on the same cells as before.
Fig. 4, a and c, show respectively optical and force map images of a cell in the passive state (no neurite extension) before the addition of Taxol, whereas Fig. 4, b and d, show the corresponding images of the same cell after a 90 min incubation in media containing 10 μM Taxol. The cell undergoes both an overall increase in global stiffness, and a clear increase in stiffness local to the neurite junction. The histogram in Fig. 4 e shows an increase in both the highest stiffness measured, and number of points with elastic moduli above 400 Pa. The average value for the elastic modulus on the cell increases by >30% (from 229 ± 35 Pa, pre-Taxol, with no neurite extension, up to 304 ± 43 Pa after Taxol). A similar effect was observed on three additional cells, with an increase in average elasticity ranging from 33% to 180% (see Fig. S5).
Figure 4.
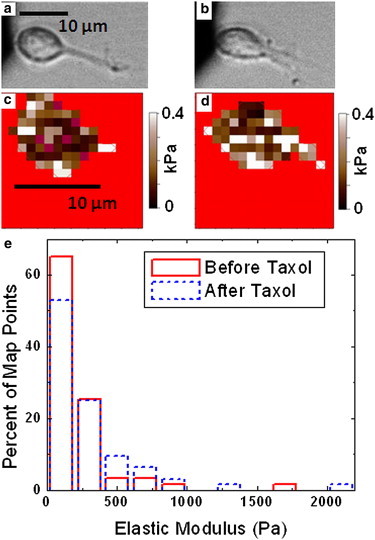
(a) Optical image of a live cortical neuron, which is not undergoing neurite extension. (b) Optical image of the same cell as in a shown 90 min after addition of 10 μM Taxol. Scale bar is the same for a and b. (c and d) Elasticity maps for cell shown in a and b, respectively. (e) Histogram of percent of map points in each elastic modulus bin (see Materials and Methods) for the maps shown in c (solid line) and d (dashed line). Scale bar same for both maps. The average elastic modulus value increases by 33% after the addition of Taxol. Similar results seen on three additional cells (see the Supporting Material).
We have also used the drug Nocodazole in an attempt to measurably disrupt the microtubules of the cell and the process of neuritogenesis. We used a similar procedure as that with Taxol but flushed the chamber instead with 10 nM nocodazole (Sigma-Aldrich) in media. The results indicated that cells subjected to 10 nM nocodazole died with a substantially increased rate (6 out of 8 cells), and the surviving cells showed no marked decrease in cell body stiffness (See Fig. S6). This is consistent with findings in the literature, which indicate that although nocodazole disrupts neuritogenesis and increases cell mortality, it does not measurably decrease microtubule aggregations present in the cell soma (42).
Stiffening by neurite extension versus Taxol addition
The addition of Taxol to live cortical neurons yields a similar pattern and magnitude of stiffening to that of active neurite extension. To further investigate this similarity, we compared the results of elasticity maps of untreated cells during active growth to those of the same cells after incubation with 10 μM Taxol. Fig. 5, a and b, show active growth in the observed cell during map acquisition before the addition of Taxol. Two maps were taken on this cell during active extension (one of which is shown in Fig. 5 e), and another two maps were taken after the addition of Taxol (one of which is shown in Fig. 5 f). The data from the two elastic maps acquired during neurite extension were combined to produce the extension data set (Fig. 5 g, solid line), and the two Taxol maps were combined to produce the Taxol data set (Fig. 5 g, dashed line). We note that in both elasticity maps (Fig. 5, e and f), there is a similar distinctive high stiffness region local to the neurite extension, despite the clear lack of active extension during the Taxol maps (Fig. 5, c and d). We note further that the histograms show a similar maximum stiffness value, as well as a similar number of measured points at or above 400 Pa. Additionally, the average elastic modulus for the neurite extension maps is (255 ± 18) Pa, which falls nearly identical to the average elastic modulus for the Taxol maps of (247 ± 16) Pa.
Figure 5.
(a and b) Optical images of a live cortical neuron undergoing active neurite extension before the addition of Taxol; (a) shows the neuron before and (b) after the force measurements shown in e; the upper neurite shows length extension during map acquisition (15 min). (c and d) optical images of the same cortical neuron shown in a and b taken after the addition of 10 μM Taxol and incubation of 20 min. (c) Displays the neuron before and (d) after the measurements shown in f. Scale bar shown in b is the same for all images (a–d). (e) Elasticity map for the case shown in a and b; (f) Elasticity map for the case shown in c and d. (g) Histogram of percent of total points in each elastic modulus bin (see Materials and Methods) for maps taken on the cell shown in a–d. Solid line: data from two separate elastic maps acquired during neurite extension. Dashed line: data from two separate elastic maps acquired after addition of Taxol (both maps were measured >20 min after exposing the cell to Taxol). Average elastic modulus values between maps (e and f) differ by only 3%.
Identification of measured intracellular components by combined AFM and fluorescence microscopy
We have shown that active neurite extension in cortical neurons increases the measured elasticity in live neuronal cells near the active neurite junction, and further that this increase in elasticity is closely mirrored by the elasticity increase caused by the addition of the microtubule stabilizing drug Taxol. To further investigate these effects, we correlated AFM elasticity maps of living and fixed cortical neurons to fluorescence maps indicating regions of high microtubule or F-actin concentration. Fig.6 a shows a live cortical neuron stained for microtubule concentration. The image shows high microtubule concentration (i.e., high fluorescence intensity) along the top of the cell, as well as a significant aggregation local to the right-hand neurite junction. Fig. 6 b shows the AFM acquired elasticity map of this same cell immediately after the optical image acquisition. We see a direct matching between the regions of high elastic modulus (light areas) on the elasticity map, and the regions of high microtubule density observed through fluorescence. Similar correlations are seen for all cells stained for microtubules (N = 6 cells, see Fig. 1, a and b, and Fig. S7 for additional examples).
Figure 6.
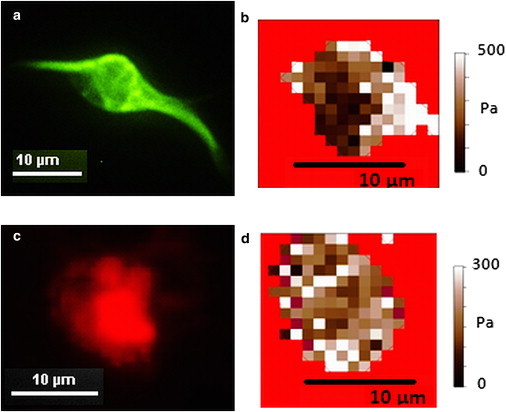
(a) Fluorescein isothiocyanate fluorescence image of live cortical cell stained for microtubules with 50 nM Tubulin Tracker Green. (b) Elasticity map of cell shown in a. The cell regions with high microtubule concentration (bright areas) in a correspond to the high stiffness regions shown in b. Similar correlations were obtained for five additional cells (see Fig. 1, a and b, and Fig S7). (c) Texas Red fluorescence image of cortical cell after being fixed and stained for F-actin with Alexa Fluor 564 Phalloidin. (d) Elasticity map of cell shown in c before fixing. There is no correlation between the cell regions with high actin concentration (bright regions in c) and the cell regions that display high stiffness in (d). Similar results were obtained in four additional cells (see Fig S7).
Fig. 6 c shows a fixed cortical neuron stained for F-actin. We see in this image a bundle of higher density F-actin covering the majority of the lower right region of the cell. Fig. 6 d shows the elasticity map of this same cell still alive after elastic mapping and directly before (<20 min) fixing, showing, as in previous maps, regions of higher and lower elastic modulus. We note that the concentrated distribution of actin in the lower right of the body does not correspond to the regions of high stiffness in the elasticity map. Additionally, many high stiffness regions are seen in areas of the cell where F-actin aggregation is low. Similar results were obtained for all cells stained for actin (N = 4 cells, see also Fig. S7).
Finally, to determine if the increase in stiffness of the cell body during neurite extension corresponds to an increase in axonal tension, we acquired elasticity maps of cells before and after active neurite growth in media containing 10 μM Blebbistatin (see Fig. S8). Blebbistatin is a well-known inhibitor of nonmuscle myosin II, which was shown to dramatically reduce traction forces and axonal tension (16). In our experiments, all cells (N = 3) that grow in the presence of Blebbistatin display an increase in stiffness between 30% and 55% during growth, with most stiffening regions occurring above 400 Pa. This increase is the same as the median change in stiffness values measured for cells that display active growth in the absence of Blebbistatin (see Fig. 3), which further indicates that microtubule aggregation (and not axonal tension) is primarily responsible for the observed stiffening during cell growth in our experiments. Our data also show that Blebbistatin does not significantly affect the cell stiffness in the passive (no-growth) state, or the aggregation of microtubules (see Fig. S9).
Discussion
We have shown the first, to our knowledge, direct comparison between elasticity maps on rat cortical, mouse P-19-derived, and chick DRG neurons. The overlap between elasticity values measured on P-19-derived and cortical neuron cell bodies (Fig. 1) yields additional evidence that P-19-derived neuronal cells are a good model system for cortical type neurons (38).
The difference in elasticity values of DRG neurons versus cortical neurons (Fig. 1) is interesting in the context of their native environments. Cortical cells live in one of the softest tissue environments in the body, with bulk tissue modulus values reaching only a few hundred Pa (18,30,43). DRG neurons, in contrast, originate in nerve bundles along the spinal column, existing in and interacting with an environment both stiffer and more varied than the weak and relatively mechanically homogeneous cortex. The spinal column itself, for example, has shown bulk modulus values for different systems of the order of 10 kPa (43). The mechanical stiffness of a cell and its ability to generate forces are linked inexorably with the ability to manipulate or sense stiffness within that environment. A cell required to sense and function in a very weak and relatively homogeneous environment need not have the mechanical rigidity to sense and manipulate substantially stiffer surfaces. Koch et al. (16) have shown that the growth cones on hippocampal neurons generate extremely weak traction forces, and are insensitive to increases in substrate rigidity of 150 Pa and above. They have also shown that DRG neurons generate vastly larger traction forces than do hippocampal neurons, and are most sensitive to substrate stiffness in the range of 0.45–3 KPa (16).
We find it very relevant to this discussion that the DRGs, which generate larger traction forces and must sense and manipulate a stiff and varied environment, are stiffer than the weakly interacting and mechanically insensitive neurons from the brain. It is also important to note that the DRGs are particularly sensitive to substrate stiffness changes within the range of elasticity values reflected in their own elasticity maps. The maximum sensitivity range established by Koch and collaborators (16) of 0.45–3 KPa (with a particularly dramatic jump in preference between 450 and 1000 Pa) aligns well with our medium (0.5 KPa) and highest (2.9 KPa) values measured on the elasticity maps of DRG neuronal bodies (Fig. 1) as well as the typical soma average of 0.9 Pa.
We have additionally observed that all three types of neuronal cells show similar elasticity distributions (within one standard deviation) when plated on PDL, FN, or LN coated glass. This finding is of particular importance, as the role of matrix molecules on cell adhesion, propagation, and differentiation is a robust area of study. Cell-matrix interactions are usually mediated by integrin-specific ligands that upregulate various pathways involved in cell responses to surfaces. Our data rule out large-scale effects on the cell body elasticity for the three types of substrate studied here. However, because our data show sizeable fluctuations in the measured elastic moduli due to cell-to-cell variation, we cannot exclude smaller scale effects of the substrate coating on the cell elasticity. We note that further studies of cell elasticity on various substrates could provide an important discriminator for comparing changes in cell propagation (e.g., via biochemical mediators) versus changes in cell mechanics (e.g., demonstrated here via microtubule disruptors). Elucidating the roles of different inputs to nerve cell functions could also provide critical control points for future modes to direct the process in selective ways.
We also present the first, to our knowledge, use of AFM elasticity mapping to monitor differences in neuronal cell body elasticity over time, showing its power to resolve changes internal to live and healthy cells due to neurite extension and drug response. Additionally, we use the unique power of combined AFM and fluorescence microscopy to analyze the internal cellular components responsible for these changes. Specifically, we have identified the areas of high elastic modulus measured in the cell bodies of cortical neurons as areas of high microtubule density rather than concentrated regions of F-actin (Fig. 1, Fig. 6, and Fig. S7). We have shown that the addition of Taxol to a live cell increases the stiffness in these areas to a degree easily measureable by AFM elasticity mapping (Fig. 4, Fig. 5, and Fig. S5) further identifying and confirming the active effect of Taxol on microtubules in live neurons. We have additionally discovered a dynamic and reversible stiffening of the cell body local to neurite junctions in response to active neurite extension (Fig. 3, Fig. S4). This stiffening effect has been shown to be of comparable magnitude to changes induced by the addition of Taxol (Fig. 5), and by our fluorescence results (Fig. 1, Fig. 6, and Fig. S7) we can identify these significant increases in stiffness as due to microtubule dynamics rather than changes in F-actin concentration. In addition, cell treatment with Nocodazole (a drug known to disrupt neuritogenesis, but does not measurably decrease microtubule aggregations in the cell soma), and Blebbistatin (known to dramatically reduce tension forces generated during axonal elongation) show no significant effect on the elasticity maps of the cells. Furthermore, Blebbistatin does not reduce the stiffening effect observed during growth, further supporting our conclusion that microtubules are primarily responsible for the observed increase in stiffness in our experiments. These results are supported by current axonal growth models, which show that microtubules have major roles in the process of axonal extension. These models show that although actin filaments are remodeled very fast in response to guidance cues, axons cannot move forward without the steering and mechanical stabilization induced by microtubules (1,44). In particular, we associate the local increase in stiffness near the area of neurite extension to the formation of quasistable bundles of microtubules that enter the axonal shaft. The decrease in stiffness observed after the extension phase suggest a depolymerization of these microtubule structures, at least in the case when neurons do not form functional connections with nearby cells. Additional biochemical and mechanical studies, especially on cells that form functional connections, would help to expand our understanding of the either distinctive or synergistic roles of these various cytoskeletal inputs to mechanics as studied here.
Our findings also suggest new strategies to consider with regard to directing nerve cell growth in two-dimensional and three-dimensional systems. For example, gradient biomaterials where mechanics, ECM factors, and cytoskeletal disruption factors, are appropriately positioned may provide improved directionality of nerve cells. This directionality could go beyond that currently achieved through surface patterning or macroscale gradients with nerve growth factors. Monitoring the mechanics of the cells in response to such treatments may also provide real-time information regarding nerve cell responses to selective chemicals and toxicants.
Acknowledgments
The authors thank Amy Hopkins and Dr. Min Tang-Schomer for their assistance and technical guidance on the methods. We thank Gregory Frost and Dr. Steve Moss' laboratory at the Tufts Center of Neuroscience for providing embryonic rat brain tissues. We also thank Prof. Leon Gunther and Prof. Tim Atherton (Tufts Physics) for useful discussions.
This work was supported by the National Science Foundation (grant CBET 1067093), by the Tufts Collaborates Seed Grant, and the National Institutes of Health (grants AR005593 and EB002520).
Supporting Material
References
- 1.Lowery L.A., Van Vactor D. The trip of the tip: understanding the growth cone machinery. Nat. Rev. Mol. Cell Biol. 2009;10:332–343. doi: 10.1038/nrm2679. [DOI] [PMC free article] [PubMed] [Google Scholar]
- 2.Wen Z., Zheng J.Q. Directional guidance of nerve growth cones. Curr. Opin. Neurobiol. 2006;16:52–58. doi: 10.1016/j.conb.2005.12.005. [DOI] [PubMed] [Google Scholar]
- 3.Huber A.B., Kolodkin A.L., Cloutier J.F. Signaling at the growth cone: ligand-receptor complexes and the control of axon growth and guidance. Annu. Rev. Neurosci. 2003;26:509–563. doi: 10.1146/annurev.neuro.26.010302.081139. [DOI] [PubMed] [Google Scholar]
- 4.Staii C., Viesselmann C., Eriksson M.A. Positioning and guidance of neurons on gold surfaces by directed assembly of proteins using Atomic Force Microscopy. Biomaterials. 2009;30:3397–3404. doi: 10.1016/j.biomaterials.2009.03.027. [DOI] [PubMed] [Google Scholar]
- 5.Staii C., Viesselmann C., Eriksson M.A. Distance dependence of neuronal growth on nanopatterned gold surfaces. Langmuir. 2011;27:233–239. doi: 10.1021/la102331x. [DOI] [PubMed] [Google Scholar]
- 6.Rosoff W.J., Urbach J.S., Goodhill G.J. A new chemotaxis assay shows the extreme sensitivity of axons to molecular gradients. Nat. Neurosci. 2004;7:678–682. doi: 10.1038/nn1259. [DOI] [PubMed] [Google Scholar]
- 7.Dent E.W., Gertler F.B. Cytoskeletal dynamics and transport in growth cone motility and axon guidance. Neuron. 2003;40:209–227. doi: 10.1016/s0896-6273(03)00633-0. [DOI] [PubMed] [Google Scholar]
- 8.Dickson B.J. Molecular mechanisms of axon guidance. Science. 2002;298:1959–1964. doi: 10.1126/science.1072165. [DOI] [PubMed] [Google Scholar]
- 9.Geraldo S., Gordon-Weeks P.R. Cytoskeletal dynamics in growth-cone steering. J. Cell Sci. 2009;122:3595–3604. doi: 10.1242/jcs.042309. [DOI] [PMC free article] [PubMed] [Google Scholar]
- 10.Brown A. Slow axonal transport: stop and go traffic in the axon. Nat. Rev. Mol. Cell Biol. 2000;1:153–156. doi: 10.1038/35040102. [DOI] [PubMed] [Google Scholar]
- 11.Francisco H., Yellen B.B., Gallo G. Regulation of axon guidance and extension by three-dimensional constraints. Biomaterials. 2007;28:3398–3407. doi: 10.1016/j.biomaterials.2007.04.015. [DOI] [PMC free article] [PubMed] [Google Scholar]
- 12.Lamoureux P., Ruthel G., Heidemann S.R. Mechanical tension can specify axonal fate in hippocampal neurons. J. Cell Biol. 2002;159:499–508. doi: 10.1083/jcb.200207174. [DOI] [PMC free article] [PubMed] [Google Scholar]
- 13.O'Toole M., Lamoureux P., Miller K.E. A physical model of axonal elongation: force, viscosity, and adhesions govern the mode of outgrowth. Biophys. J. 2008;94:2610–2620. doi: 10.1529/biophysj.107.117424. [DOI] [PMC free article] [PubMed] [Google Scholar]
- 14.Franze K., Gerdelmann J., Käs J. Neurite branch retraction is caused by a threshold-dependent mechanical impact. Biophys. J. 2009;97:1883–1890. doi: 10.1016/j.bpj.2009.07.033. [DOI] [PMC free article] [PubMed] [Google Scholar]
- 15.Franze K., Guck J. The biophysics of neuronal growth. Rep. Prog. Phys. 2010;73:094601. [Google Scholar]
- 16.Koch D., Rosoff W.J., Urbach J.S. Strength in the periphery: growth cone biomechanics and substrate rigidity response in peripheral and central nervous system neurons. Biophys. J. 2012;102:452–460. doi: 10.1016/j.bpj.2011.12.025. [DOI] [PMC free article] [PubMed] [Google Scholar]
- 17.Moshayedi P., Costa Lda. F., Franze K. Mechanosensitivity of astrocytes on optimized polyacrylamide gels analyzed by quantitative morphometry. J. Phys. Condens. Matter. 2010;22:194114. doi: 10.1088/0953-8984/22/19/194114. [DOI] [PubMed] [Google Scholar]
- 18.Georges P.C., Miller W.J., Janmey P.A. Matrices with compliance comparable to that of brain tissue select neuronal over glial growth in mixed cortical cultures. Biophys. J. 2006;90:3012–3018. doi: 10.1529/biophysj.105.073114. [DOI] [PMC free article] [PubMed] [Google Scholar]
- 19.Gefen A., Margulies S.S. Are in vivo and in situ brain tissues mechanically similar? J. Biomech. 2004;37:1339–1352. doi: 10.1016/j.jbiomech.2003.12.032. [DOI] [PubMed] [Google Scholar]
- 20.Flanagan L.A., Ju Y.E., Janmey P.A. Neurite branching on deformable substrates. Neuroreport. 2002;13:2411–2415. doi: 10.1097/01.wnr.0000048003.96487.97. [DOI] [PMC free article] [PubMed] [Google Scholar]
- 21.Norman L.L., Aranda-Espinoza H. Cortical neuron outgrowth is insensitive to substrate stiffness. Cell. Mol. Bioeng. 2010;3:398–414. [Google Scholar]
- 22.Lu Y.B., Franze K., Reichenbach A. Viscoelastic properties of individual glial cells and neurons in the CNS. Proc. Natl. Acad. Sci. USA. 2006;103:17759–17764. doi: 10.1073/pnas.0606150103. [DOI] [PMC free article] [PubMed] [Google Scholar]
- 23.Sabass B., Gardel M.L., Schwarz U.S. High resolution traction force microscopy based on experimental and computational advances. Biophys. J. 2008;94:207–220. doi: 10.1529/biophysj.107.113670. [DOI] [PMC free article] [PubMed] [Google Scholar]
- 24.Dai J., Sheetz M.P. Mechanical properties of neuronal growth cone membranes studied by tether formation with laser optical tweezers. Biophys. J. 1995;68:988–996. doi: 10.1016/S0006-3495(95)80274-2. [DOI] [PMC free article] [PubMed] [Google Scholar]
- 25.Bausch A.R., Möller W., Sackmann E. Measurement of local viscoelasticity and forces in living cells by magnetic tweezers. Biophys. J. 1999;76:573–579. doi: 10.1016/S0006-3495(99)77225-5. [DOI] [PMC free article] [PubMed] [Google Scholar]
- 26.Bernal R., Pullarkat P.A., Melo F. Mechanical properties of axons. Phys. Rev. Lett. 2007;99:018301. doi: 10.1103/PhysRevLett.99.018301. [DOI] [PubMed] [Google Scholar]
- 27.Fass J.N., Odde D.J. Tensile force-dependent neurite elicitation via anti-beta1 integrin antibody-coated magnetic beads. Biophys. J. 2003;85:623–636. doi: 10.1016/S0006-3495(03)74506-8. [DOI] [PMC free article] [PubMed] [Google Scholar]
- 28.Smith C.L. Cytoskeletal movements and substrate interactions during initiation of neurite outgrowth by sympathetic neurons in vitro. J. Neurosci. 1994;14:384–398. doi: 10.1523/JNEUROSCI.14-01-00384.1994. [DOI] [PMC free article] [PubMed] [Google Scholar]
- 29.Mustata M., Ritchie K., McNally H.A. Neuronal elasticity as measured by atomic force microscopy. J. Neurosci. Methods. 2010;186:35–41. doi: 10.1016/j.jneumeth.2009.10.021. [DOI] [PubMed] [Google Scholar]
- 30.Elkin B.S., Azeloglu E.U., Morrison B., 3rd Mechanical heterogeneity of the rat hippocampus measured by atomic force microscope indentation. J. Neurotrauma. 2007;24:812–822. doi: 10.1089/neu.2006.0169. [DOI] [PubMed] [Google Scholar]
- 31.Xiong Y., Lee A.C., Lee G.U. Topography and nanomechanics of live neuronal growth cones analyzed by atomic force microscopy. Biophys. J. 2009;96:5060–5072. doi: 10.1016/j.bpj.2009.03.032. [DOI] [PMC free article] [PubMed] [Google Scholar]
- 32.Spedden, E., J. D. White, …, C. Staii. 2012. Young's Modulus of Cortical and P19 Derived Neurons Measured by Atomic Force Microscopy. Mater. Res. Soc. Symp. Proc.. 1420 Online Proc. Library: mrsf11–1420-oo04–04.
- 33.Malara A., Gruppi C., Balduini A. Extracellular matrix structure and nano-mechanics determine megakaryocyte function. Blood. 2011;118:4449–4453. doi: 10.1182/blood-2011-04-345876. [DOI] [PMC free article] [PubMed] [Google Scholar]
- 34.Franze K. Atomic force microscopy and its contribution to understanding the development of the nervous system. Curr. Opin. Genet. Dev. 2011;21:530–537. doi: 10.1016/j.gde.2011.07.001. [DOI] [PubMed] [Google Scholar]
- 35.Discher D.E., Janmey P., Wang Y.L. Tissue cells feel and respond to the stiffness of their substrate. Science. 2005;310:1139–1143. doi: 10.1126/science.1116995. [DOI] [PubMed] [Google Scholar]
- 36.Iyer S., Gaikwad R.M., Sokolov I. Atomic force microscopy detects differences in the surface brush of normal and cancerous cells. Nat. Nanotechnol. 2009;4:389–393. doi: 10.1038/nnano.2009.77. [DOI] [PMC free article] [PubMed] [Google Scholar]
- 37.Noctor S.C., Flint A.C., Kriegstein A.R. Neurons derived from radial glial cells establish radial units in neocortex. Nature. 2001;409:714–720. doi: 10.1038/35055553. [DOI] [PubMed] [Google Scholar]
- 38.Bain G., Ray W.J., Gottlieb D.I. From embryonal carcinoma cells to neurons: the P19 pathway. Bioessays. 1994;16:343–348. doi: 10.1002/bies.950160509. [DOI] [PubMed] [Google Scholar]
- 39.Gomez T.M., Roche F.K., Letourneau P.C. Chick sensory neuronal growth cones distinguish fibronectin from laminin by making substratum contacts that resemble focal contacts. J. Neurobiol. 1996;29:18–34. doi: 10.1002/(SICI)1097-4695(199601)29:1<18::AID-NEU2>3.0.CO;2-A. [DOI] [PubMed] [Google Scholar]
- 40.Letourneau P.C., Ressler A.H. Inhibition of neurite initiation and growth by taxol. J. Cell Biol. 1984;98:1355–1362. doi: 10.1083/jcb.98.4.1355. [DOI] [PMC free article] [PubMed] [Google Scholar]
- 41.Witte H., Neukirchen D., Bradke F. Microtubule stabilization specifies initial neuronal polarization. J. Cell Biol. 2008;180:619–632. doi: 10.1083/jcb.200707042. [DOI] [PMC free article] [PubMed] [Google Scholar]
- 42.Li W., Xia J.T., Feng Y. Microtubule stability and MAP1B upregulation control neuritogenesis in CAD cells. Acta Pharmacol. Sin. 2006;27:1119–1126. doi: 10.1111/j.1745-7254.2006.00362.x. [DOI] [PubMed] [Google Scholar]
- 43.Levental I., Georges P.C., Janmey P.A. Soft biological materials and their impact on cell function. Soft Matter. 2007;3:299–306. doi: 10.1039/b610522j. [DOI] [PubMed] [Google Scholar]
- 44.Gordon-Weeks P.R. Microtubules and growth cone function. J. Neurobiol. 2004;58:70–83. doi: 10.1002/neu.10266. [DOI] [PubMed] [Google Scholar]
Associated Data
This section collects any data citations, data availability statements, or supplementary materials included in this article.