

Abstract
Fusion of neurosecretory vesicles with the plasma membrane is mediated by SNARE proteins, which transfer a force to the membranes. However, the mechanism by which this force transfer induces fusion pore formation is still unknown. The neuronal vesicular SNARE protein synaptobrevin 2 (syb2) is anchored in the vesicle membrane by a single C-terminal transmembrane (TM) helix. In coarse-grain molecular-dynamics simulations, self-assembly of the membrane occurred with the syb2 TM domain inserted, as expected from experimental data. The free-energy profile for the position of the syb2 membrane anchor in the membrane was determined using umbrella sampling. To predict the free-energy landscapes for a reaction pathway pulling syb2 toward the extravesicular side of the membrane, which is the direction of the force transfer from the SNARE complex, harmonic potentials were applied to the peptide in its unbiased position, pulling it toward new biased equilibrium positions. Application of piconewton forces to the extravesicular end of the TM helix in the simulation detached the synaptobrevin C-terminus from the vesicle's inner-leaflet lipid headgroups and pulled it deeper into the membrane. This C-terminal movement was facilitated and hindered by specific mutations in parallel with experimentally observed facilitation and inhibition of fusion. Direct application of such forces to the intravesicular end of the TM domain resulted in tilting motion of the TM domain through the membrane with an activation energy of ∼70 kJ/mol. The results suggest a mechanism whereby fusion pore formation is induced by movement of the charged syb2 C-terminus within the membrane in response to pulling and tilting forces generated by C-terminal zippering of the SNARE complex.
Introduction
The vesicular SNARE (vSNARE) protein synaptobrevin 2 (syb2), also known as VAMP 2, plays a key role in biological vesicle fusion and transmitter release (1). Syb2 is a 116 amino acid protein that is anchored in the vesicle membrane by a single C-terminal transmembrane (TM) helix. Specific cleavage of syb2 by tetanus toxin or botulinum toxins B, D, F, and G inhibits vesicle fusion (2,3). The SNARE domain of syb2 interacts with those of the plasma membrane tSNARE proteins syntaxin and SNAP25, forming a coiled coil (4). The assembly of the SNARE complex occurs in a vectorial manner from the N-terminus to the C-terminus toward the membranes (5). This assembly is thought to generate a force that is transferred to the apposed membranes, leading to fusion. However, the molecular mechanism that transduces the force into fusion pore formation remains elusive.
When a force is generated that pulls the two membranes together, and this force works to overcome the energy barrier of membrane fusion, then a change of the syb2 TM domain position in the vesicle membrane is expected. It has been shown that addition of residues with a high energy of transfer from water to the membrane interface at the syb2 C-terminus inhibits fusion (6), suggesting that movement of the syb2 C-terminus plays a critical role in fusion pore formation. To determine how a force generated by the SNARE complex affects the position of the syb2 C-terminus in the membrane, we performed coarse-grain molecular-dynamics (CG-MD) simulations (7,8). We show that application of piconewton forces toward the extravesicular side of the membrane can detach the syb2 C-terminus from the vesicle membrane inner-leaflet headgroups, pulling it deeper into the membrane. Analysis of mutated syb2 constructs indicates that the detachment in response to applied force is facilitated or hindered consistent with their ability to support fusion as observed experimentally (6,9). Together, these experimental and computational results suggest a novel mechanism of fusion pore formation whereby a movement of the syb2 C-terminus within the membrane is generated by SNARE complex zippering, pulling and tilting the TM domain through the membrane. This TM domain movement of syb2 may play a key role in fusion pore formation.
Materials and Methods
MD simulations
α-Helical atomic models of fragments (Fig. 1 A) of rat syb2 (residues Q71–T116), the syb2 W89A/W90A double mutant (syb2 WA), and a syb2 with two lysines added at the C-terminus (Q71-T116-K117-K118) were generated based on ideal φ/ψ values by the Sidekick software (10). Initial atomistic models were converted to MARTINI force field CG representations (8) (Fig. 1, B–D), and MD simulations were performed using GROMACS 4 (11). The CG technique uses a 4:1 mapping of nonhydrogen atoms to CG particles, and nonbonded interactions are treated with Lennard-Jones interactions between four classes of particles (charged, polar, apolar, and mixed polar/apolar) that are split into subtypes based on polarity and hydrogen-bonding capabilities. Interactions were based on a lookup table, with nine levels in the MARTINI force field. Lennard-Jones interactions were shifted to zero between 9 Å and 12 Å, and electrostatic interactions were shifted to zero between 0 Å and 12 Å. The CG model was placed in a simulation box together with typically 252 randomly positioned dipalmitoylphosphatidylcholine (DPPC) lipid molecules and an appropriate number of water molecules to fill the box volume (Fig. 1 E). Five monovalent negatively charged ions were added to achieve electroneutrality of the system. α-Helical secondary structure was maintained via dihedral angle restraints between adjacent backbone particles. The simulations were performed at a temperature of 323 K to ensure a fluid lipid phase.
Figure 1.
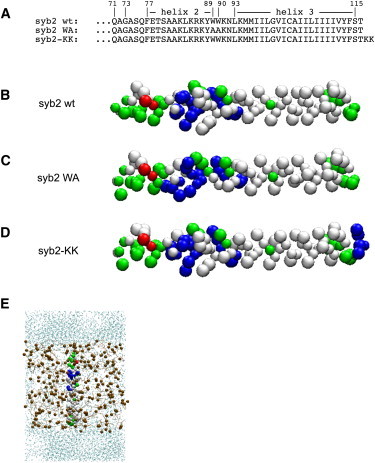
Simulated syb2 constructs and setup. (A) Sequences of syb2 constructs analyzed by CG MD simulations. (B and C) CG models for syb2 WT, syb2 WA, and syb2-KK as indicated. Colors indicate polar (green), nonpolar (white), negatively charged (red), and positively charged (blue) residues. (E) Initial setup of for CG simulation; DPPC is indicated in ochre, and water is shown in blue colors. Water particles are shown in reduced size for clarity.
For each molecular model, 100 simulations of 200 ns duration were performed using the Sidekick software (10) running large ensembles of simulations in an automated fashion. Simulations were performed over a mixed computational grid consisting of a dedicated 306 core MacOS cluster and workstations. Sidekick is written in python using the numpy and matplotlib libraries for calculations and plotting graphics. Xgrid is used to distribute calculations across the grid. System build, simulation, and basic analysis are automated, and the full simulation data are stored. Individual trajectories were further analyzed using a tcl script with VMD (12), generating trajectories for the following parameters: 1), the z-distance between the membrane center and the center of the backbone particles of W89/W90 or A89/A90 in the WA mutant; 2), the z-distance between membrane center and the G73 particle; 3), the angle between the TM domain (vector from S115 to WW/AA) and membrane normal; and 4), the kink angle between helix 2 (vector between backbone particles of F77 and Y88) and helix 3 (vector between backbone particles of L93 and S115).
Determination of free-energy profile
To determine the free-energy profile of the syb2 TM domain along the reaction pathway corresponding to pulling from the extravesicular side of the membrane, we added a harmonic potential, generating a restoring force on the position of a group (named the WW group) consisting of the two W89 W90 backbone particles or the corresponding A89 A90 particles in the WA mutant (see Fig. 1 A). Positions and force constants are given in Table S1 of the Supporting Material. Simulations started with the syb2 fragment at its unrestrained equilibrium position in the kinked state with the WW or AA group at a distance of ∼16–17 Å from the membrane center at the extravesicular membrane-water interface. In most simulations, the fragment rapidly (within 5–10 ns) positioned itself at a new equilibrium position, pulled by the umbrella potential. Each umbrella window was run for 200 ns. In addition, three unrestrained 200 ns simulations (zero force constant) were performed. Histograms of the WW group position along the membrane normal were generated for individual simulations (Fig. S1) and the free-energy profile was constructed via the weighted histogram analysis method (13–15) using the WHAM program (16). To avoid contributions from the initial dislocation to the new equilibrium position, the first 16 ns of the simulations were excluded from the analysis. In a few simulations with WW/AA positions >50 Å, a transition occurred during the 184 ns simulation time used in the analysis from a position deeper in the membrane or with the fragment's C-terminus in contact with the upper headgroup region, toward a more extracted or fully extracted position. In these cases, the WW group position trajectory was split into separate parts reflecting only fluctuations around a specific state (see Table S1).
To determine the free-energy profile of the syb2 C-terminus along the reaction pathway corresponding to tilting the syb2 TM domain as it may be induced by zippering up SNARE complexes that are sandwiched parallel between vesicle and plasma membrane, we added harmonic potentials, generating a restoring force on the position of a group (named the ST group) consisting of the S115 T116 backbone particles. As before, all simulations started with the syb2 fragment at its unrestrained equilibrium position in the kinked state. Simulations were run for 200 ns or 1 μs using harmonic potentials with force constants and pull positions as indicated in Table S2, and the position histograms shown in Fig. S2 to construct the energy profile.
Results and Discussion
Conformation of the syb2 fragment in self-assembly simulations
The conformation of the C-terminal syb2 fragment Q71-T116 model and two derived constructs (Fig. 1, A–D) in a DPPC membrane were characterized by CG self-assembly simulations. In the postfusion SNARE complex, syb2 forms an extended helical structure that includes the SNARE domain, the linker, and the TM domain (17,18). The syb2 fragment was therefore modeled as a helical peptide and placed in a simulation box containing typically 252 randomly positioned DPPC molecules (Fig. 1 E), which spontaneously formed a membrane in a self-assembly process. We performed 100 simulations, each 200 ns long, which has been shown to provide a better sampling of peptide-bilayer interactions than a few simulations of very long duration (10,19). For syb2 wild-type (WT), 95% of the simulations led to membrane insertion, and in 5% of the simulations the peptide ended up lying on the membrane surface. Fig. 2, A–C, illustrates 10 representative trajectories of individual simulations showing the z-distance of the W89/W90 backbone particles (Fig. 2 A) and of the position of G73 near the N-terminus of the fragment (Fig. 2 B) from the membrane center. Fig. 2 C shows the evolution of the TM helix tilt angle relative to the membrane normal. These trajectories indicate the presence of three major states, which we term kinked, extended, and deep.
Figure 2.
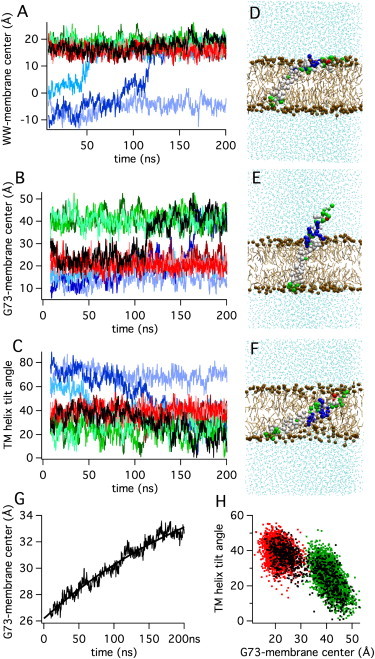
Simulation of the syb2 fragment in DPPC membrane. (A–C) Trajectories of the (A) distance between the W89/W90 backbone particles and the membrane center, (B) distance between residue G73 and the membrane center, and (C) TM helix tilt angle. Colors indicate trajectories in kinked state (red), extended state (green), transition from kinked to extended state (black), and trajectories starting in deep state (blue). Individual simulations are shown in different tones of corresponding color. (D–F) Representative conformations of the (D) kinked state, (E) extended state, and (F) deep state. (G) Average of 71 trajectories of the distance between residue G73 and the membrane center, such as those shown in panel B, and single exponential fit (smooth line) of the equation z(t) = z0 + Δz(1 − exp(−t/τ)). (H) Correlation between TM helix tilt and distance between residue G73 and the membrane center; colors indicate kinked state (red), extended state (green), and simulation with transition (black).
The trajectories shown in red colors correspond to simulations in which the fragment assumed a kinked state (Fig. 2 D) although the starting CG model was always extended (Fig. 1, B and E). In this state, the TM helix spans the membrane with the tryptophans W89 and W90 positioned in the membrane-water interface of the extravesicular leaflet and the syb2 C-terminus in the lipid headgroup region of the intravesicular leaflet (Fig. 2 A, red traces), consistent with experimental data (17,21,22). In this state, the fragment shows a marked bending near the membrane interface such that the juxtamembrane domain is oriented parallel to the membrane surface in contact with the lipid headgroups, ∼20 Å from the membrane center (Fig. 2 B, red traces). The kinked state is reminiscent of that found in simulations of a similar synaptobrevin 1a fragment (23). Analysis of trajectories that were in this state for the total analyzed simulation time (e.g., red traces in Fig. 2), revealed a Gaussian distribution for the TM domain tilt angle (38° ± 6° (SD)). It should be noted that the kink evolved during the self-assembly although the initial CG structure was modeled as a continuous straight helix (Fig. 1, B and E), maintaining the dihedral restraints that stabilize the CG structure. This behavior suggests that the kinked conformation is induced through the interaction of the juxtamembrane domain with the membrane-water interface region of the lipids. In previous simulations, a smaller 15° tilt was found for rat synaptobrevin 1a, which may be due to differences in the TM domain sequence but is more likely due to the adjustment of restraints at the junction between the TM and juxtamembrane domains in the simulations of synaptobrevin 1a (23).
The kinked state is in good agreement with the experimentally observed orientation of a slightly shorter fragment (residues 74–116) in DMPC bilayers (21). To determine how shortening of the lipid chain length affects the syb2 conformation in the membrane, we performed simulations of the syb2 fragment in DLPC. As expected from the decrease in membrane thickness, the kinked state in DLPC showed a somewhat increased TM helix tilt angle (49° ± 5.5° (SD)).
The kink near the membrane-water interface is also consistent with recent NMR data (22) indicating that syb2 residues 89–92 (WWKN) form a flexible hinge between helical segment 2 (residues 77–88) and the helical segment 3 (TM domain residues 93–115). The kink angle between these two helical segments was 40° ± 10° (SD) and exhibits considerable flexibility. Approximately 40% of the simulation time showed the syb2 fragment in a more extended state (Fig. 2 E), as indicated by the increased distance (∼40 Å) of G73 from the membrane center (Fig. 2 B). This state resembles the conformation of syb2 in the postfusion SNARE complex state (18), which shows helical extension from the SNARE domains into the juxtamembrane and TM domains. In this state, the tilt angle of the TM domain was ∼25° ± 8° (SD). The mean kink angle between helices 2 and 3 in this state was ∼20° and showed a skewed distribution with a half-width of 24°. In several simulations, a transition hinge motion was observed from the kinked state to the extended state. The black trace in Fig. 2, A–C, illustrates such a case. In contrast, no transitions in the reverse direction were observed. When the time course of the average distance of G73 from the membrane center was calculated from all simulations that showed a kinked or extended state after 8 ns, a time-dependent change became evident (Fig. 2 G). The change of the G73 position could be fitted with a single exponential, giving a time constant τ of 275 ± 25 ns and an asymptotic value (z0 + Δz) of 40 ± 1 Å matching the G73 position of the extended state (Fig. 2 B, green traces). The extended state is thus energetically preferred as expected from the dihedral constraints of the starting CG model structure that resembles the postfusion structure of syb2 in the SNARE complex (18). The transition from a kinked helix, as proposed for the prefusion state (24) to a straight helix in the postfusion state (18), may be part of the driving force of the conformational change of the SNARE complex that drives fusion. Fig. 2 H shows the relation between the extension and the TM helix tilt angle, illustrating the larger tilt angle in the kinked state (red dots) compared to the extended state (green dots). The black dots are for the simulation with transition (black traces in Fig. 2, A–C).
In a small subset of simulations (∼25%), a deep state was initially observed (Fig. 2 F) in which the fragment was highly tilted and completely immersed in the lipid bilayer. The trajectories for simulations that reveal this state are shown as blue traces in Fig. 2, A–C. In this state, the TM domain assumed a tilt angle of 58° ± 6° (SD), which is close to the 55° tilt angle that was found experimentally for the syb2 TM helix in POPC (21). However, in the simulations, this state was rare and frequently a transition to the kinked or extended state occurred during the simulation time, as shown in two of the three blue traces in Fig. 2, A–C.
Changes in the syb2 TM domain position by application of force
It is thought that fusion pore formation is initiated by a force transfer from the SNARE complex to the membranes. This force transfer must occur via the syb2 TM helix. To characterize the force transfer mechanism, we investigated how the application of force changes the position of the syb2 TM helix in the membrane. The SNARE complex produces its force via interactions in the SNARE domains pulling the membranes together. To mimic this process in the simulations, we applied forces to the backbone particles of W89 and W90 (WW group), which are normally located in the extravesicular membrane-water interface. This approach defines a reaction pathway on the multidimensional energy landscape corresponding to syb2/bilayer interactions, and provides an estimate of the free-energy profile along that pathway. The free-energy profile for the movement of the syb2 WW group parallel to the membrane normal, up to a distance of 60 Å from the membrane, was calculated via the umbrella sampling method (Fig. 3). To maintain the directionality of the force produced by the SNARE complex, we applied harmonic potentials to the WW group, pulling the protein from the resting state (no applied force) to a new equilibrium position. Simulations thus started with the syb2 fragment at its unrestrained equilibrium position in the kinked state, with the WW group 16-17 Å from the membrane center. If this initial setup failed due to excessive initial forces, we started the simulation using as the starting position the final state of a preceding simulation with smaller displacement from the membrane center. In this way, the energy profile represents that obtained along a reaction pathway that is encountered when the TM domain is pulled from the extravesicular side of the membrane. The system is prepared in a state that mimics a force transfer from SNARE complex zippering maintaining the directionality of the pulling force.
Figure 3.
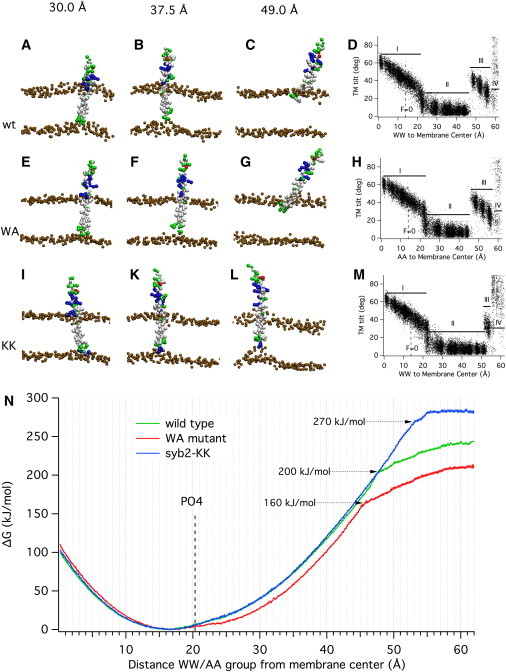
Conformations and energetics of syb2 movement in the membrane. Representative conformations of syb2 WT (A–C), the syb2 WA mutant (E–G), and the syb2-KK construct (I, K, and L) under the influence of harmonic forces pulling the WW/AA group to the target positions indicated at the top with a force constant of 1000 kJ mol−1 nm−2. (D, H, and M) Relation between the TM domain tilt angle relative to membrane normal and the position of the WW group for the syb2 WT (D), syb2 WA mutant (H), and syb2-KK construct (M). For region labels I–IV, see text. (N) Free-energy profiles from CG simulations of the syb2 WT fragment (green), syb2 WA mutant (red), and syb2-KK construct (blue) for pulling the WW/AA group toward the extravesicular side of the membrane. Error estimates for the free-energy values are included in the graph and are typically <2 kJ/mol. The average position of the lipid headgroup CG PO4 particles of the extravesicular leaflet is located at a 20 Å distance (dashed line labeled PO4).
Pulling on the syb2 TM helix starting from the unrestrained position leads to a distortion of the membrane structure as the syb2 C-terminus pulls on the headgroups of the surrounding lipids (Fig. 3, A and B) until the C-terminus eventually detaches from the inner-leaflet lipid headgroups (Fig. 3 C). The force exerted on the WW group strongly affects the tilt angle of the TM domain relative to the membrane normal (Fig. 3 D). When the WW group is pushed toward the membrane center or pulled out slightly up to ∼20 Å from the membrane center, the tilt angle shows a rather linear correlation with the WW position (Fig. 3 D, region I), reflecting the fact that the C-terminus is kept in the intravesicular membrane-water interface region (Table S1, state IF-I). When the WW group is pulled farther away, the molecule acquires the extended state and it initially pulls the inner-leaflet headgroups adjacent to the C-terminus with it, as can be seen in Fig. 3 B. The free-energy profile (Fig. 3 N, green trace) thus includes this distortion of the membrane. Because of the strong interaction of the C-terminus with the intravesicular headgroups, the TM domain is straightened and the tilt angle decreases (Fig. 3 D, region II). At a certain distance, however, the syb2 C-terminus is detached from the inner-leaflet headgroups (Fig. 3 C). This transition occurs at a WW-membrane center distance of ∼48 Å, or ∼31 Å from its resting position, and is associated with a marked decrease in the slope of the ΔG profile (Fig. 3 N, green line, dotted arrow, ΔG ∼200 kJ/mol). At this point, the syb2 C-terminus interacts with the extravesicular leaflet headgroups (Fig. 3 C; Table S1, state IF-E). The TM domain is now in the water phase and shows an increased tilt angle relative to the membrane normal (Fig. 3 D, region III). Eventually the C-terminus is completely detached from the membrane and rotates freely (Fig. 3 D, region IV; Table S1, state W).
Free-energy profile of the syb2 TM domain position along the directional pulling pathway
The total free-energy increase from the unrestrained equilibrium position to region IV (approaching 60 Å; Fig. 3 N, green trace) is ∼250 kJ/mol, which is similar to that previously reported for a different TM peptide of similar size (25). The ΔG profile in the 0–48 Å region can be empirically approximated by a harmonic potential with a force constant of ∼50 kJ mol−1 nm−2.
Application of constant pulling forces
To estimate the force that the SNARE complex needs to produce to detach the syb2 C-terminus from the inner-leaflet headgroups, we performed simulations in which instead of a harmonic force, a constant force was applied, in an attempt to model the force on the syb2 TM domain generated by the SNARE complex. The energy barrier to break a bond is lowered considerably when a pulling force is exerted (26). A constant force F adds a linear potential −FΔz to the free-energy landscape, where Δz is the distance from the equilibrium position. Fig. 4 A shows the free-energy profile for the syb2 fragment from Fig. 3 N in the absence of an applied force (black) and the predicted energy profiles in the presence of constant pulling forces of 40 pN (green), 80 pN (gray), 120 pN (blue), and 160 pN (red). These forces reduce the predicted activation energy for detachment of the syb2 C-terminus from the inner-leaflet headgroups to ∼130 kJ/mol, 80 kJ/mol, 40 kJ/mol, and 10 kJ/mol, respectively (Table 1). In the presence of these pulling forces, the energy profiles predict minima shifted to new equilibrium positions. The energy wells were fitted with harmonic potential functions (Fig. 4 A, dashed lines), providing the predicted equilibrium positions and effective harmonic force constants (Table 1).
Figure 4.
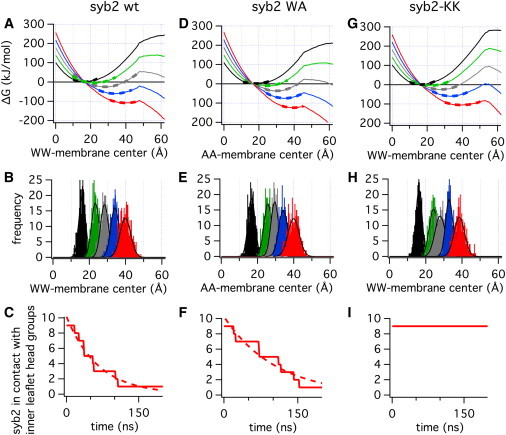
Simulations in the presence of constant pulling forces for three models: syb2-WT (A–C), syb2 WA (D–F), and syb2-KK (G–I). (A, D, and G) Free-energy profiles in the presence of constant pulling forces FP were predicted from the ΔG(z,FP = 0) data of Fig. 3N as ΔG(z,FP) = ΔG(z,0) – (z − z0)FP, where z0 is the equilibrium position (minimum) of the ΔG(z,FP = 0) profile for FP = 0 pN (black), FP = 40 pN (green), FP = 80 pN (gray), FP = 120 pN (blue), and FP = 160 pN (red); the dashed lines are harmonic potential fits to the potential wells. (B, E, and H) Frequency distributions from trajectories of the WW/AA group from simulations in the presence of constant forces as indicated by the corresponding colors; for forces > 0 only the later parts of trajectories after transition to the extended state were used. (C, F, and I) Survival curves from nine simulations with 160 pN force determining the time in the simulation until detachment of the syb2 C-terminus from inner-leaflet lipid headgroups.
Table 1.
Quantities calculated from simulations of the syb2 WT, syb2 WA, and syb2-KK models in the presence of constant pull forces
| syb2 WT | |||||
|---|---|---|---|---|---|
| Pull force (pN) | 0 | 40 | 80 | 120 | 160 |
| ΔG∗ (kJ mol−1) | 200 | 130 | 80 | 40 | 10 |
| exp(−ΔΔG∗/RT) | 2E-31 | 4E-20 | 5E-12 | 1E-05 | 1 |
| z0 (Å) | 16.6 | 22.3 | 28.1 | 33.8 | 40.0 |
| k (kJ mol−1 Å−2) | 0.51 | 0.42 | 0.41 | 0.42 | 0.36 |
| sqrt(RT/k) | 2.3 | 2.5 | 2.6 | 2.5 | 2.7 |
| Gauss z0 (Å) | 16.1 | 23.3 | 28.3 | 34.1 | 39.9 |
| Gauss SD (Å) | 1.9 | 2.1 | 2.1 | 2.3 | 3.0 |
| syb2 WA | |||||
| Pull force (pN) | 0 | 40 | 80 | 120 | 160 |
| ΔG∗ (kJ mol−1) | 160 | 105 | 60 | 30 | 10 |
| exp(−ΔΔG∗/RT) | 3E6 | 1E4 | 2E3 | 40 | 1 |
| z0 (Å) | 17.8 | 24.2 | 29.8 | 34.7 | 39.5 |
| k (kJ mol−1 Å−2) | 0.37 | 0.39 | 0.49 | 0.50 | 0.44 |
| sqrt(RT/k) | 2.7 | 2.6 | 2.4 | 2.3 | 2.5 |
| Gauss z0 (Å) | 16.7 | 25.7 | 29.4 | 34.2 | 39.9 |
| Gauss SD (Å) | 2.0 | 2.2 | 2.1 | 2.5 | 3.1 |
| syb2-KK | |||||
| Pull force (pN) | 0 | 40 | 80 | 120 | 160 |
| ΔG∗ (kJ mol−1) | 270 | 185 | 120 | 65 | 25 |
| exp(−ΔΔG∗/RT) | 5E-12 | 1E-09 | 3E-07 | 9E-05 | 4E-3 |
| z0 (Å) | 16.7 | 22.1 | 27.8 | 33.5 | 39.6 |
| k (kJ mol−1 Å−2) | 0.56 | 0.40 | 0.41 | 0.45 | 0.31 |
| sqrt(RT/k) | 2.2 | 2.6 | 2.6 | 2.4 | 3.0 |
| Gauss z0 (Å) | 16.3 | 24.2 | 27.9 | 32.9 | 38.5 |
| Gauss SD (Å) | 1.7 | 2.3 | 2.9 | 2.0 | 2.9 |
ΔG∗ is the energy difference between the point of C-terminus dissociation from the inner-leaflet headgroups and the minimum of the energy profile; z0 is the position of the energy minimum from fits of harmonic potential functions to the PMF profiles of Fig. 4, A, D, and G; k is the harmonic force constant from the same fits, sqrt(RT/k) indicates the expected SDs of the position probability distributions as predicted from the harmonic potential fits. Gauss z0 and Gauss SD are the peak positions and SDs of the Gaussian fits to the probability distributions obtained in simulations with constant force as shown in Fig. 4, B, E, and H. The value exp(−ΔΔG∗/RT) for syb2 WT (A) provides the factors for a change in rate constant relative to that at 160 pN force. For syb2 WA and syb2-KK, it provides the factors for a change in rate constant relative to WT at the same force.
To validate the predicted energy profiles in the presence of constant forces, we performed corresponding simulations. The position of the WW group in these simulations (Fig. 4 B) shows approximately Gaussian distributions with peaks within ∼1 Å of the positions of the minima in the energy profiles of Fig. 4 A (Table 1). The good agreement between the predicted energy profiles and the position histograms for the corresponding simulations validate the determination of the ΔG profiles for pulling on the syb2 TM domain from the extravesicular side.
For the 160 pN force, the energy barrier for detachment of the syb2 C-terminus from the intravesicular headgroups is predicted to be only ∼10 kJ/mol or ∼4 kBT, and thus the transition may be observable on the timescale of MD simulations. Indeed, at this force, eight of nine 200 ns simulations showed a detachment of the C-terminus from the inner-leaflet headgroups at variable times. The resulting survival curve (Fig. 4 C) was fitted by a single exponential (dashed line), giving a time constant of 64 ns. Force spectroscopy experiments performed on the SNARE complex yielded rupture forces of ∼250 pN (27), suggesting that a single SNARE complex may be able to generate the force needed to detach the syb2 C-terminus from the vesicle's inner-leaflet headgroups.
In CG-MD simulations, the dynamics appears to be accelerated ∼4-fold (28) and the simulation temperature used here was 323 K. Furthermore, DPPC is only a model lipid and the absolute numbers for the kinetics should thus be considered approximate. Nevertheless, the rapid phase of the exocytotic burst in chromaffin cells at room temperature has a time constant of ∼10 ms. The activation energy for dissociation of the C-terminus from the inner-leaflet headgroups is ∼30 kJ/mol higher at 120 pN force than at 160 pN (Table 1), which would result in millisecond timescale kinetics.
Syb2 mutations facilitating or inhibiting TM domain displacement
If a displacement of the syb2 TM domain in response to the force transfer contributes to promoting fusion, then lowering the energy that is needed to pull the WW group out by the necessary amount would be expected to facilitate fusion. We therefore performed corresponding sets of simulations for a construct in which the two tryptophan residues of syb2 were mutated to alanine residues (Fig. 1 C), a mutation that has been investigated experimentally. This mutation increases the rate of spontaneous transmitter release events ∼3-fold but decreases stimulated release ∼2-fold (9). Representative simulation states are shown in Fig. 3, E–G. The relation between the TM domain tilt angle and the position of the WW group (Fig. 3 H) is similar to that of syb2 WT (Fig. 3 D) except that the transition from region II to region III, where the C-terminus detaches from the inner-leaflet headgroups, is shifted from ∼48 Å to ∼45 Å.
The free-energy profile for this WA mutant (Fig. 3 N, red line) shows lower energies for displacements of the corresponding AA group toward the cytoplasm compared with the WT (Fig. 3 N, green line), as expected from the lower energies of transfer from water to the membrane interface for alanine compared with tryptophan (29). Although there has been some debate concerning the accuracy of CG force fields for peptide-bilayer interactions (7,30), this level of agreement gives us confidence to further analyze the simulation results. The energy required to pull the AA group out by 14–24 Å is 12–17 kJ/mol lower than that required for the WW group (∼5 kBT). The transition where the C-terminus detaches from the inner-leaflet headgroups occurs at a respective AA-membrane center distance of ∼45 Å, and the increase in free energy at this position is reduced by 40 kJ/mol (Fig. 3 N, red line, dotted arrow, ΔG ∼160 kJ/mol) compared with syb2 WT.
The predicted energy profiles in the presence of constant forces (Fig. 4 D) were confirmed by the position histograms (Fig. 4 E), which are consistent with the predicted energy wells (Table 1, syb2 WA). For the WA mutant, the activation energy barriers obtained at 40, 80, and 120 pN force are lowered, which is consistent with the increased frequency of spontaneous fusion events observed for this construct (9). The reduced activation energy needed to detach the C-terminus of this mutant protein is thus accompanied by a considerable facilitation of fusion by this mutation.
However, in the presence of a 160 pN force, the energy barrier is hardly changed. In the corresponding simulation, the kinetics for detachment of the C-terminus from the inner-leaflet headgroups (Fig. 4 F) is accordingly similar to that obtained for the WT with a fitted time constant of 105 ns. The simulations thus yield ∼2-fold slower kinetics for the 160 pN force, and because the amplitude of stimulated release in neurons depends on the kinetics as well as the duration of the calcium signal, such a change in kinetics can produce a reduction in the amplitude of stimulated release. However, the change in kinetics is small, and because the forces in physiological conditions are likely smaller, the reduction in stimulated release may well be due to depletion of releasable vesicles as a consequence of the increased spontaneous release rate.
Whereas the WA mutant facilitates fusion, the addition of polar residues at the syb2 C-terminus inhibits fusion (6). We therefore investigated the free-energy profile of a syb2 construct with two lysine residues added at its C-terminus (Fig. 1 D), a construct that produced virtually complete inhibition of fusion (6). Simulations with this construct (Fig. 3, I, K, and L) showed that much higher forces were needed to detach the modified C-terminus from the inner-leaflet headgroups (Fig. 3 L). The transition from region II to region III is shifted to 53 Å (Fig. 3 M). In region IV, small tilt angles are missing, reflecting a repellent interaction between the added lysines and the lipid headgroups once the C-terminus is in the water phase. Whereas the energy profile (Fig. 3 N, blue line) shows only little change in the range up to the 48 Å position of the WW group, the energy increases further with increasing slope as the construct is pulled out more, because the snorkeling lysines stabilize the interaction with the inner-leaflet headgroups.
The predicted energy profiles in the presence of constant pulling forces (Fig. 4 G) are confirmed by the WW group position histograms from the corresponding simulations (Fig. 4 H; Table 1, syb2-KK). The activation barriers are markedly increased for all forces, and even for the 160 pN force the activation energy is increased by ∼15 kJ/mol or ∼6 kBT, which should make the kinetics of detachment ∼250-fold slower. Indeed, in none of the nine simulations performed for syb2-KK in the presence of a 160 pN force was a transition to the detached state observed (Fig. 4 I). The energy barrier at 120 pN force would be 25 kJ/mol higher for the syb2-KK construct than for the WT (Table 1, syb2 WT/syb2-KK), increasing the kinetic time constant by a factor of ∼10,000, which is consistent with the virtually complete inhibition of fusion observed experimentally for this molecular construct (6). CG models are, of course, an approximation. A direct determination of the difference in energy for arginine insertion into the membrane showed that it is ∼2-fold larger for the all-atom model (7). The increase in activation energy for the syb2-KK construct compared with syb2 WT is therefore a lower estimate and may in fact be even larger than the estimate obtained here.
C-terminal movement through changes in TM domain tilt
The energy profile for pulling the TM domain toward the extravesicular side along the membrane normal represents a simplified reaction coordinate that allows quantification of the energetic changes produced by molecular manipulations at the C-terminus or of the interfacial tryptophans. SNARE complex zippering, however, will not result in a straight pulling perpendicular to the membrane and will likely also involve a tilting of the syb2 TM domain (31). We therefore performed simulations in an attempt to mimic this process. In these simulations, we applied harmonic forces to the backbone particles of the last two C-terminal residues of syb2, S115/T116 (the ST group). The simulations were started with the syb2 fragment at its unrestrained equilibrium position in the kinked state, with the ST group located in the intravesicular lipid headgroup region, ∼17 Å from the membrane center (Fig. 5 A), moving the ST group toward the extravesicular membrane-water interface (Fig. 5, B and C). This approach resulted in a directional reaction pathway that changed the syb2 TM domain tilt angle from ∼40° to ∼90° while the ST group was moved through the membrane (Fig. 5 D). The energy profile for this displacement (Fig. 5 E) shows a peak when the ST group is near the membrane center with an activation energy of ∼70 kJ/mol. Once it detaches from the inner-leaflet headgroups, the syb2 C-terminus is thus highly unstable at this position. When a state in this region (Fig. 5 B) was chosen to start an unbiased simulation, the C-terminus moved within 2 ns to one of the energy minima in the membrane-water interfaces on either side of the membrane (as in Fig. 5, A and C). The activation energy of ∼70 kJ/mol for the tilting motion translocating the charged C-terminus across the membrane is considerably lower than the 200 kJ/mol estimated for the vertical pulling, because in the tilting motion the hydrophobic residues of the TM domain remain in the membrane and are not transferred to the water phase. If the force generated by the SNARE complex were simply modeled as a constant pulling force acting on the ST group in the z-direction, an 80-pN force would already lower the activation energy to a few kBT (Fig. 5 E, dashed line). However, this is an oversimplification because the molecular force generating the tilting motion would have to be generated by the progressive zippering of the SNARE complex, which would pull the juxtamembrane domain residues somewhat out of the membrane. Therefore, the activation energy for the detachment of the C-terminus from the inner-leaflet headgroups in the actual SNARE complex zippering would likely be intermediate between the tilting motion (Fig. 5 E) and the vertical pulling motion (Fig. 4 A).
Figure 5.
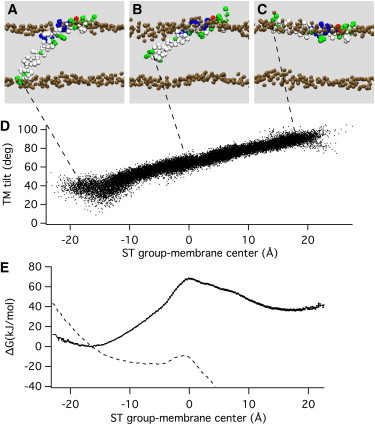
Energetics of syb2 tilting movement in the membrane. (A–C) Harmonic potentials were applied to the ST group in the kinked state (A), generating directional movement through the hydrophobic core (B) to the extravesicular membrane-water interface (C). (D) The change of the ST group position is accompanied by a corresponding change in the TM domain tilt angle. (E) The free-energy profile constructed from the umbrella simulations (Table S2 and Fig. S2) shows a maximum when the C-terminus is located in the membrane center (black dots with error bars). The energy barrier is lowered to ∼3 kBT when an 80 pN force is applied in the z direction (dashed line).
Conclusion
The syb2 C-terminus appears to play a key role in transducing the force generated by the SNARE domain zippering into fusion pore formation (31,32). A role of the TM regions of the SNARE proteins in the initiation of fusion by causing distortions of the lipid packing was recently supported by MD-CG simulations indicating that the C-termini of the TM regions are associated with the formation of fusion pores (33). Fusion is thought to be induced by a force transfer from SNARE complex zippering. In the simulations analyzed here, we characterized how piconewton forces affect the syb2 TM domain in the membrane. We modeled a syb2 fragment in a DPPC model membrane that does not reflect the lipid composition of synaptic vesicles (34). Negatively charged lipids modify syb2-membrane interactions (35), and therefore simulations of syb2 in a physiological lipid composition are currently in progress.
Nevertheless, experimental data (6) and the simulation results presented here suggest a fusion mechanism whereby the syb2 C-terminus detaches from the inner-leaflet headgroups driven by the transition of the SNARE complex to a continuous helically extended state. This zippering transition exerts a force on the syb2 TM helix, which will pull on the syb2 TM domain and also induce tilting of the TM domain. The pulling and tilting may lead to detachment of the syb2 C-terminus from the inner-leaflet headgroups and translocation of the charged C-terminus into the hydrophobic core of the membrane. At this position, the C-terminus is highly unstable and will rapidly assume a position in the extravesicular lipid headgroup region.
The energy that needs to be provided by the protein machinery for fusion of synaptic vesicles with the plasma membrane to occur on a physiological timescale has been estimated to be ∼15-50 kBT (36–38) corresponding to 40–125 kJ/mol. This amount of energy could be provided by assembly of a single SNARE complex (27,39–41). The energy from SNARE complex assembly needs to be transferred to the membrane via the generation of a corresponding force. In the simulations, an increase in energy by 40–125 kJ/mol is obtained when the WW group is pulled away from its equilibrium position by 14–24 Å (Fig. 3 N). When the syb2 TM domain exerts a tilting motion through the membrane, the activation energy to translocate the C-terminus to the extravesicular membrane-water interface is only ∼70 kJ/mol (Fig. 5 E).
Although it was recently shown that a single SNARE complex may be sufficient to promote lipid vesicle fusion (42,43), the number of SNARE complexes needed for fusion is controversial, and several SNARE complexes are required for rapid fusion kinetics (44–47). Based on the results presented here, we propose the fusion model shown in Fig. 6, which modifies previous models (31,32) that postulated a key role of TM domain tilting in fusion. In this model, we speculate that the C-terminus of the tSNARE syntaxin may play a complementary role in the plasma membrane side consistent with the conclusions derived from CG simulations of a ternary SNARE complex (33). The states in the process of fusion pore formation (Fig. 6 A) are related to states observed in the simulations (Fig. 6 B) that were performed to generate the data of Fig. 5. From the prefusion state (i) the SNARE complex pulls the membranes together while the C-termini of syb2 and presumably syntaxin maintain contact with the exoplasmic membrane leaflet lipid headgroups (ii). This movement is induced by progressive zippering of the SNARE complex toward the C-terminal end, which will pull the tryptophans W89/W90 somewhat out of the membrane, a process that is facilitated for the WA mutant compared with the WT (Fig. 3 N). The proposed tilting movement of the syntaxin TM domain will likely involve an activation energy similar to that of the syb2 movement. However, these activation energies will be considerably reduced by the zippering interactions. Once the C-termini are detached from the intravesicular leaflet headgroups, they move toward the endoplasmic leaflets (iii), such that syb2 and syntaxin assume an extended state parallel to the membranes and the TM domains come into contact, linking the two membranes (iv). From state iv, fusion pore formation may occur via a stalk intermediate (v), which will be unstable due to the C-terminal charges of the TM domains, proceeding to the fusion pore state (vi). In this state, the TM domains are again spanning the membrane, a state that has much lower energy than the orientation parallel to the membrane in the headgroup region (Fig. 5 E). However, the precise intermediates from state iii to state vi are still uncertain because it seems quite possible that fusion pore formation may occur during and in association with the movement of the syb2 and syntaxin C-termini. This issue will be addressed in further simulations of SNARE complexes linking two membranes. The predictions of this model can be tested using a combination of experimental and computational approaches to investigate how specific mutations near the syb2 and syntaxin C-termini affect fusion pore formation.
Figure 6.
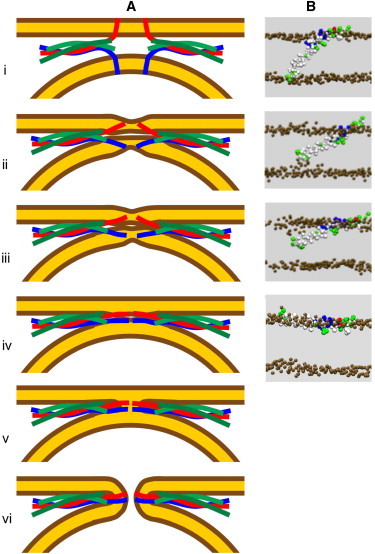
(A) Sequence of states leading to fusion pore formation and (B) the corresponding states of the syb2 TM domain from the simulations shown in Fig. 5. Zippering of the SNARE complex leads to helical extension, which in turn leads to force transfer and TM domain tilt as indicated in states i–iv. Fusion pore formation (vi) could proceed via the stalk state (v) or could be induced via the transition from state iii to iv.
Beyond the significance of the results presented here for elucidating the molecular mechanism of fusion pore formation, we also wish to point out the novel (to our knowledge) way in which the energy profiles for the position of the TM domain in the membrane were determined. In our simulations, the harmonic potential was applied to the peptide in its unbiased position, pulling it to new biased equilibrium position. This method of defining a reaction pathway allowed us to quantify the syb2 TM domain behavior as it may occur during the force transfer from SNARE complex zippering. This approach may also be useful for simulating other molecular mechanisms whereby a force is applied to a membrane protein, because it can access potentially relevant metastable states. The energy profile along this pathway can then be used to predict the energy landscapes in the presence of defined forces, and simulations in the presence of such forces can be performed to validate the energy profiles. The simulations are therefore able to predict the force dependence of the energy barrier to pull a membrane protein out of the membrane, a prediction that can be quantitatively tested in molecular pulling experiments using atomic force microscope cantilevers.
Acknowledgments
This work was supported by National Institutes of Health grants R01GM085808 and R21-NS072577 to M.L. B.A.H. was supported by the Biotechnology and Biological Sciences Research Council via the Oxford Center for Integrative Systems Biology, and O.B. was supported by a grant from the European Union (EDICT Project, grant 201924). A.C. is a Medical Research Council research student. Research in M.S.P.S.'s laboratory is also supported by the Wellcome Trust.
Footnotes
Benjamin A. Hall's present address is Department of Chemistry, University College London, London, UK.
Oliver Beckstein's present address is Arizona State University, Department of Physics, Tempe, AZ.
Supporting Material
References
- 1.Söllner T., Whiteheart S.W., Rothman J.E. SNAP receptors implicated in vesicle targeting and fusion. Nature. 1993;362:318–324. doi: 10.1038/362318a0. [DOI] [PubMed] [Google Scholar]
- 2.Schiavo G., Benfenati F., Montecucco C. Tetanus and botulinum-B neurotoxins block neurotransmitter release by proteolytic cleavage of synaptobrevin. Nature. 1992;359:832–835. doi: 10.1038/359832a0. [DOI] [PubMed] [Google Scholar]
- 3.Niemann H., Blasi J., Jahn R. Clostridial neurotoxins: new tools for dissecting exocytosis. Trends Cell Biol. 1994;4:179–185. doi: 10.1016/0962-8924(94)90203-8. [DOI] [PubMed] [Google Scholar]
- 4.Weis W.I., Scheller R.H. Membrane fusion. SNARE the rod, coil the complex. Nature. 1998;395:328–329. doi: 10.1038/26354. [DOI] [PubMed] [Google Scholar]
- 5.Sørensen J.B., Wiederhold K., Fasshauer D. Sequential N- to C-terminal SNARE complex assembly drives priming and fusion of secretory vesicles. EMBO J. 2006;25:955–966. doi: 10.1038/sj.emboj.7601003. [DOI] [PMC free article] [PubMed] [Google Scholar]
- 6.Ngatchou A.N., Kisler K., Lindau M. Role of the synaptobrevin C terminus in fusion pore formation. Proc. Natl. Acad. Sci. USA. 2010;107:18463–18468. doi: 10.1073/pnas.1006727107. [DOI] [PMC free article] [PubMed] [Google Scholar]
- 7.Bond P.J., Wee C.L., Sansom M.S. Coarse-grained molecular dynamics simulations of the energetics of helix insertion into a lipid bilayer. Biochemistry. 2008;47:11321–11331. doi: 10.1021/bi800642m. [DOI] [PubMed] [Google Scholar]
- 8.Monticelli L., Kandasamy S.K., Marrink S.J. The MARTINI coarse-grained force field: extension to proteins. J. Chem. Theory Comput. 2008;4:819–834. doi: 10.1021/ct700324x. [DOI] [PubMed] [Google Scholar]
- 9.Maximov A., Tang J., Südhof T.C. Complexin controls the force transfer from SNARE complexes to membranes in fusion. Science. 2009;323:516–521. doi: 10.1126/science.1166505. [DOI] [PMC free article] [PubMed] [Google Scholar]
- 10.Hall B.A., Chetwynd A.P., Sansom M.S. Exploring peptide-membrane interactions with coarse-grained MD simulations. Biophys. J. 2011;100:1940–1948. doi: 10.1016/j.bpj.2011.02.041. [DOI] [PMC free article] [PubMed] [Google Scholar]
- 11.Van Der Spoel D., Lindahl E., Berendsen H.J. GROMACS: fast, flexible, and free. J. Comput. Chem. 2005;26:1701–1718. doi: 10.1002/jcc.20291. [DOI] [PubMed] [Google Scholar]
- 12.Humphrey W., Dalke A., Schulten K. VMD: visual molecular dynamics. J. Mol. Graph. 1996;14:33–38. doi: 10.1016/0263-7855(96)00018-5. 27–38. [DOI] [PubMed] [Google Scholar]
- 13.Torrie G.M., Valleau J.P. Non-physical sampling distributions in Monte-Carlo free-energy estimation—umbrella sampling. J. Comput. Phys. 1977;23:187–199. [Google Scholar]
- 14.Roux B. The calculation of the potential of mean force using computer-simulations. Comput. Phys. Commun. 1995;91:275–282. [Google Scholar]
- 15.Kumar S., Rosenberg J.M., Kollman P.A. Multidimensional free-energy calculations using the weighted histogram analysis method. J. Comput. Chem. 1995;16:1339–1350. [Google Scholar]
- 16.Grossfield, A. 2010. WHAM: the weighted histogram analysis method, version 2.0.4. http://membrane.urmc.rochester.edu/content/wham.
- 17.Kweon D.H., Kim C.S., Shin Y.K. Insertion of the membrane-proximal region of the neuronal SNARE coiled coil into the membrane. J. Biol. Chem. 2003;278:12367–12373. doi: 10.1074/jbc.M211123200. [DOI] [PubMed] [Google Scholar]
- 18.Stein A., Weber G., Jahn R. Helical extension of the neuronal SNARE complex into the membrane. Nature. 2009;460:525–528. doi: 10.1038/nature08156. [DOI] [PMC free article] [PubMed] [Google Scholar]
- 19.Vostrikov V.V., Hall B.A., Sansom M.S. Changes in transmembrane helix alignment by arginine residues revealed by solid-state NMR experiments and coarse-grained MD simulations. J. Am. Chem. Soc. 2010;132:5803–5811. doi: 10.1021/ja100598e. [DOI] [PMC free article] [PubMed] [Google Scholar]
- 20.Reference deleted in proof.
- 21.Bowen M., Brunger A.T. Conformation of the synaptobrevin transmembrane domain. Proc. Natl. Acad. Sci. USA. 2006;103:8378–8383. doi: 10.1073/pnas.0602644103. [DOI] [PMC free article] [PubMed] [Google Scholar]
- 22.Ellena J.F., Liang B., Tamm L.K. Dynamic structure of lipid-bound synaptobrevin suggests a nucleation-propagation mechanism for trans-SNARE complex formation. Proc. Natl. Acad. Sci. USA. 2009;106:20306–20311. doi: 10.1073/pnas.0908317106. [DOI] [PMC free article] [PubMed] [Google Scholar]
- 23.Durrieu M.P., Bond P.J., Baaden M. Coarse-grain simulations of the R-SNARE fusion protein in its membrane environment detect long-lived conformational sub-states. ChemPhysChem. 2009;10:1548–1552. doi: 10.1002/cphc.200900216. [DOI] [PubMed] [Google Scholar]
- 24.Sutton R.B., Fasshauer D., Brunger A.T. Crystal structure of a SNARE complex involved in synaptic exocytosis at 2.4 A resolution. Nature. 1998;395:347–353. doi: 10.1038/26412. [DOI] [PubMed] [Google Scholar]
- 25.Chetwynd A., Wee C.L., Sansom M.S. The energetics of transmembrane helix insertion into a lipid bilayer. Biophys. J. 2010;99:2534–2540. doi: 10.1016/j.bpj.2010.08.002. [DOI] [PMC free article] [PubMed] [Google Scholar]
- 26.Bell G.I. Models for the specific adhesion of cells to cells. Science. 1978;200:618–627. doi: 10.1126/science.347575. [DOI] [PubMed] [Google Scholar]
- 27.Liu W., Montana V., Parpura V. Single molecule mechanical probing of the SNARE protein interactions. Biophys. J. 2006;91:744–758. doi: 10.1529/biophysj.105.073312. [DOI] [PMC free article] [PubMed] [Google Scholar]
- 28.Marrink S.J., de Vries A.H., Mark A.E. Coarse grained model for semiquantitative lipid simulations. J. Phys. Chem. B. 2004;108:750–760. [Google Scholar]
- 29.Wimley W.C., White S.H. Experimentally determined hydrophobicity scale for proteins at membrane interfaces. Nat. Struct. Biol. 1996;3:842–848. doi: 10.1038/nsb1096-842. [DOI] [PubMed] [Google Scholar]
- 30.Vorobyov I., Li L., Allen T.W. Assessing atomistic and coarse-grained force fields for protein-lipid interactions: the formidable challenge of an ionizable side chain in a membrane. J. Phys. Chem. B. 2008;112:9588–9602. doi: 10.1021/jp711492h. [DOI] [PubMed] [Google Scholar]
- 31.Jackson M.B. SNARE complex zipping as a driving force in the dilation of proteinaceous fusion pores. J. Membr. Biol. 2010;235:89–100. doi: 10.1007/s00232-010-9258-1. [DOI] [PMC free article] [PubMed] [Google Scholar]
- 32.Tong J., Borbat P.P., Shin Y.K. A scissors mechanism for stimulation of SNARE-mediated lipid mixing by cholesterol. Proc. Natl. Acad. Sci. USA. 2009;106:5141–5146. doi: 10.1073/pnas.0813138106. [DOI] [PMC free article] [PubMed] [Google Scholar]
- 33.Risselada H.J., Kutzner C., Grubmüller H. Caught in the act: visualization of SNARE-mediated fusion events in molecular detail. ChemBioChem. 2011;12:1049–1055. doi: 10.1002/cbic.201100020. [DOI] [PubMed] [Google Scholar]
- 34.Takamori S., Holt M., Jahn R. Molecular anatomy of a trafficking organelle. Cell. 2006;127:831–846. doi: 10.1016/j.cell.2006.10.030. [DOI] [PubMed] [Google Scholar]
- 35.de Haro L., Ferracci G., Seagar M. Ca2+/calmodulin transfers the membrane-proximal lipid-binding domain of the v-SNARE synaptobrevin from cis to trans bilayers. Proc. Natl. Acad. Sci. USA. 2004;101:1578–1583. doi: 10.1073/pnas.0303274101. [DOI] [PMC free article] [PubMed] [Google Scholar]
- 36.Grafmüller A., Shillcock J., Lipowsky R. The fusion of membranes and vesicles: pathway and energy barriers from dissipative particle dynamics. Biophys. J. 2009;96:2658–2675. doi: 10.1016/j.bpj.2008.11.073. [DOI] [PMC free article] [PubMed] [Google Scholar]
- 37.Kozlovsky Y., Kozlov M.M. Stalk model of membrane fusion: solution of energy crisis. Biophys. J. 2002;82:882–895. doi: 10.1016/S0006-3495(02)75450-7. [DOI] [PMC free article] [PubMed] [Google Scholar]
- 38.Siegel D.P. The Gaussian curvature elastic energy of intermediates in membrane fusion. Biophys. J. 2008;95:5200–5215. doi: 10.1529/biophysj.108.140152. [DOI] [PMC free article] [PubMed] [Google Scholar]
- 39.Wiederhold K., Fasshauer D. Is assembly of the SNARE complex enough to fuel membrane fusion? J. Biol. Chem. 2009;284:13143–13152. doi: 10.1074/jbc.M900703200. [DOI] [PMC free article] [PubMed] [Google Scholar]
- 40.Yersin A., Hirling H., Kasas S. Interactions between synaptic vesicle fusion proteins explored by atomic force microscopy. Proc. Natl. Acad. Sci. USA. 2003;100:8736–8741. doi: 10.1073/pnas.1533137100. [DOI] [PMC free article] [PubMed] [Google Scholar]
- 41.Li F., Pincet F., Tareste D. Energetics and dynamics of SNAREpin folding across lipid bilayers. Nat. Struct. Mol. Biol. 2007;14:890–896. doi: 10.1038/nsmb1310. [DOI] [PubMed] [Google Scholar]
- 42.van den Bogaart G., Holt M.G., Jahn R. One SNARE complex is sufficient for membrane fusion. Nat. Struct. Mol. Biol. 2010;17:358–364. doi: 10.1038/nsmb.1748. [DOI] [PMC free article] [PubMed] [Google Scholar]
- 43.Shi L., Shen Q.T., Pincet F. SNARE proteins: one to fuse and three to keep the nascent fusion pore open. Science. 2012;335:1355–1359. doi: 10.1126/science.1214984. [DOI] [PMC free article] [PubMed] [Google Scholar]
- 44.Han X., Wang C.T., Jackson M.B. Transmembrane segments of syntaxin line the fusion pore of Ca2+-triggered exocytosis. Science. 2004;304:289–292. doi: 10.1126/science.1095801. [DOI] [PubMed] [Google Scholar]
- 45.Sinha R., Ahmed S., Klingauf J. Two synaptobrevin molecules are sufficient for vesicle fusion in central nervous system synapses. Proc. Natl. Acad. Sci. USA. 2011;108:14318–14323. doi: 10.1073/pnas.1101818108. [DOI] [PMC free article] [PubMed] [Google Scholar]
- 46.Mohrmann R., de Wit H., Sørensen J.B. Fast vesicle fusion in living cells requires at least three SNARE complexes. Science. 2010;330:502–505. doi: 10.1126/science.1193134. [DOI] [PubMed] [Google Scholar]
- 47.Domanska M.K., Kiessling V., Tamm L.K. Docking and fast fusion of synaptobrevin vesicles depends on the lipid compositions of the vesicle and the acceptor SNARE complex-containing target membrane. Biophys. J. 2010;99:2936–2946. doi: 10.1016/j.bpj.2010.09.011. [DOI] [PMC free article] [PubMed] [Google Scholar]
Associated Data
This section collects any data citations, data availability statements, or supplementary materials included in this article.