

Abstract
Transcription in higher organisms requires spatiotemporal coordination of transcription machinery and the transcription factors at promoter sites. Toward this, recent evidence suggests that both static compartmentalization and dynamic self-organization of transcriptional apparatus are in effect at sites of transcription. Although the dynamics of transcription machinery is essential to genome regulation, the principles underlying this organization and its functional coupling to nuclear architecture is unclear. In a recent study we revealed that Uridine-5′-triphosphate (UTP) uptake in living cells labeled transcription-related compartments. In this article, we quantitatively establish multicolor labeling strategies for UTP-enriched transcription compartments (TCs) and probe their dynamic organization. UTP-enriched TCs were found to be in two distinct fractions: one colocalized with phosphorylated RNA pol II and the other as nascent aggregates. The fraction colocalized with the phosphorylated RNA pol II decreased with the inhibition of transcription initiation or elongation. Fluorescence anisotropy imaging and photobleaching experiments suggest that TCs are functional aggregates of nascent transcripts that are assembled in a transcription-dependent manner. Fluorescence correlation spectroscopy analysis revealed the relative fraction and sizes of fluorescent UTP-labeled transcripts in the nucleoplasm. Time-lapse imaging experiments of TCs exhibited pause and a mobile nature of these compartments within interchromosome territories. Perturbation of either nucleoskeletal protein or the cytoskeleton resulted in reduced active mobility of TCs, whereas inhibitors of transcription enhanced the mobile fraction of TCs. Further, high temporal resolution imaging showed evidence of stepping dynamics of TCs regulated by nucleoskeleton and chromatin modifications. Taken together, our experiments suggest the transient compartmentalization of UTP-enriched aggregates and their dynamic reorganization in a transcription-dependent manner. These results may have important implications for understanding spatiotemporal control of eukaryotic transcription.
Introduction
Nucleus is a dense organelle with about a meter-long chromatin organized into chromosome territories (1–3). A number of nuclear bodies, functional clusters of proteins, have been found to be either mobile or immobile (4–6) in these interchromosome territories. The positioning of the chromosomes and their functional interactions with nuclear bodies are essential in regulating genomic programs. In the context of eukaryotic transcription, the interchromosome territories have been found to be gene-rich (7), and spatial clustering of genes in these territories has been found to be critical for coregulating gene expression (8). Recent experiments suggest two possible models to control transcription initiation. First is the observation of looping of genes to preformed immobile transcription foci (referred to as transcription factories (TFs)) within the 3D architecture of the nucleus (9–12). These TFs, or transcription foci, have been shown to be submicron nuclear regions containing multiple RNA polymerase II (RNA pol II) complexes. The second model is the dynamic assembly of transcription apparatus onto gene regulatory sites, for example, the recruitment of heat-shock factor to an endogeneous promoter site upon induction (13). In addition, recent experiments suggest the formation of nuclear bodies, including TFs, using RNA templates (14,15). These models suggest that the spatiotemporal organization of transcription machinery and the nascent transcripts is an important layer of genome regulation. However, the underlying principles are still unclear. In a previous work, we showed that fluorescent uridine-5′-triphosphate (UTP) incorporation marked transcription compartments (TCs) in the nucleus of living cells, exhibited a dynamic organization (16). In this article, we provide direct evidence that TCs are specialized foci comprised of RNA aggregates where fraction of them are colocalized with active RNA pol II. In addition, we show that their dynamic organization is intimately coupled to functional nuclear architecture in a transcription-dependent manner.
Materials and Methods
Cell culture and inhibitor treatments
HeLa and NIH3T3 cells were grown in Dulbecco’s modified Eagle’s medium (Gibco, Grand Island, NY), whereas CHO cells were grown in F-12 HAM (Hi-Media, Paris, France) medium containing 5% FBS (Gibco) at 37°C and 5% CO2. Trichostatin-A (TSA; Sigma-Aldrich, St. Louis, MO) treatment involved addition of 100 ng/ml TSA and incubation for 16 h. Cells were synchronized at early S phase by incubation with 10 μM aphidicolin (Sigma-Aldrich) for 16 h. Transcription inhibition was performed by treatment with 5,6-dichloro-1-β-D-ribofuranosylbenzimidazole (DRB; Sigma-Aldrich, 40 μM, 1 h) or α-amanitin (20 or 40 μg/ml for 1 h) (Sigma-Aldrich). Cytoskeletal filaments were perturbed by treatment with cytochalasin D (1 μM, Sigma-Aldrich) or Nocodazole (10 μg/ml, Sigma-Aldrich) for 1 h.
RNAi assay
HeLa cells were transfected with 75 nM of small-interfering RNA (siRNA) from Microsynth, Balgach, Switzerland (laminB1 sense siRNA, 5′CGCGCUUGGUAGAGGUGGATT3′; laminB1 antisense siRNA, 5′UCCACCUCUACCAAGCGCGTT3′; scrambled control sense RNA, 5′GAGGACUGUCAUGGAGUGATT3′; and scrambled control antisense RNA, 5′UCACUCCAUGACAGUCCUCTT3′) per 15,000 cells, using DharmaFECT 1 Transfection reagent (Dharmacon RNA Technologies, Lafayette, CO) according to the manufacturer’s instructions. Cells were transfected in 35-mm plates with coverslip bottoms containing 1.5 ml of media, so that they can be imaged directly. Real-time PCR was used to quantitate the fold change in laminB1 expression after siRNA treatment. RNA was extracted using RNeasy Mini kit (Qiagen, Venlo, The Netherlands), and 500 ng of total RNA extracted was subjected to reverse transcription reaction (37°C for 60 min) and then to PCR with qPCR MasterMix Plus containing SYBR Green (Eurogentec, Seraing, Belgium) for 50 cycles in a Rotor Gene 3000. Primer sequences used were fwd-5′AAAAGACAACTCTCGTCGCAT3, rev-CCGCTTTCCTCTAGTTGTACG3′ for lamin B1, and fwd-5′GAGCGGGAAATCGTGCGTG3′, rev-5′GTAGTTTCGTGGATGCCACAGG3′ for Actin B (control). A decrease in laminB1 expression of ∼77% was seen after 75 nM treatment of siRNA. The cells treated with the laminB1 siRNA were labeled with fluorescent UTPs after 48 hr of transfection.
Labeling transcription compartment with fluorescent UTPs and antibodies
The TCs were labeled using Texas Red-, Alexa546-, or Cy5-UTPs (Chromatide, Life Technologies, Carlsbad, CA) by hypotonic shock, as described previously (16). The TCs were labeled by the following methods: (1) cells were labeled for TCs before being subjected to drug treatment; and (2) cells were labeled with TCs after drug treatment. We used method 1 in experiments of antibody staining, fluorescence correlation spectroscopy (FCS), anisotropy measurement, and live-cell tracking experiments. In the photobleaching experiment, both Alexa546- and Cy5-UTPs were pulsed together using method 1. For TC counting experiments, method 2 was used to label TCs. Cells were then washed with Dulbecco’s modified Eagle’s medium and incubated with 5% FBS at 37°C in 5% CO2 for 20 min before imaging. A similar procedure was followed for dual labeling in laminB1-depleted cells.
HeLa wild-type cells grown on coverslip-bottomed plates were fixed in 4% paraformaldehyde for 15 min at room temperature. The cells were permeabilized using 0.2% Tween20 and were then incubated in blocking reagent (5% BSA in PBS) for ∼1 h. The cells were then treated with primary antibody diluted in blocking reagent for 1 h at room temperature followed by secondary antibody diluted in blocking reagent for 1 h at room temperature. The cells were stained with 100 ng/ml Hoescht 33258 (Sigma-Aldrich) for 10 min and then washed in PBS, mounted in antifade Vectashield (Vector Labs, Burlingame, CA), and imaged. The primary antibody used to mark the transcriptionally active CTD phosphorylated RNA pol II was ab5131 (Abcam, Cambridge, UK).
Live-cell imaging and single-particle tracking
Live-cell confocal time lapse of single-plane TCs or Z-stacks of TCs was performed on a Zeiss LSM 510 scanning confocal microscope using 63×, 1.4 NA objective, or on a Nikon A1R confocal microscope using 100×, 1.4 NA objective. The H2BEGFP, Alexa546-UTP, and/or Cy5-UTPs were imaged in sequential mode to avoid spectral cross talk. For fast tracking at 40-ms resolution, an Ixon 887BV EMCCD (Andor, Belfast, Ireland) mounted on an inverted microscope (IX81, Olympus, Tokyo, Japan) was used. Single-particle tracking analysis of TCs was done by a custom written routine in Labview.
Photobleaching experiment
TCs dual-labeled with Alexa546- and Cy5-UTPs in HeLa H2BEGFP cells were bleached continuously for 2 s repeatedly after every 16 s, during which the intensity image was acquired for both Alexa546- and Cy5-UTPs using a 633 laserline on a Zeiss LSM 510 scanning confocal microscope. The fluorescence intensity for Alexa546-UTP, Cy5-UTP, and H2BEGFP was then recorded. The mean fluorescence of Cy5 was computed taking Alexa546 as a spatial reference.
Anisotropy imaging of chromatin and TCs
The fluorescence anisotropy images were obtained using a split-chip module mounted in front of the EMCCD camera. Linearly polarized beam was obtained by passing the mercury arc lamp beam through a sheet polarizer (New Focus; Newport, Santa Clara, CA). The H2BEGFP nuclei and the TCs were excited using excitation filters 445/30×) and 475/30× (Chroma Technology, Rockingham, VT), and emissions were collected using 535/50M (Chroma) and BA590 (Olympus) emission filters, respectively. The parallel and perpendicular images were then acquired on two halves of the EMCCD using a custom program written in LabVIEW. The original images were spatially smoothened and the pixel-wise anisotropy was calculated using
where and are the intensities on a pixel in the parallel and perpendicular images, respectively, and g is the factor used to correct for differences in the sensitivity of the detection system for the parallel and perpendicular components of light. The color-coded anisotropy profiles, mean anisotropies of TCs, and chromatin at the vicinity were calculated and plotted using a custom MATLAB program (The MathWorks, Natick, MA).
Fluorescence correlation spectroscopy
Fluorescence correlation spectroscopy (FCS) measurements were performed using a Carl Zeiss LSM710 confocal microscope equipped with the ConfoCor III attachment and C-Apochromat 40×/NA=1.2 water immersion objective (Carl Zeiss, Oberkochen, Germany). The cells were maintained in a stage-top incubator (INUG2, Tokai Hit, Shinzuoka-ken, Japan) on the microscope with 37°C temperature and 5% CO2 concentration. H2BEGFP expressing HeLa cells labeled with fluorescent UTPs using Alexa546-UTP were imaged first with the LSM710 in a sequential mode, and then five to six positions were chosen within the nucleoplasm to perform point-detection FCS measurements. Alexa546-UTP was excited at 543 nm with 10 μW laser power, and emission was collected at 560–610 nm. The FCS-measurement positions were carefully chosen in such as way as to avoid directly focusing on the TCs, as the relatively immobile TCs would be quickly photobleached. FCS measurements at each position lasted for 10–30 s and were averaged over five readings. The experimental FCS curves were fitted with a three-dimensional, one-particle, one-triplet anomalous diffusion model as shown below:
where N is the average number of particles in the effective volume; F is the triplet fraction; τtrip is the triplet lifetime; τd is the diffusion time; α is the anomality factor, and ω0 and ωz are the lateral and axial radii of the effective volume. The obtained diffusion times (τd) were used to calculate its diffusion coefficient and then to determine the sizes of the UTP aggregates to generate the distribution histogram. The size of the effective volume was predetermined by measuring dyes with known diffusion coefficient (17), and the ω0 was determined to be 0.25 μm for both 488-nm and 543-nm excitation with laser power of 10 μW.
Results and Discussion
Transcription compartments partially colocalize with phosphorylated RNA pol II
The UTP-enriched compartments (TCs) were labeled with Alexa546-UTPs which were permeabilized into HeLa cell nuclei. These UTPs formed distinct foci within the nucleus that could be fluorescently imaged, making it possible to visualize them (Fig. 1 A). This method was used to successfully mark TCs in multiple cell types (CHO and NIH3T3) cells, as discussed later. To probe the transcriptional relevance of these UTP-enriched foci, colocalization analyses were carried out in HeLa cells using immunolabeling of transcriptionally active phosphorylated RNA pol II (phospho S5CTD) and UTP-enriched foci (Fig. 1, A and B). To quantitatively assess the colocalization of TCs and RNA pol II, the images of RNA pol II and TCs were thresholded above mean RNA pol II intensity or at twice the mean UTP intensity, respectively. The fraction of UTP pixels that also contained the RNA pol II intensity after its respective thresholding was considered to be colocalized. Similar analysis was also carried out on cells treated with α-amanitin (20 μg/ml for 1 h) and DRB (40 μM for 1 h) for transcription inhibition. Although ∼53 ± 6% TCs were seen to colocalize with active RNA pol II in controls, in cells treated with α-amanitin and DRB, the colocalization was reduced to ∼12 ± 3% and ∼6 ± 2%, respectively (Fig. 1 C). The reduced colocalization of TCs with RNA pol II is a result of a decrease in phosphorylated RNA pol II with increasing concentration of transcription inhibitor α-amanitin (Fig. S1). Since the labeling efficiency of TCs is low after the addition of transcription inhibitor (Fig. 1 C and Materials and Methods), colocalization analysis was carried out with prelabeled TCs and subsequent addition of α-amanitin or DRB. The global chromatin decondensation with histone deacetylase inhibitor, TSA treatment led to an increase in phosphorylated RNA pol II but had no influence on its colocalization with TC (Fig. S1). These observations indicate that the current method of labeling TCs shows the specificity of the UTP labels to mark the fraction of transcriptionally active foci.
Figure 1.
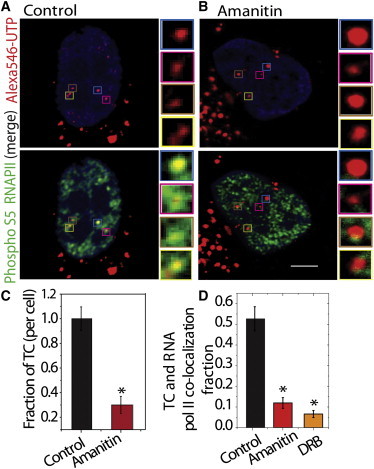
TCs are transcription-dependent compartments in the nucleus. (A and B) Nuclear Alexa546-UTP (red)-enriched TCs colocalized with Alexa488 antibody (green) against active RNA pol II (phosphorylated S5) in fixed untreated HeLa cells (A) and in α-amanitin-treated cells (20 μg/ml for 1 h) with DNA marked with Hoescht (blue) (B). DNA was marked by Hoescht to determine the nuclear boundary. (C) Quantification of TCs using Alexa546-UTP with and without 1 h treatment of α-amanitin (20 μg/ml) for N ∼ 30 cells. (D) Quantification of colocalization fraction between active RNA pol II and Alexa546-UTP in untreated 1 h treatment of α-amanitin (20 μg/ml) or DRB (40 μM). ∗P < 0.05. Scale bar, 5 μm.
TCs exhibit transcription-dependent uptake of UTPs
The reduced TC count in transcription-inhibited states suggests a decreased labeling efficiency of TCs in α-amanitin treatment (Fig. 1 C). To test whether the reduced labeling efficiency in the case of the transcription-inhibited state is the result of reduced UTP uptake, photobleaching experiments were carried out. TCs were dual-labeled by Cy5-UTP and Alexa546-UTP, both with and without transcription inhibition to further study the dynamic exchange of UTPs (Materials and Methods). Here, Cy5-UTP was bleached in a stepwise manner by 633 nm laser excitation, whereas Alexa-546 UTP was used as a spatial reference. Stepwise bleaching protocol included 2 s of bleach, imaging, and a wait time of 14 s, and this was repeated for 16 cycles for each TC measurement. The mean fluorescence intensities of the Cy5-UTPs were monitored in real time. As shown in Fig. 2, the mean intensities of UTP, averaged for independent photobleaching cycles of ∼15 TCs in different cells, revealed a larger decrease in α-amanitin-treated cells compared to control cells. The mean UTP intensities in cytoplasmic aggregates, in both control and α-amanitin-treated cells, did not show any significant change, suggesting a faster exchange rate of UTPs, which remain unperturbed by specific inhibition of nuclear RNA polymerase by α-amanitin treatment. The average intensity of the cytoplasm was also observed to be higher than that of the surrounding nucleoplasmic intensity, as seen in the representative collage of cytoplasmic UTP aggregates and nuclear TCs. Photobleaching results confirm that the UTP exchanges at TCs are largely regulated by their transcriptional states. The decreased uptake of labeled UTPs by TCs explains the decrease in TC count if cells pretreated with α-amanitin are subsequently labeled with fluorescent UTPs. In the next section, we study the coupling between TCs and local chromatin structure.
Figure 2.
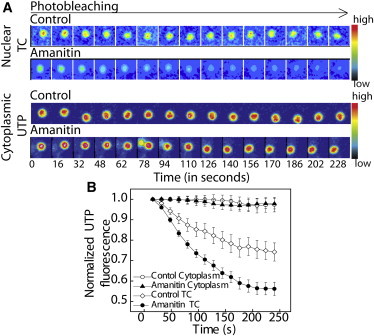
UTP uptake by TCs depends on the transcription state. (A) Collage of the nuclear TCs and the cytoplasmic UTP foci labeled with Cy5-UTP, which was sequentially photobleached with a 635 laser. The color bar shows the intensity normalized for the complete time series. (B) Graph of the mean intensity of Cy5-UTP in TCs normalized to the first frame of imaging plotted for TCs in nucleus in control and α-amanitin-treated cells (20 μg/ml for 1 h). Intensities measured in the cytoplasmic mitochondrial aggregates of UTP were insensitive to α-amanitin treatment.
Functional interaction between TCs and local chromatin structure
Fluorescence anisotropy images were acquired for both the H2BEGFP and TCs to further characterize the functional coupling between transcriptional activity of TCs and local chromatin compaction states. This imaging method distinguishes between free and oligomerized UTP states based on its rotational diffusion. The anisotropy values for free UTPs in solution, outside cells (∼0.05), in nucleus (∼0.07), and incorporated within TCs (∼0.14) suggest oligomerized states of UTP in a typical cell nucleus (Fig S2 A). TCs were seen to be present predominantly in regions of low H2BEGFP anisotropy in controls, as shown in the typical line profiles and color-coded images of TC and H2BEGFP anisotropy, r (Fig. 3, A and B, control). The typical line profiles of anisotropy in Fig. 3, B and D, show absolute anisotropy values. Multiple line profiles across the TCs were aligned for the centroid of TC and normalized with a minimum anisotropy value of H2BEGFP or TC to zero for compiling in a single plot (Fig. S2, C–F). The line profiles of H2BEGFP show a predominant dip at the centroid of TCs in controls, whereas in α-amanitin treatment, the centroid of TCs shows increased incidence of compaction, signified by a rise in the H2BEGFP anisotropy. The difference between the mean anisotropy of the TCs or chromatin at the transcription foci and in other regions surrounding the TC (Δr), respectively, was quantified over multiple cells (Fig. 3 E). The decompacted chromatin structure in the transcriptionally active regions is also evident by a negative shift of the mean Δr value of H2BEGFP anisotropy in controls in Fig. 3 E. These results are consistent with reports of hyperacetylated, decondensed chromatin present at the active transcription sites (18,19). On the other hand, line profiles (Fig. S2) and color-coded image for α-amanitin-treated cells shows an increase in the H2BEGFP anisotropy at the vicinity of TCs, suggesting a condensed state of chromatin in the transcriptionally repressed region (Fig. 3, C and D, α-amanitin). However, anisotropy profiles of TCs appear to be unchanged in either transcriptionally active or repressed states, suggesting structural integrity of preformed TCs (20). The inhibitor (α-amanitin) treatment increased the chromatin condensation at TCs, as seen by changes in the standard deviation in the H2BEGFP anisotropy histogram in Fig. 3 E, which is moved toward the positive Δr value with respect to the control Δr value histogram for H2BEGFP anisotropy. The mean Δr value of H2BEGFP anisotropy in controls (Fig. 3 E, black line) was also less than that of α-amanitin treatment, revealing decondensation (Fig. 3 E, red line) at TCs in controls. These observations thus revealed a functional coupling between the chromatin compaction state and transcriptional activity of TCs. In addition, the higher anisotropy values of fluorescent UTPs obtained in the nucleoplasm suggested the presence of a pool of small TCs in the nucleoplasm. These structures could be transcriptlike aggregates incorporating fluorescent UTPs.
Figure 3.
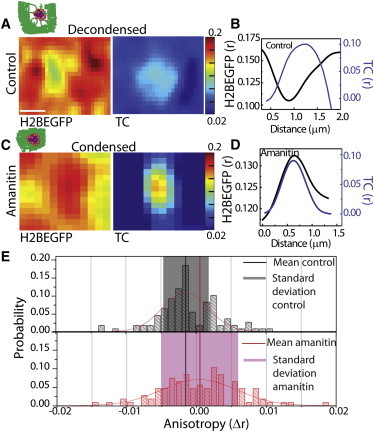
Functional coupling of TCs with chromatin. (A and B) Representative color-coded anisotropy map of decondensed chromatin (A) and line profile of the absolute value of anisotropy (r) of the Alexa546-UTP-labeled TC and H2BEGFP, plotted for lines passing through the centroid of TCs (B) for untreated control HeLa cells. Scale bar in A, 0.5 μm. (C and D) Representative color-coded anisotropy maps of condensed chromatin (C) and line profiles of anisotropy of the Alexa546-UTP labeled TCs and H2BEGFP (D) for α-amanitin-treated cells (20 μg/ml for 1 h). (E) Distribution of Δr for H2BEGFP in control and α-amanitin-treated cells. The highlighted region indicates the standard deviation of the distributions, and the black and red vertical lines represent the mean Δr of control and α-amanitin treated cells, respectively.
UTP-enriched RNA assemblies exhibit a broad size distribution
In the next step, we used fluorescence correlation spectroscopy (FCS) to measure hydrodynamic volumes of smaller TC aggregates not visible by light microscopy (Fig. 4 A). FCS raw intensity profiles were measured at similar gains and laser powers in nucleoplasm for control conditions (for ∼25 independent FCS readings). In α-amanitin treatment, most of the UTPs in the nucleus remained unincorporated, similar to UTPs in solution. Fig. 4 B shows a bimodal distribution of TC aggregates in the case of nucleus in controls, where both free and incorporated UTPs are present, whereas the cytoplasmic fraction remains relatively unchanged. From the Stokes-Einstein relation (D = kT/6πηr, where D is the diffusion coefficient, K the Boltzmann constant, T the absolute temperature, η the viscosity of the medium, and r the hydrodynamic radius of the diffusing molecule), the diffusion coefficient of TC aggregates is inversely proportional to its hydrodynamic radius. The hydrodynamic volume was computed using the autocorrelation timescales (Fig. 4 C) and previously reported viscosities of the nucleoplasm of HeLa cells at 37°C (1.4 mPas) (21). As a control, with our measured correlation timescales of EGFP molecules (245 ± 27 μs) yielded a hydrodynamic radius of 2.5 nm, in agreement with earlier reported values (22). The distribution histogram of TC aggregates was fitted with a Gaussian profile to obtain their average sizes (Fig. S3). The average size of TC aggregates, obtained using FCS experiments, was found to be ∼1.6 nm (control), ∼1.85 nm (α-amanitin) and ∼1.5 nm (DRB), whereas the size of free UTPs was observed to be ∼0.9 nm. The transcription-initiation inhibition by α-amanitin could still lead to elongation of transcripts, leading to accumulation of larger aggregates; on the other hand, DRB led to accumulation of smaller nascent transcripts that could not elongate further. FCS could thus identify a transcription-dependent pool of mobile TC aggregates in the nucleus (Fig. 4 D). It should be noted that several UTP aggregate outliers with sizes >10 nm that were excluded from the histogram will also contribute to the total number of TC aggregates. The FCS experiments further prove the incorporation of labeled UTPs into transcripts, populating both nucleoplasm and cytoplasm. The experiments till now revealed that UTP incorporation resulted in marking of a broad size distribution and dynamic pool of TCs in a transcription-dependent manner.
Figure 4.
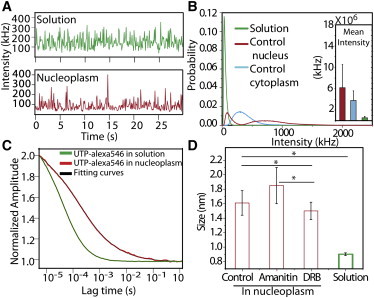
Fluorescent UTPs get incorporated into transcript like RNA aggregates. (A) Raw intensity plots of Alexa546-UTP obtained by FCS measurement in nucleoplasm (red) and in 5 μM solution of Alexa546-UTP (green). (B) Normalized intensity histogram from FCS intensity profiles (pooled from ∼25 independent FCS readings) in Alexa546-UTP in solution, nucleus, and cytoplasm of untreated cells. (C) Fluorescence correlation curves plotted as normalized amplitude and their respective fits with a three-dimensional one-particle anomalous model for Alexa546-UTP in solution and nucleoplasm. (D) Quantification of the mean size of UTP aggregates, estimated from mean correlation time for solution and nucleoplasm (in control and transcription inhibited states) where N ∼ 600 in control and DRB treatment, and N ∼ 500 FCS readings in α-amanitin treatment. ∗P <0.05.
Mobility of TCs is dependent on functional nuclear architecture
In an earlier report, we presented preliminary evidence of the dynamic organization of TCs. Live-cell imaging was carried out to explore the functional coupling between TC dynamics and three-dimensional nuclear architecture. Time-lapse images of TCs and H2BEGFP at 5–7 s/frame (∼0.2 Hz) lasting ∼20 min (Movie S1 and Fig. 5 A) for computing the mean-square displacement (MSD) and ∼60 min at 37°C were obtained (Fig. S4). The inset in Fig. 5 A shows a typical TC trajectory merged with the corresponding image of an H2BEGFP-marked nucleus, revealing their confined dynamics in the interchromatin regions. In addition, long-term imaging (>60 min) also revealed that the same TCs switch between confined and mobile regimes (Fig. 5 A). TCs were confined for an average residence time of ∼20 min, which can be an important temporal window in which to interact with the chromatin for initiating transcription or mRNA processing like splicing (Fig. 5 A). Subsequently, they were seen to switch to a mobile domain. The MSD (, where D is the diffusion constant, τ the time interval) was calculated. The superscript α, which depicts the nature of diffusion, was determined by finding the slope of the line fitted to log MSD against τ. Calculation of α values reveal two different dynamics of TCs: 1), confined chromatin regions where they were subdiffusive (α < 0.8); and 2), mobile regions, where they were either normal (0.8 < α < 1.2) or superdiffusive (α > 1.2). TC mobility, analyzed in multiple cell types, revealed similar dynamics (Fig. S6). TCs were largely subdiffusive in all cell types, showing a natural clustering of α values in different classes of diffusion. TC dynamics was further seen to be subdiffusive at 25°C (Fig. 5 A), indicating the role of temperature-dependent active processes underlying their dynamic organization. Inhibition of transcription by α-amanitin and DRB also resulted in a significant fraction of TCs that exhibited superdiffusive transport, evidenced by an increased fraction of superdiffusive TCs (Fig. 5 D and Fig. S7). Interestingly, the fraction of TCs colocalized with RNA pol II is less in DRB than in α-amanitin which corroborates the observed larger decrease in mobile fraction of TCs in DRB treatment compared to α-amanitin treatment (Fig. 1 D). These results suggest a stronger evidence for the presence of inactive RNA pol II in mobile fractions of TCs. The lower mobility of TCs in transcriptionaly active state can be the result of association with active RNA pol II at transcriptionaly active genes, which leads to formation of nascent transcripts and hence the TC.
Figure 5.
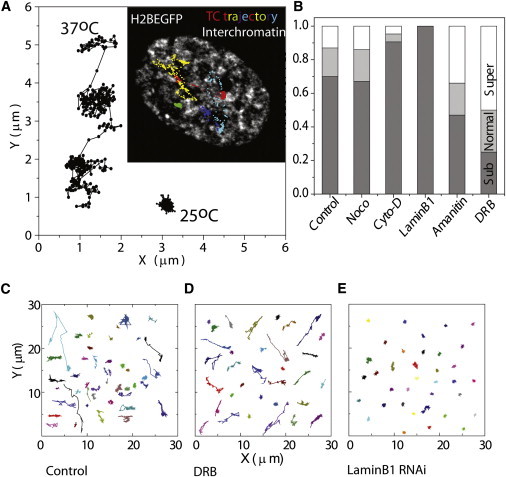
TCs are dynamic in interchromatin territories. (A) TCs labeled with Alexa546-UTP in live HeLa H2BEGFP cells and imaged at 1 frame/6 s for 60 min at a single confocal plane at 37°C and 25°C. (Inset) Merge of trajectories (in color) for centroid positions of five TCs; H2BEGFP shown in gray for HeLa cells imaged at 37°C. Scale bar, 5 μm. (B) Fraction of TCs in normal diffusion, subdiffusion, and superdiffusion according to the α values computed from the MSD of TC trajectories in cells treated with inhibitors perturbing the cytoskeleton, transcription, or nuclear organization for N > 30 TCs in multiple cells. (C) Trajectory of the centroid position of TCs imaged at 1 frame/6 s at 37°C (Control), DRB treatment (D), and laminB1-depleted cells (E).
TCs are mobile in the interchromatin territories of nucleus. Structure of these interchromatin regions is closely coupled to the architecture of the surrounding chromatin. To explore the effect of changes in nuclear architecture on TC dynamics, inhibitors were used to perturb the chromatin and cytoskeletal proteins (Fig. 5 B). Cytoskeletal proteins are known to anchor nuclear membrane and maintain nuclear morphology (23). On treatment with cytochalasin D (an actin-depolymerizing agent), the fraction of TCs showing subdiffusive movement increased, whereas inhibition of microtubule polymerization by nocodazole led to marginal changes in the distribution of α values (Fig. 5 B, Fig. S4, and Fig. S7). An earlier report showed that the nuclear size was determined by actin contractility and microtubule organization, where inhibitors of actin polymerization decreased nuclear size but inhibitors of microtubule dynamics increased nuclear size (24). Interestingly, TC dynamics are sensitive to cytoskeleton perturbations, where cytochalasin D treatment resulted in more confined mobility compared to control cells. As actin perturbations led to changes in nuclear morphology and movement of TCs, we investigated the role of the nucleoskeletal protein laminB1 in TC movement. LaminB1 is known to interact with the heterochromatin (25), position chromosomes, and play a critical role in maintaining nuclear organization and regulating transcription in differentiated mammalian cells (26). TCs were visualized in HeLa cells depleted of laminB1 using siRNA (Fig. S5). Though the organization of TCs did not change, slow tracking of TCs at 37°C in laminB1-depleted cells revealed a complete stalling of TC mobility (Movie S2 and Fig. 5, B and E) as compared to untreated cells (Fig. 5 C). These experiments suggested that the role of nuclear architecture, which is maintained by laminB1, cytoskeletal connections to nuclear membrane, and transcriptional activity, is key in active regulation of TC dynamics.
To further resolve the interaction of TCs with the nuclear architecture in confined chromatin regions, as observed in slow TC tracking, wide-field fast imaging of TC mobility was carried out at 40-ms intervals for 100 s at 37°C (Fig. 6 A). This revealed stepping dynamics of TCs in the larger confined regions. The step size of the smaller domains of residence was calculated by binning the trajectory points in both the x and y dimensions to identify the domains, and the peak of the two-dimensional histogram was plotted as the centroid of the domains. Mean step size was computed from the distance between centroids of consecutive domains for different conditions. In the case of TCs showing only one domain of residence, the spread of the domain was quantified by finding the variance of the Gaussian distribution fitted to the distance histogram of the trajectory points. The average step size was found to be ∼210 nm in HeLa cells at 37°C (Fig. 6 C), which decreased to ∼135 nm at 25°C (Fig. 6, B and D). Treatment with TSA (a histone deacetylase inhibitor that decompacts chromatin) (18,19) further reduced the step size to ∼110 nm, whereas early S-phase arrest using aphidicolin treatment increased the mean step size to ∼390 nm (Fig. 6 E and Fig. S8). This observed dependence of the step size on temperature and inhibitor treatment indicates that the dynamics of TCs in the stepping domains is largely regulated by the chromatin and nuclear mesh sizes underneath: although lowering the temperature and TSA treatment may shrink the mesh, aphidicolin treatment perhaps loosens it. Our observed nuclear mesh sizes were similar to those reported using single-particle tracking methods using passive 100-nm colloidal particles (27).
Figure 6.
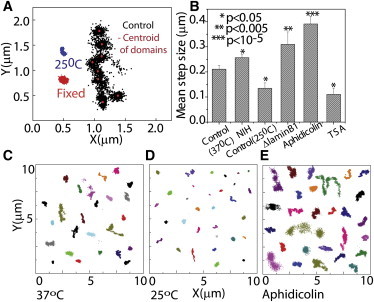
TCs interact with local chromatin mesh. (A) TCs were labeled in live HeLa H2BEGFP cells and imaged at 1 frame/40 ms for 100 s at physiological conditions. Trajectory points of centroid positions of TCs imaged at 37°C (control cells), 25°C (NIH3T3 cells), and paraformaldehyde-fixed cells. The peak of the two-dimensional histogram of the xy trajectories was plotted as the centroid of the domains (plotted in red over the black points of the trajectory). (B) Mean step size computed from the distance between centroids of consecutive domains for different conditions, for N > 30 TCs in multiple cells. Collage of xy trajectories of TCs at 37°C (C) and 25°C (D), and in aphidicolin-treated cells (E). ∗P < 0.05.
Conclusion
In this work, we analyzed the static and dynamic states of TCs within living cells using high-resolution imaging methods. The incorporation of fluorescence-labeled UTPs into TCs was found to be transcription-dependent and allowed a detailed characterization of colocalization of TCs with active RNA pol II and with chromatin assembly. Based on our observations, we propose a schematic description (Fig. 7) for the spatiotemporal organization of TCs in a transcription-dependent manner. The fluorescently labeled UTPs get incorporated into higher order RNA assemblies structures that are found in a heterogeneous size distribution in the nucleus ranging from a few to hundreds of nanometers, consistent with the presence of mRNP complexes in nucleoplasm (28,29). A fraction of these enriched UTP sites colocalized with phosphorylated RNA pol II, suggesting the sequestration of UTPs into nascent transcripts at these sites. Corroborating this, transcription inhibition resulted in a reduction of the UTP uptake rate, colocalization with active RNA pol II, and the number of TCs. In addition, the chromatin condensation states at these sites, measured using H2BEGFP anisotropy, were transcription-dependent. The fractions of TCs that did not colocalize with phosphorylated RNA pol II could be nascent transcripts at various stages of maturation with varying sizes of fluorescently labeled UTP aggregates in both nucleus and cytoplasm. This was consistent with FCS experiments that showed transcription-dependent UTP aggregate sizes.
Figure 7.
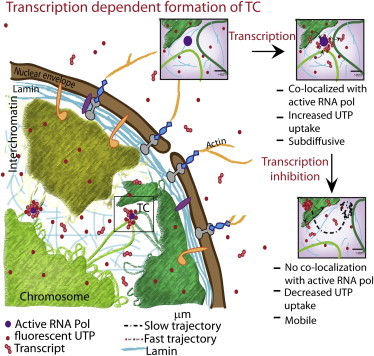
Model of a dynamic UTP-enriched TC. The schematic shows that labeled UTPs mark both transcription sites and nascent transcripts. (Insets) Labeling of TCs depends on transcription, where the TCs colocalize with transcriptionally active RNA pol II; with transcription inhibition, colocalization with RNA pol is reduced and the TCs become more mobile. The mobility of these TCs further depends on the nuclear mesh of chromatin and laminB1.
Studies have revealed that chromosomes occupy discrete, nonrandom positions in the nucleus (30) and that the interchromatin spaces are characterized by relatively less dense chromatin comprised of active gene loops (1,31,32) and nuclear bodies (33). In line with these findings, our time-lapse imaging experiments exhibited dynamic organization of TCs in interchromatin regions, transitioning between subdiffusive and superdiffusive transport. Interestingly, this diffusive behavior was transcription-dependent, as the addition of α-amanitin or DRB resulted in an increased mobile fraction of TCs. However, it is still unclear whether the mobile fractions of TCs that we measure are comprised of active polymerase machinery. The dynamics of TCs was also regulated by the underlying mesh structures, since perturbations to the nucleoskeleton altered the mobile fractions of TCs. Further single-particle analysis revealed hopping behavior in TC mobility, suggesting the role of nuclear mesh in the dynamic organization of TCs. The step sizes of ∼200 nm obtained by our analysis were similar to chromatin mesh sizes measured using particle rheology (27) and electron microscopy experiments (34). Taken together our results provide transcription-dependent enrichment of TCs, local interaction of TCs with chromatin assembly, and dynamic coupling of TC organization to functional nuclear architecture.
Acknowledgments
We thank Michelle Wang for useful discussions during preparation of the manuscript. We also thank NCBS common imaging and flow facility and MBI imaging core facility for providing resources to carry out the imaging experiments.
This work was funded in part by India’s Department of Science and Technology nanoscience initiative and by the Mechanobiology Institute, Singapore. S.M. was awarded a doctoral fellowship by the Council of Scientific and Industrial Research, India, and D.S. was supported by a postdoctoral fellowship from the Department of Biotechnology in India.
Supporting Material
References
- 1.Cremer T., Cremer C. Chromosome territories, nuclear architecture and gene regulation in mammalian cells. Nat. Rev. Genet. 2001;2:292–301. doi: 10.1038/35066075. [DOI] [PubMed] [Google Scholar]
- 2.Lanctot C., Cheutin T., Cremer T. Dynamic genome architecture in the nuclear space: regulation of gene expression in three dimensions. Nat. Rev. Genet. 2007;8:104–115. doi: 10.1038/nrg2041. [DOI] [PubMed] [Google Scholar]
- 3.Misteli T. Beyond the sequence: cellular organization of genome function. Cell. 2007;128:787–800. doi: 10.1016/j.cell.2007.01.028. [DOI] [PubMed] [Google Scholar]
- 4.Spector D.L. Nuclear domains. J. Cell Sci. 2001;114:2891–2893. doi: 10.1242/jcs.114.16.2891. [DOI] [PubMed] [Google Scholar]
- 5.Gorisch S.M., Wachsmuth M., Lichter P. Nuclear body movement is determined by chromatin accessibility and dynamics. Proc. Natl. Acad. Sci. USA. 2004;101:13221–13226. doi: 10.1073/pnas.0402958101. [DOI] [PMC free article] [PubMed] [Google Scholar]
- 6.Platani M., Goldberg I., Swedlow J.R. Cajal body dynamics and association with chromatin are ATP-dependent. Nat. Cell Biol. 2002;4:502–508. doi: 10.1038/ncb809. [DOI] [PubMed] [Google Scholar]
- 7.Verschure P.J., van Der Kraan I., van Driel R. Spatial relationship between transcription sites and chromosome territories. J. Cell Biol. 1999;147:13–24. doi: 10.1083/jcb.147.1.13. [DOI] [PMC free article] [PubMed] [Google Scholar]
- 8.Osborne C.S., Chakalova L., Fraser P. Active genes dynamically colocalize to shared sites of ongoing transcription. Nat. Genet. 2004;36:1065–1071. doi: 10.1038/ng1423. [DOI] [PubMed] [Google Scholar]
- 9.Fraser P., Bickmore W. Nuclear organization of the genome and the potential for gene regulation. Nature. 2007;447:413–417. doi: 10.1038/nature05916. [DOI] [PubMed] [Google Scholar]
- 10.Iborra F.J., Pombo A., Cook P.R. Active RNA polymerases are localized within discrete transcription "factories” in human nuclei. J. Cell Sci. 1996;109:1427–1436. doi: 10.1242/jcs.109.6.1427. [DOI] [PubMed] [Google Scholar]
- 11.Jackson D.A., Hassan A.B., Cook P.R. Visualization of focal sites of transcription within human nuclei. EMBO J. 1993;12:1059–1065. doi: 10.1002/j.1460-2075.1993.tb05747.x. [DOI] [PMC free article] [PubMed] [Google Scholar]
- 12.Papantonis A., Cook P.R. Genome architecture and the role of transcription. Curr. Opin. Cell Biol. 2010;22:271–276. doi: 10.1016/j.ceb.2010.03.004. [DOI] [PMC free article] [PubMed] [Google Scholar]
- 13.Yao J., Munson K.M., Lis J.T. Dynamics of heat shock factor association with native gene loci in living cells. Nature. 2006;442:1050–1053. doi: 10.1038/nature05025. [DOI] [PubMed] [Google Scholar]
- 14.Shevtsov S.P., Dundr M. Nucleation of nuclear bodies by RNA. Nat. Cell Biol. 2011;13:167–173. doi: 10.1038/ncb2157. [DOI] [PubMed] [Google Scholar]
- 15.Mao Y.S., Sunwoo H., Spector D.L. Direct visualization of the co-transcriptional assembly of a nuclear body by noncoding RNAs. Nat. Cell Biol. 2011;13:95–101. doi: 10.1038/ncb2140. [DOI] [PMC free article] [PubMed] [Google Scholar]
- 16.Sinha D.K., Banerjee B., Shivashankar G.V. Probing the dynamic organization of transcription compartments and gene loci within the nucleus of living cells. Biophys. J. 2008;95:5432–5438. doi: 10.1529/biophysj.108.135921. [DOI] [PMC free article] [PubMed] [Google Scholar]
- 17.Ruttinger S., Buschmann V., Koberling F. Comparison and accuracy of methods to determine the confocal volume for quantitative fluorescence correlation spectroscopy. J. Microsc. 2008;232:343–352. doi: 10.1111/j.1365-2818.2008.02105.x. [DOI] [PubMed] [Google Scholar]
- 18.Banerjee B., Bhattacharya D., Shivashankar G.V. Chromatin structure exhibits spatio-temporal heterogeneity within the cell nucleus. Biophys. J. 2006;91:2297–2303. doi: 10.1529/biophysj.105.079525. [DOI] [PMC free article] [PubMed] [Google Scholar]
- 19.Toth K.F., Knoch T.A., Rippe K. Trichostatin A-induced histone acetylation causes decondensation of interphase chromatin. J. Cell Sci. 2004;117:4277–4287. doi: 10.1242/jcs.01293. [DOI] [PubMed] [Google Scholar]
- 20.Mitchell J.A., Fraser P. Transcription factories are nuclear subcompartments that remain in the absence of transcription. Genes Dev. 2008;22:20–25. doi: 10.1101/gad.454008. [DOI] [PMC free article] [PubMed] [Google Scholar]
- 21.Liang L., Wang X., Chen W.R. Noninvasive determination of cell nucleoplasmic viscosity by fluorescence correlation spectroscopy. J. Biomed. Opt. 2009;14:024013. doi: 10.1117/1.3088141. [DOI] [PubMed] [Google Scholar]
- 22.Hink M.A., Griep R.A., Visser A.J. Structural dynamics of green fluorescent protein alone and fused with a single chain Fv protein. J. Biol. Chem. 2000;275:17556–17560. doi: 10.1074/jbc.M001348200. [DOI] [PubMed] [Google Scholar]
- 23.Shivashankar G.V. Mechanosignaling to cell nucleus and gene regulation. Annu. Rev. Biophys. 2011;40:361–378. doi: 10.1146/annurev-biophys-042910-155319. [DOI] [PubMed] [Google Scholar]
- 24.Mazumder A., Shivashankar G.V. Emergence of a prestressed eukaryotic nucleus during cellular differentiation and development. J. R. Soc. Interface. 2010;7(Suppl 3):S321–S330. doi: 10.1098/rsif.2010.0039.focus. [DOI] [PMC free article] [PubMed] [Google Scholar]
- 25.Ye Q., Callebaut I., Worman H.J. Domain-specific interactions of human HP1-type chromodomain proteins and inner nuclear membrane protein LBR. J. Biol. Chem. 1997;272:14983–14989. doi: 10.1074/jbc.272.23.14983. [DOI] [PubMed] [Google Scholar]
- 26.Malhas A., Lee C.F., Vaux D.J. Defects in lamin B1 expression or processing affect interphase chromosome position and gene expression. J. Cell Biol. 2007;176:593–603. doi: 10.1083/jcb.200607054. [DOI] [PMC free article] [PubMed] [Google Scholar]
- 27.Tseng Y., Lee J.S., Wirtz D. Micro-organization and visco-elasticity of the interphase nucleus revealed by particle nanotracking. J. Cell Sci. 2004;117:2159–2167. doi: 10.1242/jcs.01073. [DOI] [PubMed] [Google Scholar]
- 28.Shav-Tal Y., Darzacq X., Singer R.H. Dynamics of single mRNPs in nuclei of living cells. Science. 2004;304:1797–1800. doi: 10.1126/science.1099754. [DOI] [PMC free article] [PubMed] [Google Scholar]
- 29.Siebrasse J.P., Veith R., Kubitscheck U. Discontinuous movement of mRNP particles in nucleoplasmic regions devoid of chromatin. Proc. Natl. Acad. Sci. USA. 2008;105:20291–20296. doi: 10.1073/pnas.0810692105. [DOI] [PMC free article] [PubMed] [Google Scholar]
- 30.Parada L.A., McQueen P.G., Misteli T. Tissue-specific spatial organization of genomes. Genome Biol. 2004;5:R44. doi: 10.1186/gb-2004-5-7-r44. [DOI] [PMC free article] [PubMed] [Google Scholar]
- 31.Cmarko D., Verschure P.J., Fakan S. Ultrastructural analysis of transcription and splicing in the cell nucleus after bromo-UTP microinjection. Mol. Biol. Cell. 1999;10:211–223. doi: 10.1091/mbc.10.1.211. [DOI] [PMC free article] [PubMed] [Google Scholar]
- 32.Branco M.R., Pombo A. Intermingling of chromosome territories in interphase suggests role in translocations and transcription-dependent associations. PLoS Biol. 2006;4:e138. doi: 10.1371/journal.pbio.0040138. [DOI] [PMC free article] [PubMed] [Google Scholar]
- 33.Brown J.M., Green J., Buckle V.J. Association between active genes occurs at nuclear speckles and is modulated by chromatin environment. J. Cell Biol. 2008;182:1083–1097. doi: 10.1083/jcb.200803174. [DOI] [PMC free article] [PubMed] [Google Scholar]
- 34.Solovei I., Cavallo A., Cremer T. Spatial preservation of nuclear chromatin architecture during three-dimensional fluorescence in situ hybridization (3D-FISH) Exp. Cell Res. 2002;276:10–23. doi: 10.1006/excr.2002.5513. [DOI] [PubMed] [Google Scholar]
Associated Data
This section collects any data citations, data availability statements, or supplementary materials included in this article.