

Abstract
Plasticity in ejaculate composition is predicted as an adaptive response to the evolutionary selective pressure of sperm competition. However, to respond rapidly to local competitive conditions requires dynamic modulation in the production of functionally relevant ejaculate proteins. Here we combine metabolic labeling of proteins with proteomics to explore the opportunity for such modulation within mammalian ejaculates. We assessed the rate at which proteins are synthesized and incorporated in the seminal vesicles of male house mice (Mus musculus domesticus), where major seminal fluid proteins with potential roles in sperm competition are produced. We compared rates of protein turnover in the seminal vesicle with those during spermatogenesis, the timing of which is well known in mice. The subjects were fed a diet containing deuterated valine ([2H8]valine) for up to 35 days, and the incorporation of dietary-labeled amino acid into seminal vesicle- or sperm-specific proteins was assessed by liquid chromatography-mass spectrometry of samples recovered from the seminal vesicle lumen and cauda epididymis, respectively. Analyses of epididymal contents were consistent with the known duration of spermatogenesis and sperm maturation in this species and in addition revealed evidence for a subset of epididymal proteins subject to rapid turnover. For seminal vesicle proteins, incorporation of the stable isotope was evident from day 2 of labeling, reaching a plateau of labeling by day 24. Hence, even in the absence of copulation, the seminal vesicle proteins and certain epididymal proteins demonstrate considerable turnover, a response that is consonant with the capacity to rapidly modulate protein production. These techniques can now be used to assess the extent of phenotypic plasticity in mammalian ejaculate production and allocation according to social and environmental cues of sperm competition.
Plasticity in the size and composition of ejaculates is predicted as an adaptive response to the evolutionary selective pressure of sperm competition (1). That is, males should adjust both the overall and relative amount of ejaculate proteins produced to maximize fertilization success in competition with rivals when females mate promiscuously. Adaptive plasticity in sperm production according to perceived levels of sperm competition is now relatively well documented in diverse animal taxa (2–5), including mammals (6). Males typically increase investment in sperm production under conditions where the risk or frequency of female multiple mating is likely to be high. In such cases, males must engage in sperm competition to secure fertilizations, with theory predicting an increased sperm allocation per ejaculate (7, 8). Whether similar adjustments in the absolute and relative production of seminal fluid proteins might also be implemented according to competitive conditions remains largely unknown (but see Refs. 9–11). However, a growing theoretical literature on this issue predicts that such a plasticity could be adaptive (1, 12), and seminal fluid-mediated effects are now known to be critical to various aspects of sexual selection and sexual conflict (13, 14).
Seminal fluid in mammals and other taxa has multiple functions consistent with an influential role in postcopulatory sexual selection, including sperm transport, maintenance of sperm viability, and enhancement of sperm motility and capacitation (13–15). Seminal fluid also contains signaling agents that influence female reproductive physiology and immune responses, with consequences for female-mediated effects on sperm transport, survival, and competence (16). In rodents and other mammals, seminal fluid proteins in the ejaculate become cross-linked soon after ejaculation to form a copulatory plug, reducing the probability of female remating and/or enhancing sperm retention (17) or transport (18). Comparative studies of rodents reveal that a major component of the copulatory plug, SVS2, is evolving rapidly and divergently between species, with changes in molecular mass consistent with selection under sperm competition (6, 19). Additional proteins secreted by rodent seminal vesicles also have properties consistent with a role in sperm competition. For example, SVS4 has immune-modulating and anti-inflammatory properties in the female reproductive tract (20), potentially mediating sexual conflicts over sperm survival (21); SVS2 and Ceacam10 enhance sperm motility (22, 23), whereas SVS1 and SVS3 may act as additional plug components, because they also cross-link in the presence of prostate-derived transglutaminases (24). Given the likely significance of these major seminal fluid proteins in the context of sperm competition, we might therefore expect selection to favor plasticity in their production, so that ejaculate composition can be matched adaptively to competitive conditions.
A key parameter in the plasticity of protein expression is the rate of protein turnover or replacement (25). A protein that changes in abundance quickly must have a high turnover rate to allow rapid and bidirectional adjustment of the protein pool. For intracellular proteins, the rate of replacement is synonymous with the rate of turnover, mediated by intracellular processes. For extracellular secreted proteins, however, after synthesis, proteins are secreted from the cell to the extracellular space, defining irreversible the loss of the protein from the cell. Thus, for proteins such as the seminal vesicle proteins, newly synthesized proteins could accumulate in the seminal vesicle lumen prior to ejaculation and, if these proteins were only removed slowly or upon ejaculation, might not be capable of a rapid change in composition. If the seminal vesicle proteins were retained within the lumen of the gland for an extended period, the opportunities for modulation of protein composition would be limited, and opportunities for adjustment of the composition of the seminal vesicle protein complement would be largely through selective replenishment, postejaculation. If, however, there was a significant irreversible loss of protein from the extracellular pool (even in the absence of ejaculation), the seminal vesicle proteins would be dominated by newly synthesized proteins. In this more dynamic scenario, the composition of the ejaculate could be modulated by the animal in time frames compatible with competitive interactions, prior to copulation.
To assess the potential for plasticity in protein expression within mammalian ejaculates, we examined the rate of metabolic labeling of ejaculate components, achieved by the addition of stable isotope-labeled amino acid in the diet. The rate at which the dietary amino acid is incorporated into the proteins is readily assessed by analysis of peptides, derived from the proteins, by proteomics. For seminal vesicle secretions, proteins that are rapidly synthesized (either by virtue of pool expansion or through rapid turnover) would incorporate label rapidly. By contrast, proteins that are synthesized slowly or retained in the seminal vesicle would not appear to be labeled to the same extent within the same time frame. In this study, we monitor the incorporation of a stable isotope-labeled dietary amino acid into seminal vesicle and sperm proteins. Because the timing of protein expression during spermatogenesis is well known in the mouse (26, 27), examining sperm proteins in addition to seminal vesicle proteins serves to validate our labeling and proteomics workflows and additionally enables us to gauge the relative speed with which the production of seminal fluid proteins could potentially be modulated to alter ejaculate composition. We find that sperm labeling is consistent with known patterns of protein expression during spermatogenesis and that seminal fluid labeling is consistent with rapid turnover of this secretion and thus indicates the potential for rapid dynamic adjustments in ejaculate composition.
EXPERIMENTAL PROCEDURES
Experimental Animals
Subject males (n = 10), aged 11–14 months, were from a colony of wild house mice that had been outbred for six or fewer generations in captivity and originally derived from local populations in Cheshire. Male mice were housed individually in polypropylene cages and given free access to normal laboratory feed. At the start of the experiment, this was substituted for the same diet, based on the 5002 certified rodent diet (pellet form) but supplemented with crystalline [2H8]valine (prepared by International Product Supplies, London) at a quantity equal to the natural valine content of the diet (1.05% (w/w), predominantly protein-bound). At the indicated times (2 days, 1 week, 2 weeks, 3.5 weeks, and 5 weeks) throughout the dietary labeling period, pairs of animals were killed humanely, and the contents of the seminal vesicle (SV)1 and cauda epididymis (predominantly sperm) were recovered for proteomics analysis. Following dissection, seminal vesicle secretions were expelled from the lumen of the left seminal vesicle. To recover mature sperm, the left cauda epididymis was placed in 20 μl of ammonium bicarbonate buffer, and the surface was pierced several times with a scalpel blade to release its contents. Throughout the labeling period, urine samples were collected as a source of major urinary proteins (MUPs). All of the samples were frozen at −80°C until analysis.
Proteomics
All of the samples (sperm preparations and SV, five different labeling times, two animals per time point) were analyzed as tryptic peptides, resolved by high resolution liquid chromatography (Waters nanoAcquity) prior to tandem mass spectrometry, either using a Synapt G1 (Waters) or LTQ-Orbitrap Velos (Thermo). After determination of protein concentration by the Bradford dye-binding method, 100 μg of protein was reduced, alkylated, and digested. Specifically, protein samples were dispersed in 50 mm ammonium bicarbonate buffer containing 0.05% RapiGestTM (Waters), a proprietary surfactant that enhances proteolysis. The samples were reduced with 3 mm dithiothreitol for 10 min at 60 °C and then alkylated for 30 min at room temperature in the dark with 9 mm iodoacetamide. Finally, trypsin (final concentration, 0.01 μg/μl) was added, and the digestion proceeded for 16 h at 37 °C. At the end of the digestion, the reaction was stopped, and the surfactant was inactivated and precipitated by the addition of trifluoroacetic acid to a final volume of 0.5% (v/v). After incubating for 45 min at 37 °C, the samples were clarified by centrifugation at 13,000 × g for 15 min.
Analysis of Urinary MUPs
The collected urine samples were diluted so that ∼10 μg of protein was loaded onto a 15% one-dimensional SDS-PAGE gel and separated over 1 h. Small plugs of gel were excised from the protein band known to represent MUPs in mouse urine. The gel plugs were destained in 50% ACN, subjected to reduction and alkylation, and then dehydrated with ACN before the addition of 10 μl of 25 mm ammonium bicarbonate, containing 0.01 μg/μl trypsin. After overnight incubation at 37 °C, the resulting peptides extracted from the gel plugs were analyzed by MALDI-TOF MS on an Axima TOF2 (Shimadzu). Valine-containing peptides were identified from known MUP sequences, confirmed by the presence of the correct labeling at the later time points (data not shown). The primary use of the MUP data was to assess the precursor pool labeling trajectory, for which divaline peptides are required. Peak intensities of the labeled (HL/LH and HH) valine peaks were recorded. Where HL/LH refers to a divaline peptide with only one labeled amino acid incorporated and HH defines a divaline peptide where both incorporated valine residues are labeled (see later).
For discovery proteomics and for isotope incorporation analysis, virtually all digests were analyzed on a Thermo LTQ-Orbitrap Velos system, the exception being the MUPs, for which isotope incorporation data were obtained by MALDI-TOF analysis of tryptic digests of urinary proteins (MUPs comprise over 99% of mouse urinary protein in the healthy individual). For each digested sample analyzed by LC-MS, 500 ng of protein was injected onto a 75-μm × 150-mm BEH C18 column, and the peptides were resolved over a 90-min linear organic gradient of 3–40% buffer B (0.1% formic acid in acetonitrile). Data acquisition was data-dependent, with the top 20 most intense peptides in each MS scan selected for fragmentation. The raw data collected were processed using default parameters (s/n threshold = 3, minimum peak count = 6) in Proteome Discoverer (Version 1.3, Thermo) and searched against the UniProt Mus database using Mascot (v 2.3.01). The database searched contained 16,367 reviewed Mus (restricted to taxonomy) protein entries from the UniProt database (July 2010). To this, a small number of UniProt unreviewed protein sequences were added that correspond to seminal vesicle proteins previously validated (17). A peptide tolerance of 10 ppm was set, with an MS/MS tolerance of 0.5 Da and modifications of fixed cysteinyl carbamidomethylation and variable oxidation of methionine. Trypsin was the specified enzyme, allowing for one miscleavage and ions scores greater than 18 were accepted for MS/MS identifications (p < 0.05) as suggested by Mascot.
For label-free quantification on the Synapt G1 Q-TOF instrument, a predigested protein standard (rabbit muscle glycogen phosphorylase, UniProt Accession number P00489) was added to the tryptic peptide preparation, such that the final on-column load was 500 ng of digested protein and 50 fmol of protein standard. This permitted label-free quantification of the protein loading using “Hi3,” where the intensities of the three most intense unique peptides per protein are compared with those of the protein standard (28). The peptides were resolved using a nanoAcquity LC system as above. The data were collected with the mass spectrometer in V-mode via MSE (data-independent acquisition) (29), using alternating 1.5 s of low energy and elevated energy scans, with a 0.1-s interscan delay. LC-MS/MS data were processed using ProteinLynx Global Server (version 2.4) software and searched against the same UniProt Mus database. To reduce the protein lists to high confidence data sets, consensus scoring was implemented across the 10 independent biological samples using the Orbitrap data. The high confidence proteins were then examined specifically for recovery of the isotope labeling patterns.
For analysis of proteome dynamics, valine-containing peptides derived exclusively from each protein were selected, and the mass spectrum of each peptide, in [2H8]valine labeled and unlabeled form, was isolated and quantified by relative peak intensity. The [2H8]valine is partially transaminated to [2H7]valine (see below); thus, the labeled peptides attributable to the [2H8]valine and [2H7]valine variants were summed to yield the total pool of labeled protein attributable to synthesis de novo. The intensities of the labeled and unlabeled forms were then used to calculate the relative isotope abundance (RIA) for each protein (30). In most instances, multiple monovaline peptides were used to build the abundance statistic. As the rate of replacement of each protein was tracked over 35 days, using samples from two mice at each of the five time points, there was a good degree of both biological and technical replication.
To calculate the extent of transamination of the labeled valine, the intensities of the overlapping isotope profiles for the mixture of [2H8]valine and [2H7]valine were acquired between M0 (monoisotopic) and M6 (+6 Da). The isotope profile of the peptide was obtained from the MS-Isotope tool (http://prospector.ucsf.edu/prospector/cgi-bin/msform.cgi?form=msisotope) using the amino acid sequence. The optimal combination of the [2H8] and [2H7] profiles was fitted to the experimental data using the nonlinear optimizer within Microsoft Excel (Solver) using the sum of the squares of the residuals between the theoretical and experimental data points as the object function. The only parameter in the optimization was the fraction of [2H7] valine generated by transamination. Optimization was repeated from different starting values of the fractional value, and in all instances, the optimization converged on the same value. A spreadsheet demonstrating the calculation of transamination extent is provided as supplemental File 1.
For the derivation of the turnover parameters, the (RIA, t) data were used in the nonlinear curve fitting package pro Fit (version 6.3; www.quantsoft.com) where the labeling trajectories were specified user functions defined in Python. For the simple rise to plateau, the two parameters were the final RIA (Af) and the first order rate constant for pool turnover (k).
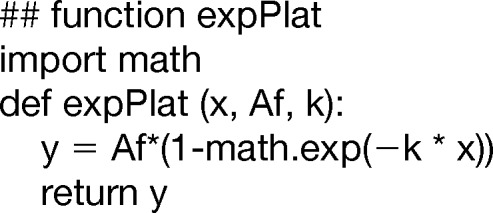 |
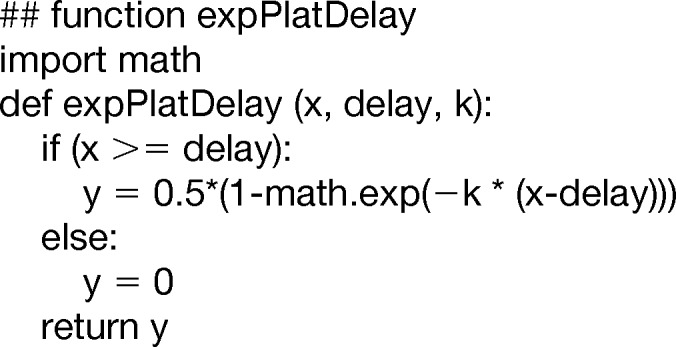
For the more complex behavior exhibited by some of the sperm proteins, the two parameters were the first order rate constant for pool turnover (k) and a term defining the delay before label could appear in the pool (delay). This modification and the conditional statement in the function had the effect of invoking a delay before appearance of the label in the protein. For this analysis, and to avoid over-parameterization of the analysis, we assumed a final RIA value of 0.5, commensurate with the diet design and experimental observations.
 |
RESULTS AND DISCUSSION
Proteomic Analysis of Sperm and Seminal Vesicle Samples
To define the subsets of proteins to be examined in this study, seminal vesicle proteins and sperm proteins were analyzed in a discovery proteomics workflow, although the generation of exhaustive lists of protein identifications was not the intention of this study. In brief, seminal vesicle or sperm samples were analyzed by LC-MS/MS, without any prefractionation, to identify those proteins that were derived from each pool. Those proteins identified by peptides with sufficiently high quality signals to monitor the incorporation of labeled valine were chosen to assess protein dynamics in these samples (see below). We used two mass spectrometric platforms for the discovery phase of the work, an LTQ-Orbitrap Velos and a Synapt G1 Q-TOF. Initial analyses were conducted in a data-dependent acquisition mode (Orbitrap), but for quantitative analyses, we used a data-independent acquisition (MSE on a Synapt Q-TOF instrument). Absolute label-free quantification was achieved using the Hi3 strategy, in which the intensities of the three most abundant peptides are summed and compared with the peptides from a known amount of a standard protein from a heterologous species: in this study, rabbit muscle glycogen phosphorylase (28, 31). The requirement for at least three high quality peptides for identification and quantification is stringent. The high resolution data obtained on the Orbitrap Velos instrument were used to derive further identifications and as a source of high resolution mass spectral data for label incorporation studies.
From the proteome analysis of the two tissue preparations, it was evident that the samples were very different in the profile and abundances of the protein complement (Fig. 1). SDS-PAGE analysis of the seminal vesicle samples yielded a simple protein pattern, comprising no more than 10 visible protein bands, contrasting strongly with the sperm samples that exhibited a complex pattern of bands (Fig. 1b). In the preliminary profiling analyses, greater proteome depth was obtained with the LTQ-Orbitrap Velos instrument. A total of 887 proteins were tentatively identified: 148 in the seminal vesicle preparations and 739 in the sperm samples, although many of these proteins were present at low abundance as evidenced by the low exponentially modified protein abundance index, a form of spectral counting (32). When the list of identified proteins was reduced to those with at least two peptides with a high confidence identification in at least two independent biological samples, the sperm samples yielded 485 proteins, and the seminal vesicle preparations yielded 46 proteins. These high confidence identifications are summarized in supplemental Table 1 together with FDR values for each independent tissue preparation. The stringent requirements associated with label-free quantification using the Hi3 protocol meant that fewer but very confident identifications were obtained from the Synapt G1 analyses.
Fig. 1.

Characterization of proteins in sperm and seminal vesicle preparations. Sperm cauda epididymis washes (Sperm) and seminal vesicle contents (Seminal fluid) were recovered from 10 mice. Samples of each preparation were digested with trypsin and analyzed by LC-MS using MSE data-independent scanning and Hi3 quantification on a Synapt Q-TOF mass spectrometer. Proteins almost exclusive to the seminal vesicle preparations were ranked by abundance, and the independent data set from sperm were similarly ranked; both abundance profiles were expressed as a heat map (a). As expected from the SDS-PAGE profiles of each preparation (b, two different tissue preparations shown for each faction), the degree of complexity of the samples was quite different, with seminal vesicles exhibiting ∼20 proteins above 1 fmol on column, with a few (notably SVS1–SVS5) being expressed at particularly high levels (c).
For both tissue preparations, the equivalent of the digest of 500 ng of protein was resolved on the reversed phase column. Assuming an average protein molecular mass of 50 kDa, this would equate to 10,000 fmol of protein loaded onto the column. The label-free quantification attained by the Hi3 intensity based methodology yielded summed protein loads of 6,500 ± 400 fmol for sperm samples and 7,500 ± 800 fmol for seminal vesicle secretions (means ± S.E., n = 10 in each instance). The combined total of quantified proteins thus matched the anticipated load within reasonable expectations.
The seminal vesicle fluid is a highly biased proteome sample: 18 proteins accounted for virtually all of the protein in the sample, covering a dynamic range of between 3 and 4 orders of magnitude, from 2400 fmol on column for SVS2 (Q62216_MOUSE) to less than 4 fmol (glia-derived nexin, Q07235, GDN_MOUSE; one observation by Q-TOF, but observed in 9/10 Orbitrap runs). Over 44% of the seminal vesicle sample was attributable to three proteins: SVS2 (Q62216_MOUSE), SVS4 (P18419, SVS4_MOUSE), and SVS5 (P30933, SVS5_MOUSE), entirely consistent with our previous analyses on seminal vesicle secretions from a range of muroid rodents (17). Two further seminal vesicle proteins, SVS1 (Q6IMK8, Q6IMK8_MOUSE) and SVS6 (Q64356, SVS6_MOUSE), were each present at approximately 9% of the total protein complement, whereas SVS3 (Q9JKD2, Q9JKD2_MOUSE) and SVS7, also known as prostate- and testis-expressed protein 4 (Q09098, PATE4_MOUSE), were detectable at 6 and 4% respectively. Two Kazal-type serine protease inhibitors, SPIKL (Q8CEK3, SPIKL_MOUSE) and spink3 (P09036, ISK3_MOUSE), plus secreted seminal vesicle Ly-6 protein 1 (Q3UN54, SSLP1_MOUSE) and β2-microglobulin (P01887, B2MG_MOUSE) were all present at ∼1% of the protein pool.
By contrast, the sperm samples were much more complex, and quantitative expression data were obtained for many more proteins (Fig. 1a). Abundant proteins included serum albumin and hemoglobin, present in every sperm preparation at approximately 10% of the total proteins quantified in the sample; these are likely to be interstitial fluid- or blood-derived contaminants, presumably obtained from the epididymal vasculature during dissection to release sperm. The next most abundant protein, A-kinase anchor protein 4 (Q60662, AKAP4_MOUSE), also known as the major fibrous sheath protein, was present at ∼6.5% of the total. Following this, CUB and zona pellucida-like domain-containing protein 1 (P70412, CUZD1_MOUSE), cysteine-rich secretory protein 1 (Q03401, CRIS1_MOUSE), and outer dense fiber protein 1 (Q61999, ODFP1_MOUSE) were present at approximately 5% each, with the sperm-specific lactate dehydrogenase C (P00342, LDHC_MOUSE) at approximately 2%. Below this, the protein profile was extended, with a further 200 proteins extending to quantified values of less than 2 fmol on the column. Many of the proteins identified in the sperm preparations have previously been identified in other sperm studies (33–36), and we used these corroborative data to ensure that we examined the metabolic labeling profiles of true, sperm-specific proteins. From the patterns of proteins, the sperm and seminal vesicle proteins were almost exclusively located to the correct tissue source (Figs. 1a and 2), and when the quantitative data were combined for all samples (n = 10), the pattern of expression was very consistent (Fig. 2). Some of the seminal vesicle proteins were present at very high levels of expression (as would be anticipated from the SDS-PAGE analysis), but the proteins that could be analyzed covered 3 orders of magnitude of expression level. Some seminal vesicle-secreted proteins (SVS2, SVS4, SVS5, and PATE4 (SVS7)) were also present in some (but not all) sperm samples, but the abundance of these proteins was less than 1% of that in seminal vesicle secretion, a very low level of cross-contamination rendered visible by the extremely high content of these proteins in the true tissue source. The data-dependent analysis also provided evidence of cross-contamination of the two biological samples, but again, at a very low intensity (Fig. 2 and supplemental Table 1).
Fig. 2.

Expression profiling of seminal vesicle and sperm-derived proteins. Proteins identified in seminal vesicle (open triangles) or in sperm preparations (closed circles) were separately ranked and sorted according to abundance in the data-independent MSE/Hi3 quantitative analysis (data expressed as fmol on column, means ± S.D., n = 10). A few seminal vesicle proteins (SVS2, SVS4, SVS5, and PATE4) were also identified in sperm preparations, albeit at levels less than 1% of those found in seminal vesicle samples; we attribute these proteins as minor cross-contaminants.
Metabolic Labeling of Sperm and Seminal Vesicle Proteins
Although the discovery component of this study clearly identified many proteins that were previously known to be present in seminal vesicle secretions or in sperm, the purpose of this investigation was not to obtain a comprehensive proteome characterization of sperm and seminal vesicle proteins. Rather, our goal was to use metabolic labeling in the intact animal (37) to assess the dynamics of sperm and seminal vesicle proteins and thus the potential for plasticity in protein complement under competitive situations. To assess this, we fed mice a diet containing a stable isotope-labeled amino acid ([2H8]valine) and monitored the appearance of this label in sperm and seminal vesicle proteins. Because the seminal vesicle and sperm samples were taken from adult male mice over a 35-day period and no competitive stimuli were administered, we did not expect the protein profile to change over time, and this was borne out by the consistent expression data (Figs. 1 and 2 supplemental Table 1 and supplemental Fig. S1).
For sperm proteins, the labeling trajectory in the ejaculate would be additionally complicated by spermatogenesis. It takes approximately 35 days for mature sperm to appear in the epididymis (27), and it is only during spermiogenesis that significant protein synthesis takes place. When spermatogenesis is complete, the sperm undergo a period of maturation in the epididymis, during which time protein synthesis is not considered to be significant. Thus, the expectation would be of a “lag” period where labeling of mature sperm proteins was not evident. Subsequently, as mature sperm appear in the cauda epididymis, the prediction would be that sperm proteins, labeled as a consequence of protein synthesis during spermatogenesis, would evince enhanced metabolic labeling. Proteins synthesized and secreted by the epididymis, or more controversially by sperm in the epididymal space, would show metabolic labeling at earlier times, reflecting their synthesis at later stages in spermatogenesis (Fig. 3).
Fig. 3.

Experimental workflow for assessment of protein dynamics. Male mice were fed a diet in which 50% of the valine was administered as [2H8]valine. At different times, pairs of animals were killed, and the seminal vesicle fluid (SV) and sperm preparations (SP) were used for quantitative assessment of the incorporation of labeled valine into protein, by monitoring changes in the labeling pattern of valine-containing peptides. Proteins that are turning over at a high rate would be expected to label rapidly, whereas low turnover proteins would exhibit a gradual shift to stable isotope labeled peptides. A third class of proteins, derived from sperm that are in the process of spermatogenesis during a significant part of the labeling phase, would exhibit delayed labeling if these proteins were only being synthesized only during spermatogenesis and thus demonstrate “lifetime ” kinetics. Sperm proteins that are subject to high turnover even in the epididymis would exhibit the same labeling profile as other high turnover proteins.
In the absence of any changes in absolute protein expression, the only way to monitor protein dynamics is by monitoring the dynamics of a metabolic label incorporated into the protein pools. We fed mice a standard laboratory diet to which had been added a crystalline, stable isotope-labeled (heavy, H) amino acid [2H8]valine, at an amount equivalent to that found in unlabeled form in the diet. Assuming efficient digestion and equal absorption of the labeled and unlabeled amino acids in the diet as seen previously (30), the ingested valine should therefore comprise 50% labeled amino acid and thus have a RIA of 0.5.
Because the precursor was only partially labeled, the incorporation into proteins was complex but not such as to preclude analysis (30). Because each valine codon is encountered during protein synthesis, at a precursor RIA of 0.5, there is a 50:50 chance that a heavy valine is incorporated at that position in the protein. When the protein is digested into tryptic fragments for mass spectrometric analysis, peptides lacking any valine residues will of course be unlabeled, those containing a single valine residue will be either heavy or light, but peptides containing multiple valine residues will exhibit a more complex labeling pattern, reflecting the combinatorial incorporation of label at each valine residue. To illustrate this, a divaline peptide such as NH2····V·····V····CO2H will be a mixture of LL, HL/LH, and HH variants. At a precursor RIA of 0.5 and in the absence of any pre-existing material, the ratio of the three variants (LL, HL/LH, and HH) would follow a distribution defined by a binomial expansion of 1:2:1. For a trivaline peptide under the same conditions, the four variants would be, from LLL to HHH, 1:3:3:1. In reality, the pattern is compromised in two ways. First, in most instances, the proteins pre-exist in the animal, and thus, there would always be a pool of unlabeled protein that would have to be completely degraded to attain the “perfect” labeling pattern. Second, the ingested amino acid would be diluted by the pre-existing pool of unlabeled amino acid in the tissues of the animal, and this unlabeled pool will serve to reduce the RIA of the precursor. We have shown previously that it is possible to use the pattern of labeling of multi-valine peptides to advantage, permitting the derivation of an accurate measurement of the RIA of the precursor pool. Once the RIA is known, the labeling trajectory of any peptide, including monovaline peptides, can define the rate of replacement of each protein (30, 38).
To determine the RIA of the precursor pool in the whole animal, we analyzed the labeling pattern of MUPs. These proteins are highly abundant, synthesized in the liver (where the mRNA pool for these proteins comprises approximately 5% of the total mRNA pool), and rapidly secreted into the circulation. The fate of these proteins is to be filtered efficiently through the renal glomerulus and excreted in the urine, where they mediate complex chemical signaling between individuals through urinary scent marking (39–41). These proteins thus report very rapidly on the RIA of the labeled amino acid in the hepatic pool. Moreover, MUPs are a homologous family of proteins encoded on a high replicated region of chromosome 4, and many peptides are derived from more than one MUP (42, 43), which means that the trajectory of labeling will be derived from multiple MUPs, but nonetheless reflect the increase in liver precursor RIA. The MUPs become labeled rapidly (k = 1.05 ± 0.11 day−1), and the RIA of the hepatic valine precursor reached a plateau (0.42 ± 0.007) that was maintained for the remainder of the labeling period (supplemental Fig. S1). The precursor RIA in the diet was estimated to be 0.5, and the modest discrepancy between the predicted and observed RIA values reflects the return of unlabeled amino acid to the pool by protein degradation. In time, of course, the plateau that was observed would reach that of the dietary precursor, but this would take substantially longer than the 35 days here and, conceivably, the lifetime of the animal. When the behavior of sperm or seminal vesicle proteins was analyzed, the RIA values obtained for representative proteins confirmed that the seminal vesicles and sperm had attained the same level of precursor enrichment (SVS6: RIAplateau = 0.44 ± 0.005; k = 1.2 ± 0.21 day−1), PATE4: RIAplateau = 0.44 ± 0.011; k = 0.7 ± 0.097 day−1). The precursor amino acid pool remained labeled to the same extent for the duration of the experimental period. The delay in the rise to a stable plateau for some sperm-derived proteins reflects the delay in appearance of label as a consequence of the maturation process (see below).
In our experimental system, there is an additional, but soluble, complication. Long term administration of labeled amino acids to animals is costly, and to reduce the cost of the experiments, we have used uniformly labeled deuterated amino acids, in which every nonionizable hydrogen atom is replaced with a deuteron. This labeling pattern includes the α-carbon hydrogen atom that is susceptible to metabolic loss through transamination. Transamination is a reversible enzymic reaction, and the interconversion of an amino acid with its cognate 2-oxo acid results in rapid exchange of the α-carbon deuteron for hydrogen. In single cell organisms, this can be a complete reaction (in yeast, the α-carbon deuteron of leucine is lost completely by metabolism (44), but in animal metabolism, this exchange can be partial). Thus, proteins become labeled with a mixture of [2H8]valine and [2H7]valine, and the quantification of the labeled pool must extend over the entire overlapping isotope profiles of the two labeled variants. Analysis of the overlapping isotope profiles permits measurement of the extent of transamination, and in these experiments valine is transaminated to a 60%/40% mixture of [2H8]valine and [2H7]valine in seminal vesicles and an 80%/20% mixture of [2H8]valine and [2H7]valine in sperm. The extent of transamination is apparently higher in sperm samples, possibly reflecting the different metabolic profile of these cells (supplemental Fig. S2). In either instance, the labeled peptides were assessed as the sum of a mixture of +7 Da and +8 Da variants, deriving the total labeled protein in each instance. This parameter is insensitive to the extent of transamination.
Knowing the behavior of the precursor RIA allowed us to assess the time course of labeling of individual seminal vesicle or sperm proteins. This analysis required, ideally, monovaline peptides, of mass M, that yielded good signals in the MS scan, permitting integration of the intensity of the unlabeled peptide over the monoisotopic peak and the next three [13C]isotopomers (thus, M, M + 1 Da, M + 2 Da, and M + 3 Da). The labeled peak, which was labeled with a mixture of [2H7]valine and [2H8]valine, was integrated over the [2H7]valine ion (monoisotopic, M), the M + 1 Da ion (a mixture of 2H8-labeled peptide and the first 13C-labeled isotope of the 2H7-labeled peptide and for the next three ions (thus, M, M + 1 Da, M + 2 Da, M + 3 Da, and M + 4 Da). Finally, the isotopomers were required to be clearly resolved from contaminant ions that would compromise the calculation of labeling trajectory. Typical isotopic profiles at 2 and 35 days of labeling for monovaline and divaline peptides are shown in Fig. 4. Because we monitored labeling over a 35-day period, we were able to assess the trajectory of labeling, which revealed some remarkable differences. For example, the seminal vesicle protein SVS6 incorporated label very rapidly and by day 14 had attained complete labeling, consistent with high turnover of the seminal vesicle protein pool (Fig. 5). By contrast, the intracellular sperm protein lactate dehydrogenase C (LDHC) did not incorporate label to any significant extent until after 14 days of labeling. For those proteins where more than one peptide could be analyzed, the labeling curves were essentially indistinguishable. This reproducibility was replicated between samples from the different mice also. The data in the labeling trajectory curves were all derived from high resolution Orbitrap data. The detailed kinetic constants and fitted parameters for each protein are presented in supplemental Table 2.
Fig. 4.
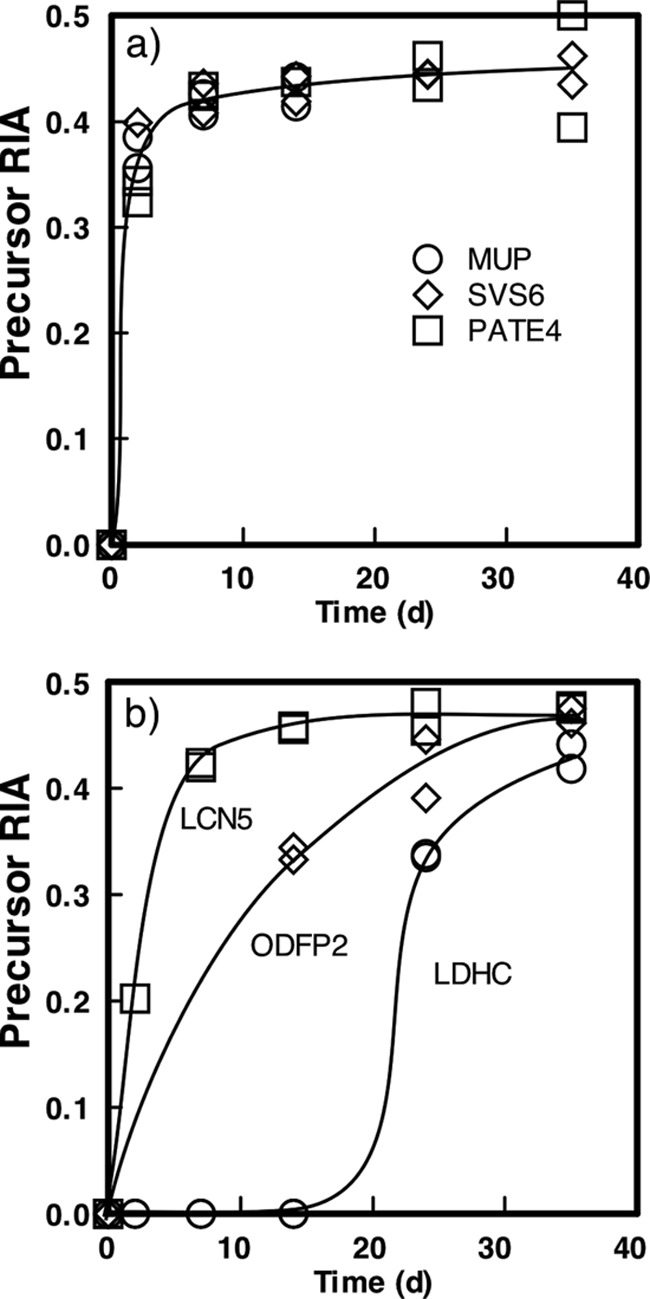
Precursor [2H8]valine relative isotope abundance assessed for sperm and seminal vesicle proteins. Throughout the 35-day labeling period, the precursor RIA was calculated from divaline peptides for two seminal vesicle proteins (SVS6 and PATE4) and urinary MUPs (to define the profile of maximally labeled, secreted proteins; a). For two proteins derived from the sperm fraction (ODFP2 and LDHC; b), the precursor RIA curves reflect appearance of labeled peptide in the sample rather than a delay in precursor pool enrichment (see text). An epididymal secreted protein LCN5 is included to define the behavior of a protein secreted from the epididymis into the sperm fraction. For clarity, the trend lines are for illustration only, and the kinetic constants obtained by nonlinear curve fitting are given in the text.
Fig. 5.

Transamination of [2H8]valine to [2H7]valine during the labeling process. a, fully deuterated amino acids are also labeled at the α-carbon, and the deuterium atom at this position is metabolically labile as the amino acid undergoes reversible transamination through the cognate 2-oxo-acid. b, the shift in the labeled population was evident as a complex isotope labeling profile (as evidenced by a monovaline peptide FLQSEETVR from SVS4). The isotope profile was readily deconvoluted to reveal the extent of the transamination (see text). c, in sperm, based on LDH-C (open diamonds) and the outer dense fiber protein ODFP2 (filled diamonds), the extent of transamination was higher than for seminal vesicles as evidenced by SVS4 (open squares) and Kazal Inhibitor III (filled triangles).
Seminal Vesicle Proteins Are High Turnover Proteins
Labeling trajectories (Fig. 6) were obtained for at least one monovaline peptide for several of the abundant proteins in mouse seminal vesicle preparations, specifically SVS1, SVS2, SVS4, and SVS5, as well as SPIKL (a Kazal type serpin) and nucleobindin-2, a protein previously suggested to be secreted into seminal fluid (45). Although rapid labeling is to be expected for secreted proteins, the rate of attainment of plateau labeling is also controlled by the rate at which the secreted proteins leave the extracellular space. For example, the MUPs, which are secreted by the liver and immediately cleared from the plasma by glomerular filtration, reach plateau labeling within 2 days. Rates lower than this would be apparent if the secreted proteins were slower to clear from the extracellular pool. For seminal vesicle proteins, labeling was rapid, and plateau labeling was achieved with rate constants from 0.092 ± 0.012 to 0.126 ± 0.016 day−1 and half-times for replacement of the seminal vesicle pool ranging from 5.5 days to 7.5 days. Because the animals were not mating or under any competitive situation and these proteins were secreted into the seminal vesicle lumen, it might have been expected that they would acquire label at the same speed and to the same extent as, for example, MUPs (Fig. 4). However, the rate of labeling was substantially lower, reflecting the distribution of newly labeled protein into a pre-existing pool of unlabeled seminal vesicle proteins. Our labeling studies reveal that the accumulation of label in SV proteins occurs with a first order rate constant of ∼0.1 day−1. This thus sets a baseline for the loss of SV proteins from the steady state pool in the seminal vesicle lumen. The input is secretion into the lumen, and the output is physical loss by elimination or by reabsorption. Because the animal is in steady state, the rate of accumulation of label is the same as the rate of loss. Thus, the replacement rate is 0.1 or 10% day−1, even in the absence of copulation. If copulation led to depletion of the seminal vesicle protein pool, the rate of replenishment would occur with the same half-time, unless specific seminal vesicle protein synthesis was accelerated under conditions of frequent mating. However, a smaller pre-existing pool, such as would be found during mating where the pool might be depleted by ejaculation, would have a greater plasticity.
Fig. 6.
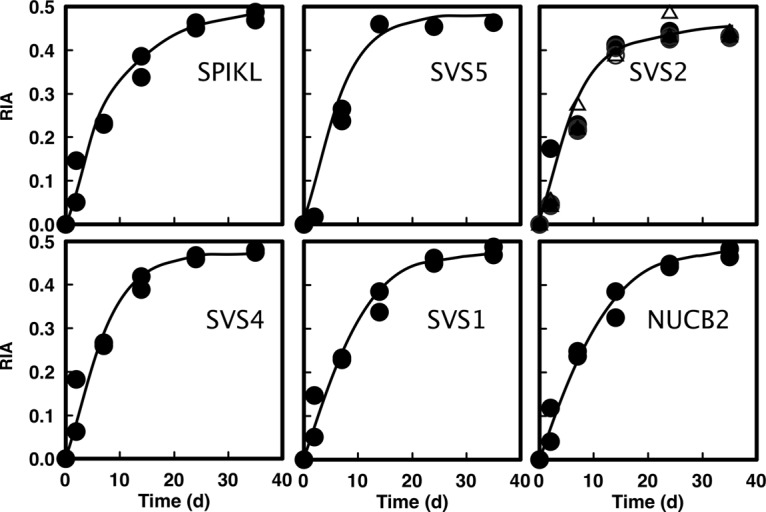
Labeling trajectory for seminal vesicle proteins. The incorporation of stable isotope-labeled valine into six seminal vesicle proteins was assessed by high resolution LC-MS. For each protein, duplicate data at each time point reflect the RIA value obtained from seminal vesicle preparations from two different mice. Each similar symbol represents an individual animal and time point, and the entire curve is defined by the analysis of 10 individuals/times. The proteins are seminal vesicle secretory proteins SVS1, SVS2, SVS4, and SVS5; serine protease inhibitor Kazal like protein minor form (SPIKL); and nucleobindin 2 (NUCB2). Kinetic analysis of the data are presented in supplemental Table 2a. The different symbols for SVS2 reflect data obtained from different valine-containing peptides.
Sperm Fraction Proteins Exhibit Complex and Distinctive Labeling Profiles
For the sperm samples, the mixture complexity was greater because we took whole cauda epididymal contents and deliberately did not purify or wash the sperm, because we wanted to examine both sperm proteins and the proteins in the surrounding fluid that support sperm maturation. This allowed us to look at extracellular proteins in this fraction, such as secreted lipocalins (e.g. LCN5). To identify sperm-specific proteins, we cross-referenced with previously published identifications from carefully washed sperm (36). For 16 of the proteins for which high quality labeling profiles were obtained, isotope incorporation trajectories demonstrated a complex range of behaviors (Fig. 7). Several proteins exhibited delayed incorporation of label (Fig. 7, top two rows), consistent with these being proteins synthesized during the early stages of spermatogenesis but subsequently not synthesized or turned over significantly in accordance with the view that the maturing sperm is largely transcriptionally and translationally inactive. A second group of proteins (Fig. 7, bottom two rows) incorporated label at a high rate from the beginning of the labeling period. This pattern of label incorporation is incompatible with the current view of sperm protein synthesis, and it is likely that some of these proteins are synthesized in the epididymis and are epididymal proteins supporting sperm maturation, an observation that is consistent with other recent studies (46–48).
Fig. 7.

Labeling trajectory for sperm fraction proteins. The incorporation of stable isotope labeled valine into 16 sperm proteins was assessed by LC-MS. For each protein, duplicate data at each time point reflect the RIA value obtained from epididymal preparations from two different mice; the entire curve is defined by the analysis of 10 individuals. The open and closed symbols reflect the two animals taken at each time point. For three proteins (TBB2, LDHC, and PTGDS), the data were obtained from two valine-containing peptides (circles and triangles). The proteins are serum albumin (ALBU), a kinase anchor protein 4 (AKAP4), CUB and zona pellucida like domain containing protein (CUDZ1), sperm-specific LDHC, prostaglandin H2 D isomerase (PTGDS), outer dense fiber protein 2 (ODFP2), fatty acid binding protein 9 (FABP9), epididymal specific lipocalin 5 (LCN5), testis-specific phosphoglycerate kinase (PGK2), tubulin β 2C (TBB2), voltage-dependent anion selective channel protein 2 (VDAC2), α-enolase (ENOA), glycerol-3-phosphate dehydrogenase (GPDM), phosphatidylethanolamine-binding protein 1 (PEBP1), cytoplasmic actin 1 (ACTB), and mitochondrial ATP synthase subunit α (ATPA). Kinetic analysis of the data is presented in supplemental Table 2b.
To discriminate the labeling behavior of the proteins, we fitted the labeling trajectory to a more complex function that included a delay time before appearance of label as an optimizable parameter. To define the range of behavior more clearly, we have classified the relationship between delay time (days) and first order rate constant for labeling (day−1) (Fig. 8). The longest delay (Fig. 8, area c) was between 15 and 21 days for mitochondrial ATPase (Q03265, ATPA_MOUSE), cytoskeletal tubulin (P68372, TBB2C_MOUSE), and cytoplasmic sperm-specific lactate dehydrogenase (P00342, LDHC_MOUSE); allowing for a transit time through the caput and corpus to the cauda epidiymis of ∼3 days (49) and a postmeiotic stage of ∼14–15 days in the mouse (50), such a labeling profile is consistent with meiotic or early postmeiotic synthesis of these proteins. A second group of proteins (Fig. 8, area b) had a delay in appearance of label of ∼7–10 days. This is the pattern of labeling that would be expected for proteins that were being synthesized toward the end of the postmeiotic phase. The proteins that exhibited this behavior included mitochondrial glycerol-3-phosphate dehydrogenase (Q64521, GPDM_MOUSE), fibrous sheath kinase anchor protein 4 (Q60662, AKAP4_MOUSE), cytoplasmic fatty acid binding protein 9 (O08716, FABP9_MOUSE), cytoplasmic testis-specific phosphoglycerate kinase (P09041, PGK2_MOUSE), and cytoskeletal outer dense fiber protein 2 (A3KGV1, ODFP2_MOUSE).
Fig. 8.

Labeling kinetics and classification of proteins. A group of 27 proteins from sperm or seminal vesicle proteins was analyzed for the first order rate constant of labeling (k, day−1) and the delay (days) in appearance of label in the peptides by nonlinear curve fitting of the labeling trajectory during 35 days feeding of a diet containing [2H8]valine. The proteins are plotted according to both parameters, and those in zones a, b, and c are discussed in the text.
A final group of proteins (Fig. 8, area a) was characterized by virtually no delay in labeling and a rapid rise in isotope incorporation. The lack of the delay period was exactly as observed for seminal vesicle proteins (Fig. 8). Of these proteins, albumin was most likely labeled through hepatic protein synthesis, demonstrating the same lack of delay and trajectory of labeling as the seminal vesicle proteins. Other proteins, notably lipocalin 5 (A2AJB7, LCN5_MOUSE), prostaglandin H2 D isomerase (O09114, PTGDS_MOUSE), and phosphatidylethanolamine-binding protein 1 (P70296, PEBP1_MOUSE) are secreted by the cauda epididymis and support sperm maturation. Finally, membrane-limited proteins such as CUB and zona pellucida-like domain-containing protein (P70412, CUDZ1_MOUSE) and voltage-dependent anion selective channel protein (Q60930, VDAC2_MOUSE) are probably released from the epididymis in exosomes (epididymosomes) that act as a vehicle for transfer of proteins to the sperm surface (51, 52). This group of proteins (epididymal, no delay) incorporated label into the protein pool at a much higher rate (0.22 to 0.33 day−1) than the seminal vesicles (rate constants between 0.09 and 0.12 day−1). Because the tissue precursor pool had reached isotopic equilibrium within ∼2 days of dietary administration of label, this can only be achieved if the epididymal lumen proteins are subject to higher rates of turnover (reuptake or fluid loss) than seminal vesicle proteins.
Perspective
There is increasing interest in the idea that the composition of seminal fluid proteins may be adjusted in response to sexual competition (1, 9–12). Exploration of the trajectory of incorporation of stable isotope label into seminal vesicle and sperm proteins provides a new perspective on the potential for plasticity. From the data here, the most abundant seminal vesicle proteins produced in the ejaculate of mice are able to respond over a period of 5 days or so, considerably faster than the duration of spermatogenesis in this species. Interestingly, specific epididymal proteins appear more responsive still and could in principle adjust in abundance within a matter of days.
This study, emphasizing proteome dynamics, has thus brought a new perspective to the plasticity of response of male reproductive proteins. The dynamics of stable isotope labeling permits a clear distinction between high and low turnover classes, and it is interesting to speculate that information obtained from isotope incorporation kinetics may be of value in defining the responsiveness of different proteins. For example, in studies of adaptive male responses to sperm competition, these techniques can now be used to measure plasticity in the production of particular proteins, thereby providing new insight into differential allocation strategies under competitive conditions. Moreover, by highlighting rapid rates of turnover for both seminal fluid and epididymal proteins, our study offers a novel demonstration that ejaculate production is costly, a central assumption of sperm competition theory for which very little other direct evidence is currently available beyond the assumed costs of spermatogenesis per se.
Footnotes
* This work was supported by Natural Environment Research Council Grant E/I013008/1 and Leverhulme Trust GrantF/0025/W. The costs of publication of this article were defrayed in part by the payment of page charges. This article must therefore be hereby marked “advertisement” in accordance with 18 U.S.C. Section 1734 solely to indicate this fact.
 This article contains supplemental material.
1 The abbreviations used are:
- SV
- seminal vesicle
- MUP
- major urinary protein
- RIA
- relative isotope abundance
- LDHC
- lactate dehydrogenase C
- H
- heavy
- L
- light.
REFERENCES
- 1. Parker G. A., Pizzari T. (2010) Sperm competition and ejaculate economics. Biol. Rev. Camb. Philos. Soc. 85, 897–934 [DOI] [PubMed] [Google Scholar]
- 2. Gage M. J. (1995) Continuous variation in reproductive strategy as an adaptive response to population density in the moth plodia interpunctella. Proc. Biol. Sci. 261, 25–30 [Google Scholar]
- 3. Gage M. J. (2005) Reproductive biology: Direct delivery of costly sex peptides. Curr. Biol. 15, R124–R126 [DOI] [PubMed] [Google Scholar]
- 4. Schärer L., Vizoso D. B. (2007) Phenotypic plasticity in sperm production rate: There's more to it than testis size. Evol. Ecol. 21, 295–306 [Google Scholar]
- 5. Oppliger A., Hosken D. J., Ribi G. (1998) Snail sperm competition characteristics vary with sperm competition risk. Proc. R. Soc. London B 265, 1527–1534 [Google Scholar]
- 6. Ramm S. A., Stockley P. (2009) Adaptive plasticity of mammalian sperm production in response to social experience. Proc. Biol. Sci. 276, 745–751 [DOI] [PMC free article] [PubMed] [Google Scholar]
- 7. Parker G. A. (1998) Sperm competition and the evolution of ejaculates: Towards a theory base. Sperm Comp. Sexual Selection 3, 54 [Google Scholar]
- 8. Wedell N., Gage M. J., Parker G. A. (2002) Sperm competition, male prudence and sperm-limited females. Trends Ecol. Evol. 17, 313–320 [Google Scholar]
- 9. Fedorka K. M., Winterhalter W. E., Ware B. (2011) Perceived sperm competition intensity influences seminal fluid protein production prior to courtship and mating. Evolution 65, 584–590 [DOI] [PubMed] [Google Scholar]
- 10. Lemaître J. F., Ramm S. A., Hurst J. L., Stockley P. (2011) Social cues of sperm competition influence accessory reproductive gland size in a promiscuous mammal. Proc. Biol. Sci. 278, 1171–1176 [DOI] [PMC free article] [PubMed] [Google Scholar]
- 11. Wigby S., Sirot L. K., Linklater J. R., Buehner N., Calboli F. C., Bretman A., Wolfner M. F., Chapman T. (2009) Seminal fluid protein allocation and male reproductive success. Curr. Biol. 19, 751–757 [DOI] [PMC free article] [PubMed] [Google Scholar]
- 12. Cameron E., Day T., Rowe L. (2007) Sperm competition and the evolution of ejaculate composition. Am. Nat. 169, E158–E172 [DOI] [PubMed] [Google Scholar]
- 13. Avila F. W., Sirot L. K., LaFlamme B. A., Rubinstein C. D., Wolfner M. F. (2011) Insect seminal fluid proteins: Identification and function. Annu. Rev. Entomol. 56, 21–40 [DOI] [PMC free article] [PubMed] [Google Scholar]
- 14. Poiani A. (2006) Complexity of seminal fluid: A review. Behav. Ecol. Sociobiol. 60, 289–310 [Google Scholar]
- 15. Pitnick S., Wolfner M. F., Suarez S. S. (2009) Ejaculate-female and sperm-female interactions. Sperm Biology: An Evolutionary Perspective. Academic Press; pp. 247–304 [Google Scholar]
- 16. Robertson S. A. (2007) Seminal fluid signaling in the female reproductive tract: Lessons from rodents and pigs. J. Anim. Sci. 85, E36–E44 [DOI] [PubMed] [Google Scholar]
- 17. Ramm S. A., McDonald L., Hurst J. L., Beynon R. J., Stockley P. (2009) Comparative proteomics reveals evidence for evolutionary diversification of rodent seminal fluid and its functional significance in sperm competition. Mol. Biol. Evol. 26, 189–198 [DOI] [PubMed] [Google Scholar]
- 18. Ramm S. A., Parker G. A., Stockley P. (2005) Sperm competition and the evolution of male reproductive anatomy in rodents. Proc. Biol. Sci. 272, 949–955 [DOI] [PMC free article] [PubMed] [Google Scholar]
- 19. Ramm S. A., Oliver P. L., Ponting C. P., Stockley P., Emes R. D. (2008) Sexual selection and the adaptive evolution of mammalian ejaculate proteins. Mol. Biol. Evol. 25, 207–219 [DOI] [PubMed] [Google Scholar]
- 20. Ialenti A., Santagada V., Caliendo G., Severino B., Fiorino F., Maffia P., Ianaro A., Morelli F., Di Micco B., Cartenì M., Stiuso P., Metafora V., Metafora S. (2001) Synthesis of novel anti-inflammatory peptides derived from the amino-acid sequence of the bioactive protein SV-IV. Eur. J. Biochem. 268, 3399–3406 [DOI] [PubMed] [Google Scholar]
- 21. Greeff J. M., Parker G. A. (2000) Spermicide by females: What should males do? Proc. Biol. Sci. 267, 1759–1763 [DOI] [PMC free article] [PubMed] [Google Scholar]
- 22. Li S. H., Lee R. K., Hsiao Y. L., Chen Y. H. (2005) Demonstration of a glycoprotein derived from the ceacam10 gene in mouse seminal vesicle secretions. Biol. Reprod. 73, 546–553 [DOI] [PMC free article] [PubMed] [Google Scholar]
- 23. Luo C. W., Lin H. J., Chen Y. H. (2001) A novel heat-labile phospholipid-binding protein, SVS VII, in mouse seminal vesicle as a sperm motility enhancer. J. Biol. Chem. 276, 6913–6921 [DOI] [PubMed] [Google Scholar]
- 24. Tseng H. C., Lin H. J., Sudhakar Gandhi P. S., Wang C. Y., Chen Y. H. (2008) Purification and identification of transglutaminase from mouse coagulating gland and its cross-linking activity among seminal vesicle secretion proteins. J. Chromatogr. B 876, 198–202 [DOI] [PubMed] [Google Scholar]
- 25. Beynon R. J., Pratt J. M. (2006) Strategies for measuring dynamics: The temporal component of proteomics. Methods Biochem. Anal. 49, 15–25 [DOI] [PubMed] [Google Scholar]
- 26. Good J. M., Nachman M. W. (2005) Rates of protein evolution are positively correlated with developmental timing of expression during mouse spermatogenesis. Mol. Biol. Evol. 22, 1044–1052 [DOI] [PubMed] [Google Scholar]
- 27. Oakberg E. F. (1956) Duration of spermatogenesis in the mouse and timing of stages of the cycle of the seminiferous epithelium. Am. J. Anat. 99, 507–516 [DOI] [PubMed] [Google Scholar]
- 28. Silva J. C., Gorenstein M. V., Li G. Z., Vissers J. P., Geromanos S. J. (2006) Absolute quantification of proteins by lcmse: A virtue of parallel ms acquisition. Mol. Cell. Proteomics 5, 144–156 [DOI] [PubMed] [Google Scholar]
- 29. Geromanos S. J., Vissers J. P., Silva J. C., Dorschel C. A., Li G. Z., Gorenstein M. V., Bateman R. H., Langridge J. I. (2009) The detection, correlation, and comparison of peptide precursor and product ions from data independent lc-ms with data dependant lc-ms/ms. Proteomics 9, 1683–1695 [DOI] [PubMed] [Google Scholar]
- 30. Doherty M. K., Whitehead C., McCormack H., Gaskell S. J., Beynon R. J. (2005) Proteome dynamics in complex organisms: Using stable isotopes to monitor individual protein turnover rates. Proteomics 5, 522–533 [DOI] [PubMed] [Google Scholar]
- 31. Silva J. C., Denny R., Dorschel C. A., Gorenstein M., Kass I. J., Li G. Z., McKenna T., Nold M. J., Richardson K., Young P., Geromanos S. (2005) Quantitative proteomic analysis by accurate mass retention time pairs. Anal. Chem. 77, 2187–2200 [DOI] [PubMed] [Google Scholar]
- 32. Ishihama Y., Oda Y., Tabata T., Sato T., Nagasu T., Rappsilber J., Mann M. (2005) Exponentially modified protein abundance index (emPAI) for estimation of absolute protein amount in proteomics by the number of sequenced peptides per protein. Mol. Cell. Proteomics 4, 1265–1272 [DOI] [PubMed] [Google Scholar]
- 33. Baker M. A. (2011) The 'omics revolution and our understanding of sperm cell biology. Asian J. Androl. 13, 6–10 [DOI] [PMC free article] [PubMed] [Google Scholar]
- 34. Baker M. A., Aitken R. J. (2009) Proteomic insights into spermatozoa: Critiques, comments and concerns. Expert Rev. Proteomics 6, 691–705 [DOI] [PubMed] [Google Scholar]
- 35. Baker M. A., Hetherington L., Reeves G., Müller J., Aitken R. J. (2008) The rat sperm proteome characterized via ipg strip prefractionation and lc-ms/ms identification. Proteomics 8, 2312–2321 [DOI] [PubMed] [Google Scholar]
- 36. Dorus S., Wasbrough E. R., Busby J., Wilkin E. C., Karr T. L. (2010) Sperm proteomics reveals intensified selection on mouse sperm membrane and acrosome genes. Mol. Biol. Evol. 27, 1235–1246 [DOI] [PMC free article] [PubMed] [Google Scholar]
- 37. Beynon R. J., Pratt J. M. (2005) Metabolic labeling of proteins for proteomics. Mol. Cell. Proteomics 4, 857–872 [DOI] [PubMed] [Google Scholar]
- 38. Hayter J. R., Doherty M. K., Whitehead C., McCormack H., Gaskell S. J., Beynon R. J. (2005) The subunit structure and dynamics of the 20S proteasome in chicken skeletal muscle. Mol. Cell. Proteomics 4, 1370–1381 [DOI] [PubMed] [Google Scholar]
- 39. Beynon R. J., Hurst J. L. (2004) Urinary proteins and the modulation of chemical scents in mice and rats. Peptides 25, 1553–1563 [DOI] [PubMed] [Google Scholar]
- 40. Hurst J. L., Beynon R. J. (2004) Scent wars: The chemobiology of competitive signalling in mice. Bioessays 26, 1288–1298 [DOI] [PubMed] [Google Scholar]
- 41. Hurst J. L., Payne C. E., Nevison C. M., Marie A. D., Humphries R. E., Robertson D. H., Cavaggioni A., Beynon R. J. (2001) Individual recognition in mice mediated by major urinary proteins. Nature 414, 631–634 [DOI] [PubMed] [Google Scholar]
- 42. Cheetham S. A., Smith A. L., Armstrong S. D., Beynon R. J., Hurst J. L. (2009) Limited variation in the major urinary proteins of laboratory mice. Physiol. Behav. 96, 253–261 [DOI] [PubMed] [Google Scholar]
- 43. Mudge J. M., Armstrong S. D., McLaren K., Beynon R. J., Hurst J. L., Nicholson C., Robertson D. H., Wilming L. G., Harrow J. L. (2008) Dynamic instability of the major urinary protein gene family revealed by genomic and phenotypic comparisons between c57 and 129 strain mice. Genome Biol 9, R91.1-R91.16 [DOI] [PMC free article] [PubMed] [Google Scholar]
- 44. Pratt J. M., Petty J., Riba-Garcia I., Robertson D. H., Gaskell S. J., Oliver S. G., Beynon R. J. (2002) Dynamics of protein turnover: A missing dimension in proteomics. Mol. Cell. Proteomics 1, 579–591 [DOI] [PubMed] [Google Scholar]
- 45. Moura A. A., Souza C. E., Stanley B. A., Chapman D. A., Killian G. J. (2010) Proteomics of cauda epididymal fluid from mature holstein bulls. J. Proteomics 73, 2006–2020 [DOI] [PubMed] [Google Scholar]
- 46. Gur Y., Breitbart H. (2006) Mammalian sperm translate nuclear-encoded proteins by mitochondrial-type ribosomes. Genes Dev. 20, 411–416 [DOI] [PMC free article] [PubMed] [Google Scholar]
- 47. Gur Y., Breitbart H. (2007) Protein translation in mammalian sperm. Soc. Reprod. Fertil. Suppl. 65, 391–397 [PubMed] [Google Scholar]
- 48. Gur Y., Breitbart H. (2008) Protein synthesis in sperm: Dialog between mitochondria and cytoplasm. Mol. Cell. Endocrinol. 282, 45–55 [DOI] [PubMed] [Google Scholar]
- 49. Dadoune J. P., Alfonsi M. F. (1984) Autoradiographic investigation of sperm transit through the male mouse genital tract after tritiated thymidine incorporation. Reprod. Nutr. Dev. 24, 927–935 [DOI] [PubMed] [Google Scholar]
- 50. Roosen-Runge E. C. (1977) The Process of Spermatogenesis in Animals, Cambridge University Press, Cambridge, UK [Google Scholar]
- 51. Frenette G., Girouard J., Sullivan R. (2006) Comparison between epididymosomes collected in the intraluminal compartment of the bovine caput and cauda epididymidis. Biol. Reprod. 75, 885–890 [DOI] [PubMed] [Google Scholar]
- 52. Thimon V., Frenette G., Saez F., Thabet M., Sullivan R. (2008) Protein composition of human epididymosomes collected during surgical vasectomy reversal: A proteomic and genomic approach. Hum. Reprod. 23, 1698–1707 [DOI] [PubMed] [Google Scholar]