

Abstract
Among various potential consequences of rarity is genetic erosion. Neutral genetic theory predicts that rare species will have lower genetic diversity than common species. To examine the association between genetic diversity and rarity, variation at eight DNA microsatellite markers was documented for 14 Acropora species that display different patterns of distribution and abundance in the Indo–Pacific Ocean. Our results show that the relationship between rarity and genetic diversity is not a positive linear association because, contrary to expectations, some rare species are genetically diverse and some populations of common species are genetically depleted. Our data suggest that inbreeding is the most likely mechanism of genetic depletion in both rare and common corals, and that hybridization is the most likely explanation for higher than expected levels of genetic diversity in rare species. A significant hypothesis generated from our study with direct conservation implications is that as a group, Acropora corals have lower genetic diversity at neutral microsatellite loci than may be expected from their taxonomic diversity, and this may suggest a heightened susceptibility to environmental change. This hypothesis requires validation based on genetic diversity estimates derived from a large portion of the genome.
Keywords: Allelic richness, conservation, heterozygosity, hybridization, microsatellite, population genetics, small population, threatened species
Introduction
As a consequence of their small population size, neutral population genetics theory predicts that rare species will be genetically less diverse than common ones (Kimura 1983). In general, a positive linear relationship is expected between genetic diversity and population size (Wright 1931), whereby as a species expands its population size, there are commensurate increases in genetic diversity. More specifically, for a neutral locus, the expected polymorphism at mutation-drift equilibrium is proportional to the effective population size (Ne – the number of breeding individuals). Thus, in populations with large Ne, high levels of genetic variation are maintained, and this maximizes adaptive potential (Frankham et al. 2010). Furthermore, the variation in selective pressure between habitats within reefs leads to slightly different local adaptations within a population, and this facilitates higher productivity or stability in the face of disturbance (Palumbi et al. 2008).
The process whereby genetic diversity is lost in small populations is called genetic erosion (Vrijenhoek 1985), and this has been documented in populations of both plants and animals (Nevo et al. 1984; Elstrand and Elam 1993; Baskauf et al. 1994; Frankham 1996). The causal factors of genetic erosion are mostly a combination of strong genetic drift through founder effects or bottlenecks, directional selection, clonality, and/or high levels of inbreeding (Kimura and Ohta 1971; Avise 1994; Willi et al. 2006; Frankham et al. 2010). Genetic erosion is problematic because it tends to reduce the fitness of individuals in a population. Hence, disturbance events, outbreaks of pathogens (Coltman et al. 1999), and other stochastic events can force genetically depleted populations to extinction (Goodman 1987; Elstrand and Elam 1993; Fagen et al. 2002; Frankham et al. 2010).
Under low population size, there is also an elevated risk that favorable alleles may be lost or that deleterious alleles will be fixed and both of these processes diminish the ability of individuals in a population to adapt to, or survive in, changing environments (Lande and Barrowclough 1987). Considering that genetic diversity can have important ecological consequences at the population, community, and ecosystem levels (Hughes et al. 2008), and especially for threatened species (Spielman et al. 2004), it is important that population viability of rare species is examined (Palumbi 2003), and information about genetic diversity is made available for conservation decision making (van Oppen and Gates 2006).
Among the 845 species of zooxanthellate scleractinian coral, published estimates of genetic diversity exist for only 4.6% of species (n = 39) (Table 1). These population genetic studies suggest that some high latitude populations of common coral species are vulnerable to genetic erosion (Ayre and Hughes 2004; Underwood et al. 2009), but others are not (Noreen et al. #b507). Until now, the level of genetic diversity in rare coral populations has only been examined among species restricted to the Atlantic Ocean (Baums et al. 2005a, 2006, 2010; Foster et al. 2007, 2012; Atchison et al. 2008; Neves et al. 2008; Reyes and Schizas 2010; Palumbi et al. 2012; Goodbody-Gringley et al. 2012); and one species (Pavona gigantea) restricted to the far Eastern Pacific Ocean (Saavedra-Sotelo et al. 2011). Thus, the genetic diversity and level of inbreeding in rare Indo–Pacific corals remain to be tested, these being the focus of this study.
Table 1.
Summary of population genetic data available for zooxanthellate scleractinian corals
| Family | Species | Reference |
|---|---|---|
| Pocilloporidae | Seriatopora hystrix | Ayre and Dufty (1994); Ayre and Hughes (2000, 2004); Maier et al. (2005); Underwood et al.(2007); van Oppen et al. (2008); Noreen et al. (#b507); Bongaerts et al. (#b501); Starger et al. (2010); van Oppen et al. (2011a). |
| Pocilloporidae | Stylophora pistillata | Ayre and Hughes (2000); Takabayashi et al.(2003); Ayre and Hughes (2004); Nishikawa (2008) |
| Pocilloporidae | Pocillopora damicornis | Stoddart (1984); Benzie et al.(1995); Ayre et al. (1997); Adjeroud and Tsuchiya (1999); Ayre and Hughes (2000); Miller and Ayre (2004, 2008a,2008b); Ayre and Hughes (2004); Whitaker (2006); Souter et al. (2009); Starger et al. (2010); Combosch and Vollmer (2011); Paz-Garcia et al. (2012). |
| Pocilloporidae | Pocillopora meandrina | Magalon et al.(2005) |
| Pocilloporidae | Pocillopora verrucosa | Ridgway et al. (2001) |
| Acroporidae | Isopora cuneata | Ayre and Hughes (2000, 2004) |
| Acroporidae | Isopora palifera | Benzie et al. (1995); Ayre and Hughes (2004) |
| Acroporidae | Acropora aspera | Whitaker (2006) |
| Acroporidae | Acropora austera | Macdonald et al. (2011) |
| Acroporidae | Acropora cervicornis | Vollmer and Palumbi (2006); Baums et al. (2010); Reyes and Schizas (2010). |
| Acroporidae | Acropora cytherea | Ayre and Hughes 2004; Márquez et al. (2002); Ladner and Palumbi (2012) |
| Acroporidae | Acropora digitifera | Whitaker (#b510); Nishikawa (2008); Nakajima et al. (2010) |
| Acroporidae | Acropora hyacinthus | Ayre and Hughes (2004); Márquez et al. (2002) |
| Acroporidae | Acropora millepora | Ayre and Hughes (2004); Smith-Keune and van Oppen (2006); van Oppen et al. 2011c |
| Acroporidae | Acropora nasuta | Mackenzie et al. (2004) |
| Acroporidae | Acropora palmata | Baums et al. (2005a, 2006); Reyes and Schizas (2010); Palumbi et al. (2012) |
| Acroporidae | Acropora tenuis | Márquez et al. (2002); Underwood et al.(2007); Nishikawa (2008); Underwood (2009) |
| Acroporidae | Acropora valida | Ayre and Hughes (2000, 2004) |
| Faviidae | Plesiastrea versipora | Rodriguez-Lanetty and Hoegh-Guldberg (2002) |
| Faviidae | Favia fragum | Goodbody-Gringley et al. 2010; |
| Faviidae | Goniastrea aspera | Nishikawa and Sakai (2003); Nishikawa (2008) |
| Faviidae | Goniastrea australiensis | Miller and Ayre (2008b) |
| Faviidae | Goniastrea favulus | Miller and Ayre (2008a) |
| Faviidae | Favia fragum | Goodbody-Gringley et al. (2010) |
| Faviidae | Platygyra daedalea | Miller and Ayre (2008a) |
| Faviidae | Platygyra sinensis | Ng and Morton (2003) |
| Faviidae | Montastrea annularis | Foster et al. (2007, 2012) |
| Faviidae | Montastrea cavernosa | Goodbody-Gringley et al. (2012) |
| Faviidae | Montastrea faveolata | Baums et al. (2010) |
| Faviidae | Diploria strigosa | Atchison et al. (2008) |
| Pectiniidae | Mycedium elephantotus | Yu et al. (1999); Dai et al. (2000) |
| Fungiidae | Fungia fungites | Gilmour (2002) |
| Fungiidae | Heliofungia actiniiformis | Knittweis et al. (2008) |
| Dendrophylliidae | Balanophyllia europaea | Goffredo et al. (2004) |
| Siderastreidae | Siderastrea stellata | Neves et al. (2008) |
| Siderastreidae | Siderastrea radians | Neves et al. (2008) |
| Poritidae | Porites lobata | Polato et al. (Polato et al. (#b509) |
| Astrocoeniidae | Madracis decactis | Atchison et al. (2008) |
| Agariciidae | Pavona gigantea | Saavedra-Sotelo et al. (2011) |
Acropora (staghorn corals) is the model group for this study because an extensive literature exists on the global ranges of Acropora species and we have abundance data that enable us to estimate means global census sizes. Acropora are extremely susceptible to coral bleaching, changes in water quality, disease, and predation (Marshall and Baird 2000; Bruno et al. 2007; Pearson 1981). Furthermore, because Acropora spp. are particularly important for reef formation, ecosystem function, and biodiversity, and 50% of species in the genus are listed in elevated categories of threat on the IUCN red list (Carpenter et al. 2008), the genetic implications of rarity in Acropora have direct conservation significance.
This project is the first to perform a comparative analysis of genetic diversity over a large number of coral taxa. We examine the level of genetic diversity in 14 species of Acropora from the Indo–Pacific Ocean (nine rare and five common) encompassing 25 populations from 11 geographic locations to obtain insights into their genetic diversity. We test the null hypothesis that rare species have lower genetic diversity than closely related common congeners, and we generate new a hypotheses pertaining to the susceptibility of Acropora corals to environmental change.
Methods
Samples of 14 species (nine rare, five common – Table 2) were collected from 11 locations across the Indo–Pacific (Fig. 1). Considering that “rarity” can apply not only to patterns of abundance but also to distribution (Brown 1984; Gaston 1994), in this study, we examine the link between genetic diversity and both estimated global census size and maximum global range size.
Table 2.
Summary of species, population sample sizes, and number of loci included in the final analysis
| Species | Population | Geographic region | Sample size | Number of loci |
|---|---|---|---|---|
| Acropora microphthalma | Orpheus Island | Central GBR | 25 | 7 |
| Maldives | North Indian Ocean | 12 | 7 | |
| Seychelles | South Indian Ocean | 22 | 7 | |
| Kimbe Bay | Papua New Guinea | 25 | 7 | |
| A. valida | Orpheus Island | Central GBR | 29 | 7 |
| Heron Island | Southern GBR | 26 | 7 | |
| Kimbe Bay | Papua New Guinea | 20 | 7 | |
| A. austera | Maldives | Indian Ocean | 29 | 6 |
| Arno Atoll | North Central Pacific | 18 | 5 | |
| Majuro Atoll | North Central Pacific | 24 | 5 | |
| Majuro – 20 branches from single colony | Central Pacific | 20 | 5 | |
| A. millepora | Ningaloo Reef | Indian Ocean | 34 | 8 |
| Orpheus Island | Central GBR | 27 | 8 | |
| A. horrida | Orpheus Island | Central GBR | 27 | 8 |
| A. papillare* | Ningaloo Reef | East Indian Ocean | 31 | 7 |
| Orpheus Island | Central GBR | 20 | 8 | |
| Okinawa – Japan | North Pacific | 14 | 8 | |
| A. pichoni* | Kimbe Bay | Papua New Guinea | 6 | 7 |
| Chuuk Lagoon | Central West Pacific | 6 | 7 | |
| A. spathulata* | Orpheus Island | Central GBR | 28 | 7 |
| A. kirstyae* | Orpheus Island | Central GBR | 27 | 8 |
| A. tortuosa | Rongelap Atoll | North Central Pacific | 12 | 7 |
| A. jacquelineae* | Kimbe Bay | Papua New Guinea | 20 | 7 |
| A. kimbeensis* | Kimbe Bay | Papua New Guinea | 14 | 7 |
| A. rongelapensis* | Rongelap Atoll | North Central Pacific | 12 | 7 |
| A. walindii* | Kimbe Bay | Papua New Guinea | 14 | 8 |
Species marked with asterisk are rare.
Figure 1.
Sampling locations for population genetic analysis.
To determine which species have a restricted global distribution, the maximum global range of the 14 species included in this study was quantified using the WorldWide Acropora Database, which has 25,000 records based on over 30 years of collections (Wallace 1999). Longitudinal and latitudinal limits for each species were determined from the database, and the range was approximated as elliptical in shape with an area given by: Latitudinal Range/2 × Longitudinal Range/2 × Pi. Species were described as rare if their range is 1/10th or less of the Acropora species with the largest global range (A. valida). Estimates of global census size were calculated according to Richards et al. (2008). For ease of interpretation, rare species are marked with an asterisk (*) throughout text (e.g., A. pichoni*).
The population sample sizes of the 14 species included in this study range from 6 to 34 individuals (Table 2). It is important to note that conducting population genetic studies on rare species is challenging for a number of reasons, the principal one being that it is exceedingly difficult to obtain sample sizes large enough to warrant interpretations to be made about population-level trends. For corals, the difficulty is further exacerbated by the remote nature of the locations where rare Acropora species occur, and the difficulty in identifying rare corals to the species level. Thus, for some of the rare species examined in this study, local populations are so small that it is not feasible to obtain larger population samples. Hence, the small sample sizes and somewhat limited number of species examined prevent a rigorous test of the association between genetic diversity and rarity; however, this study provides a foundation from which the level of genetic diversity in rare corals can be further explored.
All molecular samples examined in this project have matching skeletal voucher specimens that were identified by the author and verified by Dr. Carden Wallace. Small branches (2–5 cm) were collected from individual colonies and stored in absolute ethanol. To minimize sampling across multiple recruitment cohorts and asexually derived clone mates, colony sizes and spacing were standardized (20–50 cm colony size, >20 m between colonies). DNA was extracted from approximately 20 mg of coral branch according to Underwood et al. (2009 – Appendix 1). Precipitated DNA was resuspended in 100 μL 0.1 mol/L Tris pH = 9 and stored at –20°C.
Variation at nine variable tandem repeats (microsatellite markers) was documented using markers previously developed for Acropora (Baums et al. 2005b; van Oppen et al. 2007) (Table 3). Microsatellite polymerase chain reaction (PCR) products were initially examined using denaturing gel electrophoresis on the (Corbett GelScan2000, Sydney, Australia). Microsatellite PCR products were visualized using fluorescently labeled forward primers and unlabelled reverse primers. Once it was confirmed via initial GelScan screening that the microsatellites would cross-amplify, genotyping was undertaken following the procedure described below.
Table 3.
Primer sequences
| Locus name | Primer sequence (5′–3′) |
|---|---|
| Amil2_002 | F – ACAAAATAACCCCTTCTACCT |
| R – CTTCATCTCTACAGCCGATT | |
| Amil2_006 | F – CTTGACCTAAAAAACTGTCGTACAA |
| R – GTTATTACTAAAAAGGACGAGAGAATAACTTT | |
| Amil5_028 | F – GGTCGAAAAATTGAAAAGTG |
| R – ATCACGAGTCCTTTTGACTG | |
| Amil2_022 | F – CTGTGGCCTTGTTAGATAGC |
| R – AGATTTGTGTTGTCCTGCTT | |
| Amil2_23 | F – GCAAGTGTTACTGCATCAAA |
| R – TCATGATGCTTTACAGGTGA | |
| Amil2_007 | F – TAATGAGCAAACTCATTCATGG |
| R – CTTTT CCAAGAGAAGTCAAGAA | |
| Amil2_010 | F – CAGCGATTAATATTTTAGAACAGTTTT |
| R – CGTATAAACAAATTCCATGGTCTG | |
| Amil2_012 | F – TTTTAAAATGTGAAATGCATATGACA |
| R – TCACCTGGGTCCCATTTCT |
Microsatellites were pooled into three multiplex reactions (Table 4). Each PCR primer was labeled with a different fluorescent dye (TET, HEX, or FAM) and alleles were scored as PCR product size in base pairs. Where more than two bands were observed in an individual, PCR products were cloned for subsequent sequencing to ensure that peaks were true alleles and did not represent nonspecific amplification. Conditions for the PCR included using 150–200 ng of DNA template and 5 μL 2× Qiagen Multiplex PCR kit master mix in a 10 μL reaction in the presence of 1 μL of each primer and 3.25 μL of H2O. PCR profile consisted of the initial denaturation step of 15 min followed by 35 cycles of 94° for 30 sec, 50° for 90 sec, and 72° for 60 sec. The mix was incubated at 60°C for 30 min. Three microliters of the PCR product was electrophoresed in a 2% TAE-agarose gel in 1× TAE buffer to assess the yield. Successful products were then cleaned using the Sephadex resin in the Whatman Unifilter 800 system. One microliter of the purified PCR product was transferred to a skirted 96-well plate and sent for genotyping at the JCU Advanced Analytical Centre. Fragment analysis was conducted on the Amersham MegaBase. To minimize genotyping errors, all automated scorings of alleles were checked manually, and rerunning the clean PCR product cleared uncertainties.
Table 4.
Multiplex reactions
| Locus | Repeat type | Label | |
|---|---|---|---|
| Multiplex 1 | Amil2_002 | (TG)10 | HEX |
| Ami2_006 | (CA)4TA(CA)4 | FAM | |
| Amil5_028 | (TCACA)7TCAC(TCACA)4TCACTCACTCACA | TET | |
| Multiplex 2 | Amil2_022 | (AC)10 | TET |
| Amil2_23 | (AG)7 | HEX | |
| Multiplex 3 | Amil2_007 | (TG)7AG | TET |
| Amil2_010 | TA(TG)11 | FAM | |
| Amil2_012 | GA(CA)6GA(CA)2 | HEX |
In cases where over two alleles were detected in genotyping, the quality of genotyping results was cross-checked using standard cloning and sequencing techniques. Unlabelled microsatellite PCR products were cloned using the ligation kit, pGEM T easy (Promega, Sydney, Australia) (5 μL ligation buffer, 1 μL pGEM-T Easy Vector, 3 μL PCR product, 1 μL DNA ligase) and incubated for 1–4 h at room temperature or overnight at 4°C. The bacterial cells were transformed with a ligated vector using 60 μL of NM522 competent cells. Cultures were spun in a benchtop centrifuge for 5 min at 4000 rpm. The supernatant was removed and DNA was isolated using the plasmid isolation protocol in the RBC Hyfield Plasmid Mini Kit. The concentration of DNA was determined using a spectrometer and a minimum of 1 μg of purified DNA was dried and sent to Macrogen Inc. (http://www.macrogen.com) for sequencing using SP6 and M13F vector primers.
Analysis
Microsatellite alleles were scored as a simple function of PCR product size. Genotypes for all loci were manually scored from electrophoretic data. Conformity to the expectations of Hardy–Weinberg equilibrium (HWE) were established using a chi-square test (Miller and Benzie 1997) and significance values were adjusted with Benjamini–Hochberg (BY) correction for multiple comparisons (Benjamini and Yekutieli 2001; Narum 2006) in GenAlex (Peakall and Smouse 2005). Genepop on the web (Raymond and Rousset 1995) was used to test for linkage between loci under the following Markov Chain parameters: 1000 dememorization, 100 batches, and 10,000 iterations per batch. Descriptive statistics, including proportion of polymorphic loci (P), number of alleles per locus (A), and observed and expected heterozygosity, were calculated to illustrate the distribution of genetic diversity within and between populations (Lewis and Zaykin 2001) – Nei's measure was used to correct for uneven sample size in heterozygosity estimates. Allele richness was calculated in Fstat v 2.9.3 (Goudet 2001), and this program was also used to correct for the uneven sample sizes among the populations examined. Allelic diversity and standard genetic distance were computed according to Nei (1987), and significance was corrected for multiple pairwise comparisons (Benjamini and Hochberg 1995).
The extent of inbreeding was summarized by the inbreeding coefficient, FIS, in Fstat on the Web. This inbreeding coefficient assesses the effects of nonrandom mating within subpopulations, as a measure of reductions in the heterozygosity of individuals. The presence of null alleles (inconsistent amplification of alleles due to mutations in the primer binding region) was assessed in Microchecker v 2.2.3 (van Oosterhout et al. 2004). The probability of identity via sexual reproduction was then examined by calculating the proportion of unique multilocus genotypes (MLGs) at each site (Ng:N) (as per Underwood 2009). In situations where multilocus matches were identified within species, one individual from each pair was removed from subsequent analyses so that each unique genotype was represented only once.
Statistical differences in genetic diversity and level of inbreeding among rare and common species were determined using the Kruskal–Wallace test implemented in SPSS 17 with a single outlier excluded (for further discussion see heterozygosity results for A. rongelapensis). The relationships between range size/census size and allelic richness/expected heterozygosity were initially examined with Pearson's Correlation Coefficient in R, and regression analysis was used to compare the goodness of fit (r2). Assumptions of linearity, normality, and homogeneity of variances were assessed through examination of residuals and variables. The significance of linear (ŷ = a + bx) and polynomial relationships (ŷ = a + bx + cx^2) was also examined in multiple regression.
Results
A total of 531 individuals in 14 species of Acropora were genotyped (see Table 2). Thirty-eight percent of initial genotype runs either failed or had multiple peaks, so these samples were genotyped a second time to resolve peaks and 4% were genotyped three times. Overall, 10 species had 100% polymorphic loci (Table 5); however, locus Apam3_166 did not amplify or amplified poorly in all samples, so it was removed from the analysis. Amil2_007 and Amil2_012 also provided mixed results and did not amplify in some populations of some species. For example, Amil2_007 did not amplify A. papillare* from Ningaloo Reef, but did amplify in A. papillare* from Orpheus Island and Japan; Amil2_012 did not amplify in any A. austera populations, but worked for all other species examined. Species showing <100% polymorphic loci were: A. papillare*, A. walindii*, A. valida, and A. austera. In A. valida, two populations contained 100% polymorphic loci, but the third (Heron Island) did not (57% of the loci were polymorphic).
Table 5.
Total number of alleles screened across all loci (N), number and percentage of private alleles, number of locus pairs in linkage disequilibrium (LD), percentage polymorphic loci and MLG – identical multilocus genotypes, and probability of identity through sexual reproduction (Ng/N)
| Species | Population | N | LD | % Polymorphic loci | MLG | Ng/N |
|---|---|---|---|---|---|---|
| Acropora micropthalma | Kimbe Bay | 51 | 2 | 100 | 0 | 1 |
| Seychelles | 53 | 2 | 100 | 0 | 1 | |
| Maldives | 35 | 2 | 100 | 0 | 1 | |
| Orpheus Island | 36 | 2 | 100 | 1 | 1 | |
| A. valida | Orpheus Island | 41 | 0 | 100 | 0 | 1 |
| Heron Island | 17 | 0 | 57.14 | 3 | 0.69 | |
| Kimbe Bay | 42 | 0 | 100 | 0 | 1 | |
| A. austera | Majuro | 12 | 0 | 50 | 4 | 0.83 |
| Arno | 14 | 0 | 66.7 | 0 | 1 | |
| Maldives | 29 | 0 | 100 | 0 | 1 | |
| A. papillare* | Ningaloo | 41 | 0 | 87.5 | 2 | 0.93 |
| Orpheus Island | 51 | 0 | 100 | 0 | 1 | |
| Japan | 32 | 0 | 87.5 | 0 | 1 | |
| A. millepora | Orpheus Island | 48 | 0 | 100 | 0 | 1 |
| Ningaloo | 62 | 0 | 100 | 2 | 0.94 | |
| A. pichoni* | Kimbe Bay | 32 | 0 | 100 | 0 | 1 |
| Truk | 34 | 0 | 100 | 0 | 1 | |
| A. horrida | Orpheus Island | 43 | 2 | 100 | 0 | 1 |
| A. jacquelineae* | Kmibe Bay | 26 | 0 | 100 | 3 | 0.84 |
| A. kimbeensis* | Kimbe Bay | 37 | 1 | 100 | 0 | 1 |
| A. tortuosa* | Rongelap Atoll | 24 | 2 | 100 | 0 | 1 |
| A. kirstyae* | Orpheus Island | 49 | 3 | 100 | 3 | 0.89 |
| A. spathulata* | Orpheus Island | 28 | 0 | 100 | 1 | 0.96 |
| A. walindii* | Kimbe Bay | 18 | 0 | 62.4 | 0 | 1 |
| A. rongelapensis* | Rongelap Atoll | 36 | 2 | 100 | 0 | 1 |
Clonality
The population with the highest degree of clonality was the Majuro A. austera population where a single MLG was repeated four times (Table 5) and the probability of asexual reproduction was 17%. The population with the highest occurrence of asexual reproduction was the Heron Island A. valida population where Ng/N was 69%. An additional five species displayed evidence of asexual reproduction including the two Ningaloo reef populations (A. papillare* 7% and A. millepora 6%), A. jacquelineae* from Kimbe Bay (16%); and A. kirstyae* and A. spathulata* from Orpheus Island (11% and 4%, respectively). The remaining populations of five species were fully sexually produced (A. horrida, A. tortuosa*, A. pichoni*, A. kimbeensis*, and A. rongelapensis*).
Potential polyploidy or multicopy loci
Genotyping showed more than two peaks (three to five) in 15% of the individuals sampled (73 of the 531) (Fig. 2), suggesting either some of the loci are not single-copy in some species or that some species or populations are polyploid. Species showing such patterns included A. microphthalma, A. valida, A. austera, A. kirstyae*, A. kimbeensis*, and A. pichoni*. Cloning and sequencing verified that ≥2 alleles were present for locus Amil2_022 in A. valida and A. kimbeensis*, but not for any of the other loci or species. This suggests that this locus has undergone duplication in these species, rather than these species being polyploid. The existence of multiallelic profiles is not accommodated in computer programs that treat codominant markers, so this prevented the inclusion of locus Amil2_022 data in the analysis of the population within which they occur; however, it was included for the other species that showed ≤2 alleles per individual at this locus.
Figure 2.
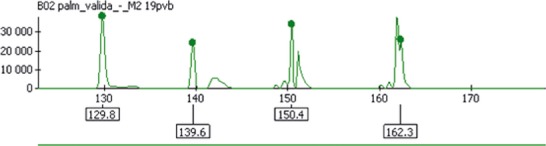
Chromatogram showing multiple peaks in locus Amil2_022 in Acropora valida from Orpheus Island. The examples of duplicated alleles that we describe could be evidence of hybridization events; however, duplication was restricted to a single locus (Amil2_022), and does not appear to represent a genome-wide (polyploidization) pattern. Duplication events cannot be explained as scoring errors or PCR artifacts because cloning and sequencing verified genotyping results.
Heterozygosity
Twenty-nine percent of samples displayed significantly lower observed heterozygosity than expected under HWE at P < 0.05. Two common species (A. millepora and A. valida) have the greatest proportion of loci with significant heterozygote deficits (number of loci in deficit = 62% and 70%, respectively). Significant heterozygote deficits were also detected in rare species (e.g., A. papillare*, A. pichoni*, A. kimbeensis*, and A. spathulata*) and null alleles were encountered 45 times (Appendix 1).
Heterozygote deficits due to null alleles were corrected in 73% of cases. In one case, heterozygote deficit was due to large allele dropout, whereby shorter alleles are preferentially amplified, resulting in the less efficient amplification of large alleles; however, these data were corrected. For the remaining 27% of cases, significant deficits remained after correction for null alleles, suggesting that there are additional reasons for the deficits or there were not enough data to correct the null alleles. Correction reduced FIS scores and increased the number of populations with heterozygote excess. For example, all three populations of A. papillare* changed to heterozygote excess after correction for null alleles (note: repeated MLG's were removed before analysis), while the Majuro A. austera population remained in deficit after null alleles were corrected. No null alleles were detected in A. rongelapensis* nor A. jacquelineae*. Significant heterozygote excess was detected in A. papillare* at 3 loci and in A. rongelapensis* at 6/7 loci with 100% observed heterozygosity recorded at 3 loci.
Significant genotypic linkage disequilibrium was found in 18 of the performed tests (P < 0.05). Among common species, there was no strong link between loci with statistically significant genotypic linkage disequilibrium and populations in HWE disequilibrium. For example, two locus pairs (Amil2_002 and Amil5_002; Amil5_002 and Amil2_010) were linked in all A. microphthalma populations; however, only one third of the A. microphthalma populations showed significant deviations from HWE (Appendix 1). However, for rare species, loci with statistically significant genotypic linkage disequilibrium also showed significant heterozygote deficits (e.g., A. tortuosa* and A. kirstyae*). The presence of linkage disequilibrium in association with heterozygote deficits may indicate inbreeding or it may be a sign that members of different populations have been sampled (i.e., Wahlund effect).
Patterns of genetic diversity in rare and common species
When both metrics of genetic diversity are plotted together with species ranked from most common to rare, it is obvious that the highest levels of expected heterozygosity occurred in rare species (Fig. 3). This figure also illustrates that among common species, the level of expected heterozygosity and allelic richness was similar; however, the results from these two genetic diversity metrics were quite different for some of the rare species (Fig. 4). For example, in A. pichoni* mean allelic richness was particularly low, while expected heterozygosity was high. Generally patterns of allelic richness and expected heterozygosity at individual loci were extremely variable within species; hence, the large standard error bars.
Figure 3.

Genetic diversity of rare and common Acropora species. Data were pooled for species sampled across multiple populations. Species are listed from most widespread (A. valida) to most geographically restricted (A. rongelapensis*). He, expected heterozygosity; AR, allelic richness.
Figure 4.

Correlation between range size/estimated global census size and mean expected heterozygosity/allelic richness for 14 species with different distribution/abundance patterns. (A) A nonsignificant nonlinear relationship exists between maximum range size and mean He (r2 = 0.235, df = 11, P-value x2 = 0.103). (B) A nonsignificant negative linear relationship exists between estimated global census size and mean He (r2 = 0.005; df = 12; P = 0.812). (C) A nonsignificant linear relationship exists between maximum range and allelic richness (r2 = 0.211, df = 12, P = 0.098). (D) A weak nonsignificant positive linear relationship exists between estimated global census size and mean allelic richness (r2 = 0.159, df = 12, P = 0.159).
Acropora walindii* exhibited low allelic richness across all eight loci, suggesting that it is genetically eroded (Table 6). Furthermore, allelic fixation was detected at three loci for A. walindii*. Allele fixation was not restricted to rare species and additional examples of fixed loci are present in the Heron Island A. valida, Japan A. papillare*, and Majuro A. austera populations (Table 6). The most common locus to be fixed was Amil2_023. Mean allelic richness was greatest in A. microphthalma and this is driven largely by the 20 different alleles detected at locus Amil5_028 in the Seychelles population (Appendix 2). Mean expected heterozygosity was greatest in A. rongelapensis*, which was unexpected because it is the rarest of all species examined in this study.
Table 6.
Patterns of allelic richness between species/populations across the eight loci examined
| Species (min. pop. size) | Population | Amil2_02 | Amil2_06 | Amil5_028 | Amil2_022 | Amil2_023 | Amil2_07 | Amil2_010 | Amil2_012 |
|---|---|---|---|---|---|---|---|---|---|
| Acropora pichoni* (6) | Kimbe Bay | 2.879 | 2.404 | 3.564 | NA | 2.24 | 2 | 2.182 | 3.309 |
| Chuuk | 3.309 | 2.715 | 3.343 | NA | 1.745 | 3 | 3.233 | 3.309 | |
| Overall mean | 3.12 | 2.67 | 3.499 | NA | 1.965 | 2.414 | 2.755 | 3.208 | |
| A. millepora (18) | Palm Islands | 2.993 | 3.908 | 3.948 | 13.305 | 3 | 3 | 11.224 | 1.91 |
| Ningaloo | 4.093 | 4.296 | 5.791 | 9.118 | 5.431 | 5.937 | 10.837 | 6.292 | |
| Overall mean | 3.575 | 4.342 | 6.074 | 11.024 | 4.431 | 7.263 | 13.845 | 5.306 | |
| A. austera (12) | Majuro | 4 | 4 | 4 | NA | 1 | NA | 1 | NA |
| Arno | 4.714 | 3.857 | 3.571 | NA | 1.999 | NA | 1 | NA | |
| Maldives | 5.659 | 4.956 | 2.807 | NA | 2.994 | NA | 5.039 | NA | |
| Overall mean | 5.772 | 5.659 | 4.434 | NA | 2.899 | NA | 4.311 | NA | |
| A. papillare* (14) | Ningaloo | 2 | 3.382 | 5.453 | 7.789 | 6.228 | NA | 6.131 | 4.444 |
| Palm Islands | 5.993 | 2.7 | 7.23 | 11.13 | 4.378 | NA | 6.231 | 3.695 | |
| Japan | 6 | 4 | 4 | 4 | 4 | NA | 5 | 1 | |
| Overall mean | 6.659 | 6.307 | 8.86 | 10.781 | 5.476 | NA | 7.162 | 5.289 | |
| A. microphthalma (19) | Kimbe Bay | 10.916 | 4.706 | 5.598 | NA | 5.892 | 5.598 | 8.921 | 5.455 |
| Seychelles | 7.696 | 7.68 | 11.045 | NA | 3 | 6.711 | 10.909 | 5.846 | |
| Maldives | 3 | 6 | 7 | NA | 4 | 5 | 6 | 6 | |
| Palm Islands | 5.711 | 4.848 | 3.711 | NA | 3.968 | 4.848 | 5.832 | 5.711 | |
| Overall mean | 10.8 | 7.086 | 9.288 | NA | 5.198 | 7.554 | 10.115 | 6.708 | |
| A. valida (20) | Palm Islands | 4.287 | 5.597 | 12.168 | PP | 3.505 | NA | 2.69 | 1.907 |
| Heron Island | 6.808 | 3 | 3 | PP | 1 | NA | 1.997 | 1 | |
| Kimbe Bay | 6 | 6 | 15 | PP | 4 | NA | 5 | 2 | |
| Overall mean | 7.022 | 6.629 | 13.843 | PP | 3.608 | NA | 4.621 | 2 | |
| A. kirstyae* (27) | Palm Islands | 2 | 3.994 | 6.994 | 13.65 | 6.825 | 5 | 4.957 | 5 |
| A. kimbeensis* (14) | Kimbe Bay | 6 | 4 | 10 | PP | 3.995 | 2 | 6.786 | 3.929 |
| A. horrida (27) | Palm Islands | 2.617 | 7.292 | 8.347 | 7.761 | 3.478 | 2 | 3.943 | 4.833 |
| A. walindii* (14) | Kimbe Bay | 1.76 | 1.791 | 2.624 | 2.002 | 1 | 1 | 1.286 | 1 |
| A. jacquelineae* (19) | Kimbe Bay | 3 | 2.636 | 3.283 | NA | 4.895 | 3 | 4 | 2 |
| A. spathulata* (26) | Palm Islands | 1.462 | 2.924 | 3.993 | 3.92 | 2 | NA | 7.113 | 4.33 |
| A. rongelapensis* (12) | Rongelap Atoll | 6 | 5 | 8 | NA | 3 | 4 | 5 | 5 |
| A. tortuosa* (12) | Rongelap Atoll | 4 | 3 | 4 | 4 | 2 | NA | 2 | 5 |
A wide range of variation in allelic richness was encountered within and between species. Allelic richness could not be calculated for some populations at loci Amil2_022 because more than two alleles were encountered and we hypothesize that locus-specific duplication events have occurred. PP, polyploid; NA, not applicable.
No significant difference (P < 0.05) could be detected in the level of expected heterozygosity (U = 16, P = 0.524) nor allelic richness (U = 13.5, P = 0.230) between species that are numerically rare versus common. We tested whether there was a significant difference in the level of expected heterozygosity and allelic richness in species that are geographically restricted versus widespread, and again no significant difference (P < 0.05) was apparent (U = 19, P = 0.386 and U = 10.5, P = 0.109). We further examined the strength of linear and nonlinear relationships between genetic diversity and rarity metrics and the strength of the relationship (Table 7), and found that no significant linear or nonlinear relationships exist between expected heterozygosity and global range size or global census size (Figs. 4a and b). Similarly, there are no significant linear or nonlinear relationships between allelic richness and global range size or global census size (Figs. 4c and d).
Table 7.
Regression statistics showing the strength and significance of linear and non-linear relationships between range size or census size and allelic richness or expected heterozygosity
| Association | Relationship | r2 | df | P | Sig. <0.05 |
|---|---|---|---|---|---|
| Range size and allelic richness | Linear | 0.211 | 12 | 0.098 | NS |
| Polynomial | 0.235 | 11 | 0.229 (x = 0.383; x2 = 0.570) | NS | |
| Range size and expected heterozygosity | Linear | 0.015 | 12 | 0.680 | NS |
| Polynomial | 0.235 | 11 | 0.229 (x = 0.117; x2 = 0.103) | NS | |
| Census size and allelic richness | Linear | 0.159 | 12 | 0.159 | NS |
| Polynomial | 0.159 | 11 | 0.386 (x = 0.809; x2 = 0.978) | NS | |
| Census size and expected heterozygosity | Linear | 0.005 | 12 | 0.812 | NS |
| Polynomial | 0.056 | 11 | 0.729 (x = 0.480; x2 = 0.457) | NS |
NS, nonsignificant.
Inbreeding
After correction for null alleles, FIS values were extremely variable ranging from 0.54 to 0.215. The most highly inbred population was the Heron Island A. valida population followed by the Kimbe Bay A. pichoni* population (Fig. 5). There was no significant difference in the level of inbreeding between rare and common species (U = 21, P = 0.841) or between geographically restricted and widespread species (U = 19, P = 0.641).
Figure 5.
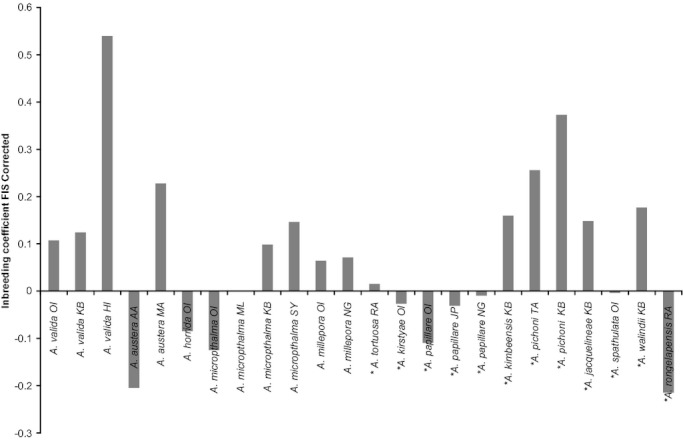
Level of inbreeding (FIS) in rare and common corals from different locations. Data corrected for null alleles (with the exception of Heron Island A. valida; Kimbe Bay and Chuuk Atoll A. pichoni*; and Kimbe Bay A. walindii*). Species are listed from most widespread (A. valida) to most geographically restricted (A. rongelapensis*). Rare species are denoted by an asterisk. Positive FIS values suggest heterozygote deficit, negative FIS values suggest heterozygote excess.
Discussion
Our comparison of genetic diversity shows that, in general, there is a large amount of variability in the level of genetic diversity in Acropora spp with varying degrees of rarity. Contrary to expectations of neutral genetic theory, the rare Acropora species studied here do not have significantly lower genetic diversity (or higher levels of inbreeding) than common species. Thus, the association between the degree of rarity and genetic diversity in Indo–Pacific Acropora is not a simple positive linear relationship. For example, A. walindii* is restricted to Kimbe Bay in Papua New Guinea (Wallace 1999) and it has an estimated global population size of only 1231 ± 615 individuals (Richards et al. 2008). A. walindii has exceedingly low genetic diversity and allele fixation is evident at 3 loci. Conversely, A. rongelapensis* has high genetic diversity with heterozygote excess at 6/7 loci and 100% observed heterozygosity (HO) at three loci despite having an exceptionally small estimated global census size of only (224 ± 117 individuals) (Richards et al. 2008).
Our results supplement a growing number of rare/common comparative studies in plants that challenge the traditional neutral genetic theory by demonstrating the absence of a significant positive relationship between rarity and genetic diversity (see Karron 1987, 1991; Hamrick and Godt 1990; Young and Brown 1996; Gitzendanner and Soltis 2000; Ellis et al. 2006). Factors which can lead to significant deviations from neutral theory in finite populations have recently been reviewed (Frankham 2012) and include balancing selection, selective sweeps and background selection. While the practical limitations of this study precludes a robust test of neutral genetic theory, our results provide a novel attempt at integrating population demography and genetics, which is urgently needed to address issues related to the effects of climate change on species range and persistence (Lavergne et al. 2010).
The wide range of variation we found between species with differing degrees of rarity undoubtedly reflects a range of population genetic factors. The fixed heterozygosity at three loci in A. rongelapensis*, the rarest species we examined in this study, may be explained in various ways. First, while asexual reproduction could result in fixed heterozygosity, no identical MLGs were identified. Second, high heterozygosity may reflect an old, stable, and persistent population or recruits that are derived from various genetically divergent sources (van Herwerden et al. 2009). However, these explanations are not relevant here as A. rongelapensis* is a member of the large terminal clade in the Acropora phylogeny that is considered relatively young (<5 my – Richards et al. 2008) and only a small number of isolated populations of A. rongelapensis* have been located across its continuous distribution range.
The preferred explanation for the finding of 100% observed heterozygosity at 3 loci in A. rongelapensis* is interspecific hybridization. Hybridization has been demonstrated previously in Acropora communities, namely in the Caribbean where only three extant species exist, and A. prolifera was found to be the product of hybridization between A. palmata and A. cervicornis (van Oppen et al. 2000; Vollmer and Palumbi 2002). We hypothesize that the individuals of A. rongelapensis examined in this study are F1 hybrids; however, the parental lineages have not been established to date. It is likely that hybridization may also have contributed to the higher than expected genetic diversity in other rare species (e.g., A. kimbeensis*). The proposition that some rare species have hybrid ancestries is further supported by a phylogenetic analysis of nuclear and mitochondrial DNA that shows that some rare species are monophylotic for mitochondrial DNA and polyphyletic for nuclear DNA (Richards et al. 2008).
Furthermore, the finding of gene duplication events at Amil2_022 in A. kimbeensis* supports the suggestion that hybridization is a mechanism driving the evolution of genetic diversity in rare species. Single locus duplication events have been reported in another microsatellite study involving A. millepora (Wang et al. 2008). Chimerism (where juveniles settle together and fuse – Barki et al. 2002; Puill-Stephan et al. 2009) and the retention of a polar body during fertilization (Baums et al. 2005b) were suggested as possible explanations for the occurrence of more than two alleles per locus. Chimerism is not likely to explain our observations because DNA was examined from a small portion of a single branch only. It is possible that Amil2_022 is not a single copy marker; however, the finding that duplication was restricted to a few individuals indicates that this may also reflect a recent region-specific duplication event caused by transposable element activity, replication slippage, or aberrant crossing over (Bennetzen 2002). Another possible mechanism for tri-allelic patterns is somatic mutations that result in genetic mosaics (van Oppen et al. 2011a). We suggest that gene/genome duplication events should be further examined as mechanisms that drive the evolution of genetic diversity in corals (for further discussion of gene duplication see Stebbins 1940; Ohno 1970; Lynch and Conery 2000; Zhang 2003).
Populations with low genetic diversity (such as A. walindii*, A. pichoni*, and A. jacquelineae* in Kimbe Bay and A. papillare* in Japan) may be more vulnerable and have a higher probability of local extinction following disturbance. Local extinction (the disappearance of a species from part of it range) and ecological extinction (when a species is reduced to such low abundance that, although still present, it no longer plays its typical ecological role) are precursors to global extinction. Data here suggest that some populations of common Acropora species may be more vulnerable to local extinction events than previously thought. For example, the A. valida population at Heron Island had low genetic diversity, significant heterozygote deficits, and some alleles are fixed. Heterozygote deficits are commonly caused by clonality, null alleles, inadvertently sampling disparate populations (i.e., Wahlund effects, Wahlund 1928) or inbreeding (Wright 1922). In this analysis, clonality and null alleles can be excluded as possible explanations for the observed deficits. Moreover, evidence presented suggests that inbreeding is the primary explanation for heterozygote deficits (e.g., for A. valida at Heron Island); however, we cannot exclude the possibility that Wahlund effects may have contributed to the observed deficits.
The concept of corals having low genetic diversity and low Ne is counterintuitive, given that corals such as Acropora have the potential for very high fecundity, in addition to high levels of outbreeding and gene flow (both of which renew genetic variation and increase Ne; Caballero and Hill 1992). A meta-analysis which tested for deviations from the predicted positive linear association between genetic diversity and population size suggests that species with high fecundity (such as fish, oysters, shrimp, and seaweed) have significantly reduced Ne/N ratios (Frankham 2012). Thus, despite most corals having high fecundity, they tend to experience very high mortalities in the early life stages, and for any given year, most of the recruited young may be derived from a few large parents, hence there is high variance in progeny number, and consequently, Ne is likely to be small (Hughes et al. 1992; Hedgecock 1994).
An unexpected outcome of this study was our finding that despite being a taxonomically diverse group in the Indo–Pacific, our overall mean estimate of genetic diversity is quite low in comparison with the mean non-Acropora scleractinian diversity estimate reported by Shearer et al. (2009) (7.94 alleles per species specific locus, see Fig. 6). After correction for uneven sample sizes, the mean number of alleles per locus reported across the 25 Acropora populations was 4.64 (±0.2 SE) alleles per locus. This level of genetic diversity is just over half of the “conservative mean” presented for non-Acropora corals and more closely resembles those reported from isolated high latitude populations (Miller and Ayre 2008a,b). All of the mean estimates of genetic diversity presented here for Indo–Pacific Acropora are well short of the number presented for A. palmata, a rare species endemic to the Atlantic Ocean (mean 14.4).
Figure 6.
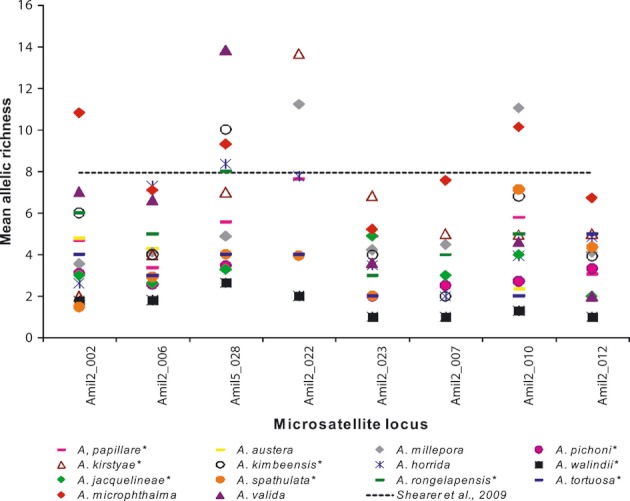
Mean allelic richness for all species/loci examined in this study showing that most Acropora species have lower mean allelic richness than what is considered a “conservative mean” in a review of scleractinian coral genetic diversity (Shearer et al. 2009 – pertaining to non-Acropora corals only).
To confirm the hypothesis that Acropora have lower genetic diversity than other types of corals, genetic diversity estimates could be corrected for differential mutation rates, or genome scans based on, for example, single nucleotide polymorphisms could provide a more accurate picture of functional genetic diversity across a large portion of the genome.
Field observations and mesocosm results in other systems jointly support the hypothesis that genotypic diversity is important in providing different responses to environmental variation (Whitham et al. 2003; Gamfeldt et al. 2005; Hughes and Stachowicz 2009; Wang et al. 2012). However, while our results suggest that some populations of rare and common species have low genetic diversity, it would be erroneous to directly infer anything about the adaptive potential of these populations or the way they will respond to climate change. Microsatellite markers are generally considered neutral (Estoup and Angers 1998) and hence they are not functionally constrained or under selection (Frankham et al. 2010). Thus, for the loci examined here, genetic drift and gene flow, rather than selection, determine their allele number and heterozygosity. Therefore, the finding of low genetic diversity at the relatively small number of neutral loci examined here may not be functionally informative. We recommend that further robust species-specific population estimates at neutral and functional loci are required to fully understand the relationship between genetic diversity, adaptive potential, and persistence.
The conservation implications of this study are found in both theory and practice. Theoretically, we show that there is a large amount of variability in the genetic diversity of Acropora corals, which appears to be driven by processes other than rarity. We do not go so far as to suggest that rarity has a minor impact on genetic diversity (see Gillespie 2001; Bazin et al. 2006); however, the finding of nondepletion in some rare species and depletion in some common species suggests that genetic diversity is governed by a complex range of factors. Practically, we emphasize that three of the species which are shown here to have exceptionally low levels of genetic diversity (A. walindii*, A. jacquelineae*, and A. papillare* at Japan) are listed by the IUCN as “Vulnerable,” meaning that they have an elevated risk of extinction risk this century (see Carpenter et al. 2008). The finding of low genetic diversity in these species further exacerbates their threatened status and we propose that targeted species monitoring and management intervention may be necessary to safeguard these species.
Acknowledgments
Z. R. would like to thank Lesa Peplow and Andy Muirhead from the Australian Institute of Marine Science for assistance with genotyping. Thanks to staff from the JCU Advanced Analytical Centre. Thanks also to staff of the Orpheus Island Research Station, the College of the Marshall Islands, and the Walindii Research Station; to all colleagues who collected samples that were used in this study (Maria Beger, Paul Muir, Natalie Rosser, Akira Aguichi, David Abrego); to Carden Wallace from the Museum of Tropical Queensland, for verifying coral identifications; and to Barbara Done, for assistance with specimen curation; to Silvia Pinca, for A. rongelapensis photo; and to Professor Richard Frankham, for useful discussions that helped to improve this manuscript. This research was funded via a scholarship to Z. R. from James Cook University, Smart State PhD Funding and ISRS Fellowship awarded to Z. R.
Appendix 1.
Species, population, locus, and number of samples (N), alleles (A), expected (He), and observed (HO) heterozygosity. Inbreeding coefficient (FIS), null alleles (Null), corrected inbreeding coefficient (FISC). Large allele drop-out (LAD), not enough data (NED), not applicable (NA). Asterisks indicate significant deviations from Hardy–Weinberg equilibrium (P < 0.05).
| Locus | N | A | He | HO | FIS | Null | FISC | ||
|---|---|---|---|---|---|---|---|---|---|
| Acropora microphthalma | Kimbe Bay | 2 | 23 | 12 | 0.849 | 0.826 | 0.105 | No | 0.105 |
| 6 | 23 | 5 | 0.691 | 0.783 | –0.147 | No | –0.147 | ||
| 28 | 23 | 6 | 0.509 | 0.435 | 0.096 | No | 0.096 | ||
| 22 | NA | NA | NA | NA | NA | No | NA | ||
| 23 | 23 | 6 | 0.778 | 0.652 | 0.136* | No | 0.136 | ||
| 7 | 22 | 6 | 0.478 | 0.045 | 0.92* | Yes | 0.119 | ||
| 10 | 25 | 10 | 0.728 | 0.72 | 0.031 | No | 0.031 | ||
| 12 | 25 | 6 | 0.406 | 0.32 | 0.232* | No | 0.232 | ||
| Seychelles | 2 | 22 | 8 | 0.747 | 0.611 | 0.141 | No | 0.141 | |
| 6 | 22 | 7 | 0.638 | 0.529 | 0.191 | No | 0.191 | ||
| 28 | 22 | 20 | 0.787 | 0.389 | 0.515* | Yes | 0.169 | ||
| 22 | NA | NA | NA | NA | NA | NA | NA | ||
| 23 | 22 | 3 | 0.575 | 0.714 | –0.171 | No | –0.171 | ||
| 7 | 22 | 7 | 0.702 | 0.591 | 0.181* | No | 0.181 | ||
| 10 | 22 | 12 | 0.778 | 0.545 | 0.32* | Yes | 0.267 | ||
| 12 | 22 | 6 | 0.635 | 0.318 | 0.516* | Yes | 0.115 | ||
| Maldives | 2 | 19 | 3 | 0.661 | 0.579 | 0.15 | No | 0.15 | |
| 6 | 19 | 6 | 0.726 | 0.789 | –0.061 | No | –0.061 | ||
| 28 | 19 | 7 | 0.74 | 0.684 | 0.102 | No | 0.068 | ||
| 22 | NA | NA | NA | NA | NA | NA | NA | ||
| 23 | 19 | 4 | 0.35 | 0.421 | –0.176 | No | –0.176 | ||
| 7 | 19 | 5 | 0.56 | 0.333 | 0.566 | Yes | 0.186 | ||
| 10 | 19 | 5 | 0.738 | 0.533 | 0.176* | Yes | 0.16 | ||
| 12 | 19 | 5 | 0.616 | 0.867 | –0.397 | No | –0.397 | ||
| Orpheus Island | 2 | 22 | 6 | 0.624 | 0.773 | –0.216 | No | –0.216 | |
| 6 | 22 | 5 | 0.636 | 0.818 | –0.264 | No | –0.264 | ||
| 28 | 22 | 4 | 0.17 | 0.091 | 0.485 | Yes | –0.05 | ||
| 22 | NA | NA | NA | NA | NA | NA | NA | ||
| 23 | 22 | 4 | 0.458 | 0.273 | 0.423* | Yes | 0.133 | ||
| 7 | 22 | 5 | 0.522 | 0.409 | 0.238 | No | 0.238 | ||
| 10 | 22 | 6 | 0.667 | 0.864 | –0.273 | No | –0.273 | ||
| 12 | 22 | 6 | 0.674 | 0.909 | –0.329* | No | –0.329 | ||
| A. valida | Orpheus Island | 2 | 28 | 6 | 0.596 | 0.357 | 0.281* | Yes | 0.028 |
| 6 | 25 | 6 | 0.728 | 0.52 | 0.238* | Yes | 0.105 | ||
| 28 | 26 | 13 | 0.877 | 0.654 | 0.231* | Yes | 0.225 | ||
| 22 | NA | NA | NA | NA | NA | NA | NA | ||
| 23 | 27 | 4 | 0.141 | 0.074 | 0.378 | Yes | 0.043 | ||
| 7 | 28 | 7 | 0.694 | 0.179 | 0* | No | 0 | ||
| 10 | 28 | 3 | 0.364 | 0.321 | 0.143 | No | 0.143 | ||
| 12 | 28 | 2 | 0.069 | 0 | 1* | No | 1 | ||
| Heron Island | 2 | 17 | 7 | 0.78 | 0.588 | 0.223 | NED | 0.223 | |
| 6 | 13 | 3 | 0.506 | 0.077 | 0.727* | NED | 0.727 | ||
| 28 | 14 | 3 | 0.612 | 0 | 0.87* | NED | 0.87 | ||
| 22 | NA | NA | NA | NA | NA | NA | NA | ||
| 23 | 16 | 1 | 0 | 0 | 0 | NED | 0 | ||
| 7 | NA | NA | NA | NA | NA | NED | NA | ||
| 10 | 17 | 2 | 0.111 | 0.118 | –0.045 | NED | –0.045 | ||
| 12 | 17 | 1 | 0 | 0 | 0 | NED | 0 | ||
| Kimbe Bay | 2 | 19 | 6 | 0.735 | 0.737 | 0 | No | 0 | |
| 6 | 19 | 6 | 0.719 | 0.368 | 0.535* | Yes | 0 | ||
| 28 | 19 | 15 | 0.904 | 0.421 | 0.571* | Yes | 0.085 | ||
| 22 | NA | NA | NA | NA | NA | No | NA | ||
| 23 | 19 | 4 | 0.389 | 0.368 | 0.089 | No | 0.089 | ||
| 7 | 19 | 4 | 0.609 | 0.105 | 0* | No | 0 | ||
| 10 | 19 | 5 | 0.503 | 0.368 | 0.3* | No | 0.3 | ||
| 12 | 19 | 2 | 0.188 | 0 | 1* | Yes | 0.3 | ||
| A. austera | Majuro | 2 | 12 | 4 | 0.462 | 0.417 | 0.141 | No | 0.141 |
| 6 | 12 | 4 | 0.66 | 0.417 | 0.405 | No | 0.405 | ||
| 28 | 12 | 4 | 0.601 | 0.25 | 0.612* | Yes | 0.12 | ||
| 22 | NA | NA | NA | NA | NA | NA | NA | ||
| 23 | 11 | 1 | 0 | 0 | 0 | No | 0 | ||
| 7 | NA | NA | NA | NA | NA | No | NA | ||
| 10 | 12 | 1 | 0 | 0 | 0 | No | 0 | ||
| 12 | NA | NA | NA | NA | NA | NA | NA | ||
| Arno | 2 | 14 | 5 | 0.666 | 0.857 | –0.253 | No | –0.253 | |
| 6 | 14 | 4 | 0.666 | 0.857 | –0.253 | No | –0.253 | ||
| 28 | 10 | 4 | 0.27 | 0.3 | –0.04 | No | –0.04 | ||
| 22 | NA | NA | NA | NA | NA | NA | NA | ||
| 23 | 14 | 2 | 0.191 | 0.214 | –0.083 | No | –0.083 | ||
| 7 | NA | NA | NA | NA | NA | NA | NA | ||
| 10 | 14 | 1 | 0 | 0 | 0 | No | NA | ||
| 12 | NA | NA | NA | NA | NA | NA | NA | ||
| Maldives | 2 | 28 | 7 | 0.733 | 0.786 | –0.054 | No | –0.054 | |
| 6 | 28 | 6 | 0.625 | 0.536 | 0.161 | No | 0.161 | ||
| 28 | 28 | 3 | 0.307 | 0.286 | 0.087 | No | 0.087 | ||
| 22 | NA | NA | NA | NA | NA | NA | NA | ||
| 23 | 29 | 3 | 0.511 | 0.586 | –0.131 | No | –0.131 | ||
| 7 | NA | NA | NA | NA | NA | NA | NA | ||
| 10 | 29 | 6 | 0.728 | 0.655 | 0.118* | No | 0.118 | ||
| 12 | 29 | 6 | 0.702 | 0.448 | 0* | No | NA | ||
| A. papillare | Ningaloo | 2 | 28 | 3 | 0.07 | 0.036 | 0.5* | Yes | –0.038 |
| 6 | 28 | 4 | 0.563 | 0.179 | 0.692* | Yes | –0.041 | ||
| 28 | 28 | 6 | 0.735 | 0.357 | 0.528* | Yes | 0.028 | ||
| 22 | 25 | 9 | 0.788 | 1 | –0.25* | No | –0.25 | ||
| 23 | 25 | 7 | 0.626 | 0.6 | 0.061 | No | 0.061 | ||
| 7 | NA | NA | NA | NA | NA | NA | NA | ||
| 10 | 28 | 7 | 0.721 | 0.571 | 0.225* | Yes | 0.015 | ||
| 12 | 26 | 5 | 0.57 | 0.462 | 0.208* | No | 0.208 | ||
| Orpheus Island | 2 | 20 | 7 | 0.639 | 0.75 | 0.164 | No | 0.164 | |
| 6 | 20 | 3 | 0.411 | 0.2 | 0.532* | Yes | –0.282 | ||
| 28 | 20 | 8 | 0.8 | 0.8 | 0.026 | No | 0.026 | ||
| 22 | 20 | 14 | 0.814 | 1 | –0.204 | No | –0.204 | ||
| 23 | 20 | 5 | 0.585 | 0.15 | 0.755* | Yes | –0.078 | ||
| 7 | 20 | 3 | 0.421 | 0.15 | 0* | No | 0 | ||
| 10 | 20 | 7 | 0.706 | 0.75 | –0.036 | No | –0.036 | ||
| 12 | 20 | 4 | 0.554 | 0.8 | –0.424 | No | –0.424 | ||
| Japan | 2 | 14 | 6 | 0.755 | 0.643 | 0.185* | No | 0.185 | |
| 6 | 14 | 4 | 0.543 | 0.571 | –0.015 | No | –0.015 | ||
| 28 | 14 | 4 | 0.707 | 0.071 | 0.906* | NED | 0.906 | ||
| 22 | 14 | 4 | 0.612 | 0.857 | –0.368 | No | –0.368 | ||
| 23 | 14 | 4 | 0.199 | 0.143 | 0.316 | No | 0.316 | ||
| 7 | 14 | 4 | 0.487 | 0.643 | 0 | No | 0 | ||
| 10 | 14 | 5 | 0.691 | 0.714 | 0.004 | No | 0.004 | ||
| 12 | 14 | 1 | 0 | 0 | 0 | No | 0 | ||
| A. millepora | Orpheus Island | 2 | 26 | 3 | 0.556 | 0.385 | 0.326 | No | 0.326 |
| 6 | 26 | 4 | 0.499 | 0.385 | 0.248* | No | 0.248 | ||
| 28 | 26 | 4 | 0.362 | 0.192 | 0.485* | Yes | 0.162 | ||
| 22 | 26 | 16 | 0.873 | 0.846 | 0.05 | No | 0.05 | ||
| 23 | 26 | 3 | 0.473 | 0.308 | 0.367* | Yes | 0.006 | ||
| 7 | 18 | 3 | 0.642 | 0 | 1* | Yes | 1 | ||
| 10 | 26 | 13 | 0.749 | 0.731 | 0.044 | No | 0.044 | ||
| 12 | 26 | 2 | 0.074 | 0.077 | –0.02 | No | –0.02 | ||
| Ningaloo | 2 | 32 | 5 | 0.409 | 0.469 | –0.131 | No | –0.131 | |
| 6 | 32 | 5 | 0.445 | 0.156 | 0.658* | Yes | 0.168 | ||
| 28 | 33 | 6 | 0.786 | 0.394 | 0.51* | Yes | 0.155 | ||
| 22 | 33 | 12 | 0.805 | 0.727 | 0.112 | No | 0.112 | ||
| 23 | 33 | 7 | 0.597 | 0.515 | 0.152 | No | 0.152 | ||
| 7 | 32 | 7 | 0.754 | 0.219 | 0.718* | Yes | –0.084 | ||
| 10 | 33 | 13 | 0.865 | 0.576 | 0.348* | Yes | 0.102 | ||
| 12 | 33 | 7 | 0.648 | 0.333 | 0.498* | Yes | 0.022 | ||
| A. pichoni | Kimbe Bay | 2 | 6 | 6 | 0.694 | 0.5 | 0.362 | NED | 0.362 |
| 6 | 6 | 3 | 0.611 | 0 | 1* | NED | 1 | ||
| 28 | 6 | 8 | 0.847 | 0.833 | 0.107 | NED | 0.107 | ||
| 22 | NA | NA | NA | NA | NA | NED | NA | ||
| 23 | 6 | 4 | 0.514 | 0.5 | 0.118 | NED | 0.118 | ||
| 7 | 2 | 2 | 0.375 | 0.5 | 0 | NED | 0 | ||
| 10 | 6 | 3 | 0.542 | 0.167 | 0.737 | NED | 0.737 | ||
| 12 | 6 | 6 | 0.806 | 0.667 | 0.259 | NED | 0.259 | ||
| Truk | 2 | 6 | 6 | 0.806 | 1 | –0.154 | NED | –0.154 | |
| 6 | 6 | 5 | 0.667 | 0.5 | 0.333 | NED | 0.333 | ||
| 28 | 6 | 7 | 0.806 | 0.833 | 0.057 | NED | 0.057 | ||
| 22 | NA | NA | NA | NA | NA | NED | NA | ||
| 23 | 6 | 2 | 0.375 | 0.5 | –0.25 | NED | –0.25 | ||
| 7 | 2 | 3 | 0.625 | 0.5 | 0.5 | NED | 0.5 | ||
| 10 | 5 | 5 | 0.78 | 0.6 | 0.333 | NED | 0.333 | ||
| 12 | 6 | 6 | 0.806 | 0.333 | 0.643* | NED | 0.643 | ||
| A. horrida | Orpheus Island | 2 | 26 | 3 | 0.144 | 0.038 | 0.742* | Yes | 0.059 |
| 6 | 26 | 8 | 0.803 | 0.346 | 0.582* | Yes | 0.019 | ||
| 28 | 26 | 10 | 0.686 | 0.346 | 0.51* | Yes | 0.067 | ||
| 22 | 22 | 8 | 0.834 | 0.364 | 0.579* | Yes | 0.012 | ||
| 23 | 23 | 4 | 0.427 | 0.565 | –0.303 | No | –0.303 | ||
| 7 | 17 | 2 | 0.457 | 0 | 1* | Yes | –0.333 | ||
| 10 | 18 | 4 | 0.335 | 0.389 | –0.133 | No | –0.133 | ||
| 12 | 18 | 5 | 0.466 | 0.611 | –0.285 | No | –0.285 | ||
| A. jacquelineae | Orpheus Island | 2 | 17 | 3 | 0.631 | 0.529 | 0.191 | No | 0.191 |
| 6 | 17 | 3 | 0.258 | 0.176 | 0.342 | No | 0.342 | ||
| 28 | 17 | 4 | 0.306 | 0.176 | 0.448 | No | 0.448 | ||
| 22 | NA | NA | NA | NA | NA | No | NA | ||
| 23 | 19 | 7 | 0.578 | 0.789 | –0.343 | No | –0.343 | ||
| 7 | 11 | 3 | 0.657 | 0.545 | 0.216* | No | 0.216 | ||
| 10 | 11 | 4 | 0.442 | 0.455 | 0.02 | No | 0.02 | ||
| 12 | 11 | 2 | 0.236 | 0.091 | 0.643 | No | 0.643 | ||
| A. kimbeensis | Kimbe Bay | 2 | 13 | 6 | 0.719 | 0.385 | 0.496* | Yes | 0.163 |
| 6 | 13 | 4 | 0.666 | 0.538 | 0.229 | No | 0.229 | ||
| 28 | 13 | 10 | 0.858 | 0.615 | 0.319 | Yes | 0.319 | ||
| 22 | NA | NA | NA | NA | NA | No | NA | ||
| 23 | 14 | 4 | 0.459 | 0.143 | 0.708* | Yes | 0.071 | ||
| 7 | 13 | 2 | 0.497 | 0.462 | 0.111 | No | 0.111 | ||
| 10 | 14 | 7 | 0.694 | 0.857 | –0.2 | No | –0.2 | ||
| 12 | 14 | 4 | 0.656 | 0.429 | 0.378 | No | 0.378 | ||
| A. tortuosa | Rongelap Atoll | 2 | 12 | 4 | 0.462 | 0.25 | 0.492* | Yes | 0.135 |
| 6 | 12 | 3 | 0.559 | 0.25 | 0.582* | Yes | –0.021 | ||
| 28 | 12 | 4 | 0.608 | 0.25 | 0.616* | LAD | 0.616 | ||
| 22 | 12 | 4 | 0.563 | 0.917 | –0.603 | No | –0.603 | ||
| 23 | 12 | 2 | 0.153 | 0.167 | –0.048 | No | –0.048 | ||
| 7 | NA | NA | NA | NA | NA | NA | NA | ||
| 10 | 12 | 2 | 0.278 | 0.333 | –0.158 | No | –0.158 | ||
| 12 | 12 | 5 | 0.778 | 0.833 | –0.028 | No | –0.028 | ||
| A. kirstyae | Orpheus Island | 2 | 24 | 2 | 0.499 | 0.125 | 0.759* | Yes | –0.004 |
| 6 | 24 | 4 | 0.582 | 0.167 | 0.724* | Yes | –0.129 | ||
| 28 | 24 | 7 | 0.777 | 0.583 | 0.269 | LAD | 0.269 | ||
| 22 | 23 | 14 | 0.765 | 0.913 | –0.173 | No | –0.173 | ||
| 23 | 23 | 7 | 0.433 | 0.348 | 0.218 | No | 0.218 | ||
| 7 | 22 | 5 | 0.249 | 0.136 | 0.471* | Yes | –0.122 | ||
| 10 | 23 | 5 | 0.631 | 0.826 | –0.288 | No | –0.288 | ||
| 12 | 23 | 5 | 0.632 | 0.609 | 0.06* | No | 0.06 | ||
| A. spathulata | Orpheus Island | 2 | 26 | 2 | 0.038 | 0.038 | 0* | No | 0 |
| 6 | 26 | 3 | 0.443 | 0.077 | 0.832* | Yes | –0.098 | ||
| 28 | 24 | 4 | 0.666 | 0.5 | 0.269* | No | 0.269 | ||
| 22 | 13 | 4 | 0.388 | 0.154 | 0.628* | Yes | 0.13 | ||
| 23 | 12 | 2 | 0.153 | 0.167 | –0.048 | No | –0.048 | ||
| 7 | NA | NA | NA | NA | NA | No | NA | ||
| 10 | 20 | 8 | 0.8 | 0.9 | –0.1 | No | –0.1 | ||
| 12 | 22 | 5 | 0.546 | 0.636 | –0.142 | No | –0.142 | ||
| A. walindii | Kimbe Bay | 2 | 14 | 2 | 0.408 | 0.571 | –0.368 | NED | –0.368 |
| 6 | 13 | 2 | 0.426 | 0.154 | 0.662 | NED | 0.662 | ||
| 28 | 12 | 5 | 0.681 | 0.5 | 0.305 | NED | 0.305 | ||
| 22 | 14 | 3 | 0.518 | 0.5 | 0.071 | NED | 0.071 | ||
| 23 | 14 | 1 | 0 | 0 | 0 | NED | 0 | ||
| 7 | 2 | 1 | 0 | 0 | 0 | NED | 0 | ||
| 10 | 14 | 3 | 0.135 | 0.143 | –0.02 | NED | –0.02 | ||
| 12 | 14 | 1 | 0 | 0 | 0 | NED | 0 | ||
| A. rongelapensis | Rongelap Atoll | 2 | 12 | 6 | 0.722 | 1 | –0.347* | No | –0.347 |
| 6 | 12 | 5 | 0.726 | 0.75 | 0.01 | No | 0.01 | ||
| 28 | 12 | 8 | 0.83 | 0.833 | 0.039* | No | 0.039 | ||
| 22 | NA | NA | NA | NA | NA | No | NA | ||
| 23 | 12 | 3 | 0.538 | 1 | –0.846* | No | –0.846 | ||
| 7 | 12 | 4 | 0.726 | 0.917 | –0.222* | No | –0.222 | ||
| 10 | 12 | 5 | 0.694 | 0.667 | 0.083 | No | 0.083 | ||
| 12 | 12 | 5 | 0.674 | 1 | –0.451 | No | –0.451 |
Appendix 2.
Number of alleles per locus
| Species | Amil2_02 | Amil2_06 | Amil5_028 | Amil2_022 | Amil2_023 | Amil2_07 | Amil2_010 | Amil2_012 |
|---|---|---|---|---|---|---|---|---|
| Acropora micropthalma KB | 12 | 5 | 6 | 0 | 6 | 6 | 10 | 6 |
| A. micropthalma SY | 8 | 7 | 20 | 0 | 3 | 7 | 12 | 6 |
| A. micropthalma ML | 3 | 6 | 7 | 0 | 4 | 5 | 5 | 5 |
| A. micropthalma PI | 6 | 5 | 4 | 0 | 4 | 5 | 6 | 6 |
| A. valida PI | 6 | 6 | 13 | 0 | 4 | 7 | 3 | 2 |
| A. valida HI | 7 | 3 | 3 | 0 | 1 | 0 | 2 | 1 |
| A. valida KB | 6 | 6 | 15 | 0 | 4 | 4 | 5 | 2 |
| A. austera MA | 4 | 4 | 4 | 0 | 1 | 0 | 1 | 0 |
| A. austera AA | 5 | 4 | 4 | 0 | 2 | 0 | 1 | 0 |
| A. austera ML | 7 | 6 | 3 | 0 | 3 | 0 | 6 | 6 |
| A. millepora PI | 3 | 4 | 4 | 16 | 3 | 3 | 13 | 2 |
| A. millepora NG | 5 | 5 | 6 | 12 | 7 | 7 | 13 | 7 |
| A. horrida PI | 3 | 8 | 10 | 8 | 4 | 2 | 4 | 5 |
| A. papillare* NG | 3 | 4 | 6 | 9 | 7 | 0 | 7 | 5 |
| A. papillare* PI | 7 | 3 | 8 | 14 | 5 | 3 | 7 | 4 |
| A. papillare* JP | 6 | 4 | 4 | 4 | 4 | 4 | 5 | 1 |
| A. pichoni* KB | 6 | 3 | 8 | 0 | 4 | 2 | 3 | 6 |
| A. pichoni* L | 6 | 5 | 7 | 0 | 2 | 3 | 5 | 6 |
| A. jacquelineae* KB | 3 | 3 | 4 | 0 | 7 | 3 | 4 | 2 |
| A. kimbeensis* KB | 6 | 4 | 10 | 0 | 4 | 2 | 7 | 4 |
| A. tortuosa* RA | 4 | 3 | 4 | 4 | 2 | 0 | 2 | 5 |
| A. kirstyae* PI | 2 | 4 | 7 | 14 | 7 | 5 | 5 | 5 |
| A. spathulata* PI | 2 | 3 | 4 | 4 | 2 | 0 | 8 | 5 |
| A. walindii* KB | 2 | 2 | 5 | 3 | 1 | 1 | 3 | 1 |
| A. rongelapensis*RA | 6 | 5 | 8 | 0 | 3 | 4 | 5 | 5 |
Conflict of interest
None declared.
References
- Adjeroud M, Tsuchiya M. Genetic variation and clonal structure in the scleractinian coral Pocillopora damicornis in the Ryukyu Archipelago, southern Japan. Mar. Biol. 1999;134:753–760. [Google Scholar]
- Atchison AD, Sammarco PW, Brazeau DA. Genetic connectivity in corals on the flower garden banks and surrounding oil/gas platforms, Gulf of Mexico. J. Exp. Mar. Biol. Ecol. 2008;365:1–12. [Google Scholar]
- Avise JC. Molecular markers, natural history and evolution. New York: Chapman and Hall; 1994. [Google Scholar]
- Ayre DJ, Dufty S. Evidence for restricted gene flow in the viviparous coral Seriatopora hystrix on Australia's Great Barrier Reef. Evolution. 1994;48:1183–1201. doi: 10.1111/j.1558-5646.1994.tb05304.x. [DOI] [PubMed] [Google Scholar]
- Ayre DJ, Hughes TP. Genotypic diversity and gene flow in brooding and spawning corals along the Great Barrier Reef, Australia. Evolution. 2000;54:1590–1605. doi: 10.1111/j.0014-3820.2000.tb00704.x. [DOI] [PubMed] [Google Scholar]
- Ayre DJ, Hughes TP. Climate change, genotypic diversity and gene flow in reef-building corals. Ecol. Lett. 2004;7:273–278. [Google Scholar]
- Ayre DJ, Hughes TP, Standish RJ. Genetic differentiation, reproductive mode and gene flow in the brooding coral Pocillopora damicornis along the Great Barrier Reef, Australia. Mar. Ecol. Prog. Ser. 1997;159:175–187. [Google Scholar]
- Barki Y, Gateno D, Rinkevich B. Soft-coral natural chimerism: a window in ontogeny allows the creation of entities comprised of incongruous parts. Mar. Ecol. Prog. Ser. 2002;231:91–99. [Google Scholar]
- Baskauf CJ, McCauley DE, Eickmeier WG. Genetic analysis of a rare and a widespread species of Echinacea (Asteraceae) Evolution. 1994;48:180–188. doi: 10.1111/j.1558-5646.1994.tb01304.x. [DOI] [PubMed] [Google Scholar]
- Baums IB, Miller MW, Hellberg ME. Regionally isolated populations of an imperiled Caribbean coral, Acropora palmata. Mol. Ecol. 2005a;14:1377–1390. doi: 10.1111/j.1365-294X.2005.02489.x. [DOI] [PubMed] [Google Scholar]
- Baums IB, Hughes CR, Hellberg MH. Mendlian microsatellite loci for the Caribbean coral Acropora palmata. Mar. Ecol. Prog. Ser. 2005b;231:91–99. [Google Scholar]
- Baums IB, Miller MW, Hellberg ME. Geographic variation in clonal structure in a reef-building Caribbean coral, Acropora palmata. Ecol. Monogr. 2006;76:503–519. [Google Scholar]
- Baums IB, Johnson ME, Devlin-Durante MK, Miller MW. Host population genetic structure and zooxanthellae diversity of two reef-building coral species along the Florida Reef Tract and wider Caribbean. Coral Reefs. 2010;29:835–842. [Google Scholar]
- Bazin E, Glemin S, Galtier N. Population size does not influence mitochondrial genetic diversity in animals. Science. 2006;312:570–571. doi: 10.1126/science.1122033. [DOI] [PubMed] [Google Scholar]
- Benjamini Y, Hochberg Y. Controlling the false discovery rate: a practical and powerful approach to multiple testing. J. Roy. Stat. Soc. B. 1995;57:289–300. [Google Scholar]
- Benjamini Y, Yekutieli D. The control of false discovery rate under dependency. Ann. Stat. 2001;29:1165–1188. [Google Scholar]
- Bennetzen JL. Mechanisms and rates of genome expansion and contraction in flowering plants. Biomed. Life Sci. 2002;115:29–36. doi: 10.1023/a:1016015913350. [DOI] [PubMed] [Google Scholar]
- Benzie JAH, Haskell A, Lehman H. Variation in the genetic composition of coral (Pocillopora damicornis and Acropora palifera) populations from different reef habitats. Mar. Biol. 1995;121:731–739. [Google Scholar]
- Bongaerts P, Riginos C, Ridgeway T, Sampayo EM, van Oppen MJH, Engelbert N, et al. Genetic divergence across habitats in the widespread coral Seriatopora hystrix and its associated Symbiodinium. Plos One. 2010;5:e10871. doi: 10.1371/journal.pone.0010871. [DOI] [PMC free article] [PubMed] [Google Scholar]
- Brown JH. On the relationship between abundance and distribution. Am. Nat. 1984;124:225–279. [Google Scholar]
- Bruno JF, Selig ER, Casey KS, Page CA, Willis BL, Harvell CD, et al. Thermal stress and coral cover as drivers of coral disease outbreaks. PLoS Biol. 2007;5:e124. doi: 10.1371/journal.pbio.0050124. doi: 10.1371/journal.pbio.0050124. [DOI] [PMC free article] [PubMed] [Google Scholar]
- Caballero A, Hill WG. Effective size of nonrandom mating populations. Genetics. 1992;130:909–916. doi: 10.1093/genetics/130.4.909. [DOI] [PMC free article] [PubMed] [Google Scholar]
- Carpenter K, Abrar M, Aeby G, Aronson RB, Banks S, Bruckner A, et al. One-third of reef-building corals face elevated extinction risk from climate change and local impacts. Science. 2008;321:560–563. doi: 10.1126/science.1159196. [DOI] [PubMed] [Google Scholar]
- Coltman DW, Smith JA, Bancroft DR, Pilkington J, MacColl ADC, Clutton-Brock TH, et al. Density-dependant variation in lifetime breeding success and natural and sexual selection in Soay rams. Am. Nat. 1999;154:730–746. doi: 10.1086/303274. [DOI] [PubMed] [Google Scholar]
- Combosch DJ, Vollmer SV. Population genetics of an ecosystem-defining reef coral Pocillopora damicornis in the tropical Eastern Pacific. PLoS One. 2011;6:e21200. doi: 10.1371/journal.pone.0021200. [DOI] [PMC free article] [PubMed] [Google Scholar]
- Dai CF, Fan TY, Yu JK. Reproductive isolation and genetic differentiation of a scleractinian coral Mycedium elephantotus. Mar. Ecol. Prog. Ser. 2000;201:179–187. [Google Scholar]
- Ellis JR, Pashley CH, Burke JM, McCauley DE. High genetic diversity in a rare and endangered sunflower as compared to a common congener. Mol. Ecol. 2006;15:2345–2355. doi: 10.1111/j.1365-294X.2006.02937.x. [DOI] [PubMed] [Google Scholar]
- Elstrand EC, Elam DR. Population genetic consequences of small population size: implications for plant conservation. Annu. Rev. Ecol. Syst. 1993;24:217–242. [Google Scholar]
- Estoup A, Angers B. Microsatellites and minisatellites for molecular ecology: theoretical and empirical considerations. In: Carvalho G, editor. Advances in molecular ecology. Amsterdam: IOS Press; 1998. pp. 55–86. [Google Scholar]
- Fagen WF, Unmack PJ, Burgess C, Minckley ML. Rarity, fragmentation and extiction risk in desert fishes. Ecology. 2002;83:3250–3256. [Google Scholar]
- Foster NL, Baums IB, Mumby PJ. Sexual vs. asexual reproduction in an ecosystem engineer: the massive coral Montastraea annularis. J. Anim. Ecol. 2007;76:382–391. doi: 10.1111/j.1365-2656.2006.01207.x. [DOI] [PubMed] [Google Scholar]
- Foster NL, Paris CB, Kool JT, Baums IB, Stevens JR, Sanchez JA, et al. Connectivity of Caribbean coral populations: complementary insights from empirical and modelled gene flow. Mol. Ecol. 2012;21:1143–1157. doi: 10.1111/j.1365-294X.2012.05455.x. [DOI] [PubMed] [Google Scholar]
- Frankham R. Relationship of genetic variation to population size in wildlife. Conserv. Biol. 1996;10:1500–1508. [Google Scholar]
- Frankham R. How closely does genetic diversity in finite populations conform to predictions of neutral theory? Large deficits in regions of low recombination. Heredity. 2012;108:167–178. doi: 10.1038/hdy.2011.66. [DOI] [PMC free article] [PubMed] [Google Scholar]
- Frankham R, Ballow JD, Briscoe DA. Introduction to conservation genetics. 2nd ed. Cambridge, U. K: Cambridge University Press; 2010. [Google Scholar]
- Gamfeldt L, Wallén J, Jonsson PR, Berntsson KM, Havenhand JN. Increasing intraspecific diversity enhances settling success in a marine invertebrate. Ecology. 2005;86:3219–3224. [Google Scholar]
- Gaston KJ. Rarity. London: Chapman and Hall; 1994. [Google Scholar]
- Gillespie JH. Is the population size of a species relevant to its evolution? Int. J. Org. Evol. 2001;55:2161. doi: 10.1111/j.0014-3820.2001.tb00732.x. [DOI] [PubMed] [Google Scholar]
- Gilmour JP. Substantial asexual recruitment of mushroom corals contributes little to population genetics of adults in conditions of chronic sedimentation. Mar. Ecol. Prog. Ser. 2002;235:81–91. [Google Scholar]
- Gitzendanner MA, Soltis PS. Patterns of genetic variation in rare and widespread plant congeners. Am. J. Bot. 2000;87:783–792. [PubMed] [Google Scholar]
- Goffredo S, Mezzomonaco L, Zaccanti F. Genetic differentiation among populations of the Mediterranean hermaphroditic brooding coral Balanophyllia europaeaScleractinia: Dendrophylliidae. Mar. Biol. 2004;145:1075–1083. [Google Scholar]
- Goodbody-Gringley G, Vollmer SV, Woollacott RM, Giribet G. Limited gene flow in the brooding coral Favia fragum (Esper, 1797) Mar. Biol. 2010;157:2591–2602. [Google Scholar]
- Goodbody-Gringley G, Woollacott RM, Giribet G. Population structure and connectivity in the Atlantic scleractinian coral Montastrea cavernosa (Linnaeus, 1767) Mar. Ecol. 2012;33:32–48. [Google Scholar]
- Goodman D. The demography of chance extinction. In: Soule ME, editor. Viable populations for conservation. Cambridge, U.K: Cambridge University Press; 1987. pp. 11–43. [Google Scholar]
- Goudet J. Fstat version 1.2: a computer program to calculate Fstastics. J. Hered. 2001;86:485–486. [Google Scholar]
- Hamrick JL, Godt MJW. Allozyme diversity in plant species. In: Brown ADH, Clegg MT, Kahler AL, Weir BS, editors. Plant population genetics, breeding and germplasm resources. Sunderland: Sinauer; 1990. pp. 43–63. [Google Scholar]
- Hedgecock D. Does variance in reproductive success limit effective population size of marine organisms? In: Beaumont A, editor. Genetics and evolution of aquatic organisms. London: Chapman and Hall; 1994. pp. 122–134. [Google Scholar]
- van Herwerden L, Choat JH, Newman SJ, Leray M, Hillersoy G. Complex patterns of population structure and recruitment of Plectopomus leopardus (Pisces: Epinephelidae) in the Indo-West Pacific: implications for fisheries management. Mar. Biol. 2009;156:1595–1607. [Google Scholar]
- Hughes AR, Stachowicz JJ. Ecological impacts of genotypic diversity in the clonal seagrass Zostera marina. Ecology. 2009;90:1412–1419. doi: 10.1890/07-2030.1. [DOI] [PubMed] [Google Scholar]
- Hughes TP, Ayre DJ, Connell JH. The evolutionary ecology of corals. Trends Ecol. Evol. 1992;7:285–295. doi: 10.1016/0169-5347(92)90225-Z. [DOI] [PubMed] [Google Scholar]
- Hughes AR, Inouye BD, Johnson MTC, Underwood N, Vellend M. Ecological consequences of genetic diversity. Ecol. Lett. 2008;11:609–623. doi: 10.1111/j.1461-0248.2008.01179.x. [DOI] [PubMed] [Google Scholar]
- Karron JD. The pollination ecology of co-occurring geographically restricted and widespread species of AstragalusFabaceae. Biol. Conserv. 1987;39:179–193. [Google Scholar]
- Karron JD. Patterns of genetic variation and breeding systems in rare plants species. In: Falk DA, Holsinger KE, editors. Genetics and conservation of rare plants. New York: Oxford University Press; 1991. pp. 87–98. [Google Scholar]
- Kimura M. The neutral theory of molecular evolution. Cambridge: Cambridge University Press; 1983. [Google Scholar]
- Kimura M, Ohta T. Theoretical aspects of population genetics. Princeton, NJ: Princeton University Press; 1971. [PubMed] [Google Scholar]
- Knittweis L, Kramer WE, Timm J, Kochizius M. Genetic structure of Heliofungia actiniformis (Scleractinia: Fungiidae) populations in the Indo-Malay Archipelago: implications for live coral trade management efforts. Conserv. Genet. 2008;10:241–249. doi: 10.1007/s10592-008-9566-5. [Google Scholar]
- Ladner JT, Palumbi SR. Extensive sympatry, cryptic diversity and introgression throughout the geographic distribution of two coral species complexes. Mol. Ecol. 2012;21:2224–2238. doi: 10.1111/j.1365-294X.2012.05528.x. [DOI] [PubMed] [Google Scholar]
- Lande R, Barrowclough GF. Effective population size, genetic variation and their use in population mangement. In: Soule ME, editor. Viable populations for conservation. Cambridge, U.K: Cambridge University Press; 1987. pp. 87–123. [Google Scholar]
- Lavergne S, Mouquet N, Thuiller W, Ronce O. Biodiversity and climate change: integrating evolutionary and ecological responses of species and communities. Annu. Rev. Ecol. Evol. Syst. 2010;41:321–350. [Google Scholar]
- Lewis PO, Zaykin D. Genetic data analysis. 2001. Computer program for the analysis of allelic data. Version 1(d16c) Available at http://Lewis.eeb.uconn.edu/lewishome/software.html. [Google Scholar]
- Lynch M, Conery JS. The evolutionary fate and consequences of duplicated genes. Science. 2000;290:1151–1155. doi: 10.1126/science.290.5494.1151. [DOI] [PubMed] [Google Scholar]
- Macdonald AHH, Schleyer M, Lamb JM. Acropora austera connectivity in the south-western Indian Ocean assessed using nuclear intron sequence data. Mar. Biol. 2011;158:613–621. [Google Scholar]
- Mackenzie JB, Munday PL, Willis BL, Miller DJ, Van Oppen MJH. Unexpected patterns of genetic structuring among locations but not colour morphs in Acropora nasuta (Cnidaria; Scleractinia) Mol. Ecol. 2004;13:3–90. doi: 10.1046/j.1365-294x.2003.02019.x. [DOI] [PubMed] [Google Scholar]
- Magalon H, Adjeroud M, Veuille M. Patterns of genetic variation do not correlate with geographical distance in the reef-building coral Pocillopora meandrina in the South Pacific. Mol. Ecol. 2005;14:1861–1868. doi: 10.1111/j.1365-294X.2005.02430.x. [DOI] [PubMed] [Google Scholar]
- Maier E, Tollrian R, Rinkevich B, Nürnberger B. Isolation by distance in the scleractinian coral Seriatopora hystrix from the Red Sea. Mar. Biol. 2005;147:1109–1120. [Google Scholar]
- Márquez LM, Willis MJH, van Oppen BL, Reyes A, Miller DJ. The highly cross-fertile coral species, Acropora hyacinthus and A. cytherea, constitute statistically distinguishable lineages. Mol. Ecol. 2002;11:1339–1349. doi: 10.1046/j.1365-294x.2002.01526.x. [DOI] [PubMed] [Google Scholar]
- Marshall PA, Baird AH. Bleaching of corals on the Great Barrier Reef: differential susceptibilities among taxa. Coral Reefs. 2000;19:155–163. [Google Scholar]
- Miller KJ, Ayre DJ. The role of sexual and asexual reproduction in structuring high latitude populations of the reef coral Pocillopora damicornis. Heredity. 2004;92:557–568. doi: 10.1038/sj.hdy.6800459. [DOI] [PubMed] [Google Scholar]
- Miller KJ, Ayre DJ. Population structure is not a simple function of reproductive mode and larval type: insights from tropical corals. J. Anim. Ecol. 2008a;77:713–724. doi: 10.1111/j.1365-2656.2008.01387.x. [DOI] [PubMed] [Google Scholar]
- Miller KJ, Ayre DJ. Protection of genetic diversity and maintenance of connectivity among reef corals within marine protected areas. Conserv. Biol. 2008b;22:1245–1254. doi: 10.1111/j.1523-1739.2008.00985.x. [DOI] [PubMed] [Google Scholar]
- Miller KJ, Benzie JAH. No clear genetic distinction between morphological species within the coral genus Platygyra. Bull. Mar. Sci. 1997;61:907–917. [Google Scholar]
- Nakajima Y, Nishikawa A, Iguichi A, Sakai K. Gene flow and genetic diversity of a broadcast-spawning coral in Northern Peripheral Populations. PLoS One. 2010;5:e11149. doi: 10.1371/journal.pone.0011149. [DOI] [PMC free article] [PubMed] [Google Scholar]
- Narum SR. Beyond Bonferroni: less conservative analyses for conservation genetics. Conserv. Genet. 2006;7:783–787. [Google Scholar]
- Nei M. Molecular evolutionary genetics. New York: Columbia University Press; 1987. [Google Scholar]
- Neves EG, Andrade SCS, Solferini FL, da Silveira VN. Genetic variation and population structuring in two brooding coral species (Siderastrea stellata and Siderastrea radians) from Brazil. Genetica. 2008;132:243–254. doi: 10.1007/s10709-007-9168-z. [DOI] [PubMed] [Google Scholar]
- Nevo E, Bieles A, Ben-Shlomo R. The evolutionary significance of genetic diversity: ecological, demographic and life history correlates. In: Mani GS, editor. Evolutionary dynamics of genetic diversity. Berlin: Springer-Verlag; 1984. pp. 13–213. [Google Scholar]
- Ng WC, Morton B. Genetic structure of the scleractinian coral Platygyra sinensis in Hong Kong. Mar. Biol. 2003;143:963–968. [Google Scholar]
- Nishikawa A. Degree and pattern of gene flow in several scleractinian coral in the Ryukyu Archipelago, Southern Japan. Pac. Sci. 2008;62:413–421. [Google Scholar]
- Nishikawa A, Sakai K. Genetic variation and gene flow of broadcast spawning and planula brooding coral, Goniastrea aspera (Scleractinia), in the Ryukyu Archipelato, southern Japan. Zoolog. Sci. 2003;20:1031–1038. doi: 10.2108/zsj.20.1031. [DOI] [PubMed] [Google Scholar]
- Noreen AM, Harrison PL, van Oppen MJH. Genetic diversity and connectivity in a brooding reef coral at the limit of its distribution. Proc. Roy. Soc. B. 2009;276:3927–3935. doi: 10.1098/rspb.2009.1050. [DOI] [PMC free article] [PubMed] [Google Scholar]
- Ohno S. Evolution by gene duplication. New York: Springer-Verlag; 1970. [Google Scholar]
- van Oosterhout C, Hutchinson WF, Wills DPM, Shipley P. Microchecker: software for identifying and correcting genotyping errors in microsatellite data. Mol. Ecol. Notes. 2004;4:535–538. [Google Scholar]
- van Oppen MJH, Gates RD. Conservation genetics and the resilience of reef-building corals. Mol. Ecol. 2006;15:3863–3883. doi: 10.1111/j.1365-294X.2006.03026.x. [DOI] [PubMed] [Google Scholar]
- van Oppen MJH, Willis BL, Miller HWA, Van Vgut DJ. Examination of species boundaries in the Acropora cervicornis group (Scleractinia, Cnidaria) using nuclear DNA sequence analysis. Mol. Ecol. 2000;9:1363–1373. doi: 10.1046/j.1365-294x.2000.01010.x. [DOI] [PubMed] [Google Scholar]
- van Oppen MJH, Underwood JN, Muirhead A, Peplow L. Ten microsatellite loci for the reef-building coral Acropora millepora (Cnidarea, Scleractinia) from the Great Barrier Reef, Australia. Mol. Ecol. Notes. 2007;7:436–438. [Google Scholar]
- van Oppen MJH, Lutz A, De'ath G, Peplow L, Kininmonth S. Genetic traces of recent long-distant dispersal in a predominantly self-recruiting coral. PLoS One. 2008;3:e3401. doi: 10.1371/journal.pone.0003401. [DOI] [PMC free article] [PubMed] [Google Scholar]
- van Oppen MJH, Souter P, Howells E, Heyward A, Berkelmans R. Novel genetic diversity through somatic mutations:fuel for adaptation of reef corals? Diversity. 2011a;3:405–423. [Google Scholar]
- van Oppen MJH, Bongaerts P, Underwood JN. The role of deep reefs in shallow reef recovery: an assessment of vertical connectivity in a brooding coral from west and east Australia. Mol. Ecol. 2011b;20:1647–1660. doi: 10.1111/j.1365-294X.2011.05050.x. [DOI] [PubMed] [Google Scholar]
- van Oppen MJH, Peplow LM, Kininmonth S, Berkelmans R. Historical and contemporary factors shape the population genetic structure of the broadcast spawning coral, Acropora millepora, on the Great Barrier Reef. Mol. Ecol. 2011c;20:4899–4914. doi: 10.1111/j.1365-294X.2011.05328.x. [DOI] [PubMed] [Google Scholar]
- Palumbi SR. Population genetics, demographic connectivity, and the design of marine reserves. Ecol. Appl. 2003;13:S146–S158. [Google Scholar]
- Palumbi SR, McLeod KL, Grünbaum D. Ecosystems in action: lessons from marine ecology about recovery, resistance, and reversibility. Bioscience. 2008;58:33–42. [Google Scholar]
- Palumbi SR, Vollmer S, Romano S, Oliver T, Ladner J. The role of genes in understanding the evolutionary ecology of reef building corals. Evol. Ecol. 2012;26:317–335. [Google Scholar]
- Paz-Garcia DA, Chavez-Romo HE, Correa-Sandoval F, Reyes-Bonilla H, Lopez-Perez A, Medina-Rosas P, et al. Genetic connectivity patterns of corals Pocillopora damicornis and Porites panamensis (Anthozoa: Scleractinia) along the West Coast of Mexico. Pac. Sci. 2012;66:43–61. [Google Scholar]
- Peakall R, Smouse PE. GenAlex 6: genetic analysis in Excel. Canberra, Australia: Australian National University; 2005. Population genetic software for teaching and research. [DOI] [PMC free article] [PubMed] [Google Scholar]
- Pearson RG. Recovery and recolonization of coral reefs. Mar. Ecol. Prog. Ser. 1981;4:105–122. [Google Scholar]
- Polato NR, Concepcion CT, Toonen RJ, Baums IB. Isolation by distance across the Hawaiian Archipelago in the reef-building coral Porites lobata. Mol. Ecol. 2010;19:4661–4677. doi: 10.1111/j.1365-294X.2010.04836.x. [DOI] [PubMed] [Google Scholar]
- Puill-Stephan E, Willis BL, van Hetwerden L, van Oppen MJH. Chimerism in wild adult populations of the broadcast spawning coral Acropora millepora on the Great Barrier Reef. PLoS One. 2009;4:e7751. doi: 10.1371/journal.pone.0007751. [DOI] [PMC free article] [PubMed] [Google Scholar]
- Raymond M, Rousset F. Genepop (Version 1.2). Population genetics software for exact tests and eumenicism. J. Hered. 1995;86:248–249. [Google Scholar]
- Reyes JG, Schizas NV. No two reefs are created equal: fine-scale population structure in the threatened coral species Acropora palmata and A. cervicornis. Aquat. Biol. 2010;10:69–83. [Google Scholar]
- Richards ZT, Wallace MJH, van Oppen C, Willis BL, Miller DJ. Some rare Indo-Pacific coral species are probable hybrids. PLoS One. 2008;3:e3240. doi: 10.1371/journal.pone.0003240. [DOI] [PMC free article] [PubMed] [Google Scholar]
- Ridgway T, Hoegh-Gudberg O, Ayre DJ. Panmixia in Pocillopora verrucosa from South Africa. Mar. Biol. 2001;139:175–182. [Google Scholar]
- Rodriguez-Lanetty M, Hoegh-Guldberg O. The phylogeography and connectivity of the latitudinally widespread scleractinian coral Plesiastrea versipora in the Western Pacific. Mol. Ecol. 2002;11:1177–1189. doi: 10.1046/j.1365-294x.2002.01511.x. [DOI] [PubMed] [Google Scholar]
- Saavedra-Sotelo NC, Calderon-Aguilera LE, Reyes-Bonilla H, Lopez-Perez RA, Medina-Rosas P, Rocha-Olivares A. Limited genetic connectivity of Pavona gigantea in the Mexican Pacific. Coral Reefs. 2011;30:677–686. [Google Scholar]
- Shearer TL, Porto I, Zubillaga AL. Restoration of coral populations in light of genetic diversity estimates. Coral Reefs. 2009;28:727–733. doi: 10.1007/s00338-009-0520-x. [DOI] [PMC free article] [PubMed] [Google Scholar]
- Smith-Keune C, van Oppen MJH. Genetic structure of a reef-building coral from thermally distinct environments on the Great Barrier Reef. Coral Reefs. 2006;25:493–502. [Google Scholar]
- Souter P, Henriksson O, Olsson N, Grahn M. Patterns of genetic structuring in the coral Pocillopora damicornis on reefs in East Africa. BMC Ecol. 2009;9:19. doi: 10.1186/1472-6785-9-19. doi: 10.1186/1472-6785-9-19. [DOI] [PMC free article] [PubMed] [Google Scholar]
- Spielman D, Brook BW, Frankham R. Most species are not driven to extinction before genetic factors impact them. Proc. Natl Acad. Sci. USA. 2004;101:15261–15264. doi: 10.1073/pnas.0403809101. [DOI] [PMC free article] [PubMed] [Google Scholar]
- Starger CJ, Barber PH, Ambarivanto, Baker AC. The recovery of coral genetic diversity in the Sunda Strait following the 1883 eruption of Krakatau. Coral Reefs. 2010;29:547–565. [Google Scholar]
- Stebbins GL. The significance of polyploidy in plant evolution. Am. Nat. 1940;74:54–66. [Google Scholar]
- Stoddart JA. Genetic differentiation amongst populations of the coral Pocillopora damicornis off southwestern Australia. Coral Reefs. 1984;3:149–156. [Google Scholar]
- Takabayashi M, Carter DA, Lopez JV, Hoegh-Guldberg O. Genetic variation of the scleractinian coral Stylophora pistillata from western Pacific reefs. Coral Reefs. 2003;22:17–22. [Google Scholar]
- Underwood JN. Genetic diversity and divergence among coastal and offshore reefs in a hard coral depend on geographic discontinuity and oceanic currents. Evol. Appl. 2009;2:222–233. doi: 10.1111/j.1752-4571.2008.00065.x. [DOI] [PMC free article] [PubMed] [Google Scholar]
- Underwood JN, Smith LD, Gilmour MJH, van Oppen JP. Multiple scales of genetic connectivity in a brooding coral on isolated reefs following catastrophic bleaching. Mol. Ecol. 2007;16:771–784. doi: 10.1111/j.1365-294X.2006.03187.x. [DOI] [PubMed] [Google Scholar]
- Underwood JN, Smith LD, Gilmour MJH, van Oppen JP. Ecologically relevant dispersal of corals on isolated reefs: implications for managing resilience. Ecol. Appl. 2009;19:18–29. doi: 10.1890/07-1461.1. [DOI] [PubMed] [Google Scholar]
- Vollmer SV, Palumbi SR. Hybridization and the evolution of coral reef diversity. Science. 2002;296:2023–2025. doi: 10.1126/science.1069524. [DOI] [PubMed] [Google Scholar]
- Vollmer SV, Palumbi SR. Staghorn coral Acropora cervicornis: implications for the recovery of endangered reefs. J. Hered. 2006;98:40–50. doi: 10.1093/jhered/esl057. [DOI] [PubMed] [Google Scholar]
- Vrijenhoek RC. Animal population genetics and disturbance: the effects of local extinctions and recolonizations on heterozygosity and fitness. In: Pickett STA, White PS, editors. The ecology of natural disturbance and patch dynamics. London: Academic Press; 1985. pp. 265–285. [Google Scholar]
- Wahlund S. Zusammensetzung von population und korrelationserscheinung vom standpunkt der vererbung-slehre aus betrachtet. Hereditas. 1928;11:65–106. [Google Scholar]
- Wallace CC. Staghorn corals of the world: a revision of the genus Acropora. Australia: CSIRO Publishing; 1999. [Google Scholar]
- Wang S, Zhang L, Matz M. Microsatellite characterization and marker development from public EST and WGS databases in the reef-building coral Acropora millepora (Cnidaria, Anthozoa, Scleractinia) J. Hered. 2008;100:329–337. doi: 10.1093/jhered/esn100. [DOI] [PubMed] [Google Scholar]
- Wang XY, Shen DW, Jiao J, Xu NN, Zhou XF, Shi MM, et al. Genotypic diversity enhances invasive ability of Spartina alterniflora. Mol. Ecol. 2012;21:2542–2551. doi: 10.1111/j.1365-294X.2012.05531.x. [DOI] [PubMed] [Google Scholar]
- Whitaker K. Non-random mating and population genetic subdivision of two broadcasting corals at Ningaloo Reef, Western Australia. Mar. Biol. 2004;144:593–603. [Google Scholar]
- Schweitzer JA, Shuster SM.
- Whitaker K. Genetic evidence for mixed modes of reproduction in the coral Pocillipora damicornis and its effect on population structure. Mar. Ecol. Prog. Ser. 2006;306:115–124. [Google Scholar]
- Whitham TG, Young WP, Martinsen GD, Gehring CA, Schweitzer JA, Shuster SM, et al. Community and ecosystem genetics: a consequence of the extended phenotype. Ecology. 2003;84:559–573. [Google Scholar]
- Willi Y, Buskirk JV, Hoffmann AA. Limits to the adaptive potential of small populations. Annu. Rev. Ecol. Evol. Syst. 2006;37:433–458. [Google Scholar]
- Wright S. Coefficients of inbreeding and relationship. Am. Nat. 1922;56:330–338. [Google Scholar]
- Wright S. Evolution in Mendelian populations. Genetics. 1931;16:97–159. doi: 10.1093/genetics/16.2.97. [DOI] [PMC free article] [PubMed] [Google Scholar]
- Young AG, Brown AHD. Comparative population genetic structure of the rare woodland shrub Daviesia suaveolens and its common congener D. mimosoides. Conserv. Biol. 1996;10:1220–1228. [Google Scholar]
- Yu JK, Wang HY, Lee SC, Dai CF. Genetic structure of a scleractinian coral, Mycedium elephantotus in Taiwan. Mar. Biol. 1999;133:21–28. [Google Scholar]
- Zhang J. Evolution by gene duplication: an update. Trends Ecol. Evol. 2003;18:292–298. [Google Scholar]