

Abstract
Objective
Elevated body mass index (BMI) at midlife is associated with increased risk of cognitive decline in later life. The goal of the current study was to assess mechanisms of early brain vulnerability by examining if higher BMI at midlife has an effect on current cognitive performance through alterations in cerebral neurochemistry.
Methods
Fifty-five participants, aged 40–60 years, underwent neuropsychological testing, health screen, and proton magnetic resonance spectroscopy (1H MRS) examining N-acetyl-aspartate (NAA), creatine (Cr), myo-inositol (mI), choline (Cho), and glutamate (Glu) concentrations in occipitoparietal grey matter. Concentrations of NAA, Cho, mI, and Glu were calculated as a ratio over Cr and examined in relation to BMI using multivariate regression analyses. Structural equation modeling was used to determine if BMI had an indirect effect on cognition through cerebral metabolite levels.
Results
Higher BMI was associated with elevations in mI/Cr (F(5,45)= 3.843, p=0.006, β=0.444, p=0.002), independent of age, sex, fasting glucose levels, and systolic blood pressure. Moreover, a chi-square difference test of the direct and indirect structural equation models revealed that BMI had an indirect effect on global cognitive performance (ΔX2(df=2) =19.939, p<0.001). Subsequent follow-up analyses revealed that this effect was specific to memory (ΔX2(df=2) = 22.027, p<0.001).
Conclusions
Higher BMI was associated with elevations in mI/Cr concentrations in the occipitoparietal grey matter and indirectly related to poorer memory performance through mI/Cr, potentially implicating plasma hypertonicity and neuroinflammation as mechanisms underlying obesity-related brain vulnerability.
Keywords: BMI, obesity, proton magnetic resonance spectroscopy, myo-inositol
Introduction
Rates of overweight and obese status have increased dramatically over the past few decades with current estimates classifying over 50% of Europeans and Americans as overweight or obese based upon body mass index (BMI), the most commonly used measure of obesity (1,2). Through both direct and indirect pathways, obesity damages the heart, liver, and pancreas, increasing susceptibility to a myriad of chronic diseases such as hypertension, diabetes, and cancer (3). Additionally, obese BMI has been identified as a risk factor for cognitive decline (4,5), suggesting that the health consequences of obesity extend outside the periphery.
Midlife obesity has been associated with reduced grey matter volume in older age (6) and significantly increased risk for dementia (4). At younger ages, the effect of obesity on cognitive performance tends to be subtle (r=−0.11 to r=−0.23) (7); yet, significant disturbances in resting cerebral glucose metabolism have been detected in otherwise healthy young adults with high BMI (8), providing evidence of early brain vulnerability. Given the widespread prevalence of obesity, there is a pressing need to further investigate the physiological mechanisms linking increased body mass to brain vulnerability so that preventive measures can be developed to protect against obesity-related cognitive impairment. The small direct effects of obesity on cognition at midlife, however, can hinder studies of mediating mechanisms if traditional models requiring a significant direct effect are applied. When that is suspected to be the case, researchers have argued that direct and indirect effects should be examined independently of each other in order to prevent investigators from missing potentially interesting, important, or useful mechanisms by which an independent variable may exert an effect on a dependent variable (9). Thus, following the recommendations of MacKinnon et al (10), Shrout & Bolger (11), and Hayes (9), we set out to independently examine the direct and indirect effects of increased midlife BMI on current neuropsychological test performance through a hypothesized alteration in cerebral neurochemistry. Cerebral neurochemistry was specifically targeted as early changes in neurometabolite concentrations have been shown to predict cognitive decline in a variety of disorders including multiple sclerosis (12), Alzheimer’s disease (13), and traumatic brain injury (14).
In this study, neurometabolite concentrations were examined through proton magnetic resonance spectroscopy (1H MRS). 1H MRS capitalizes on the unique precessional properties of atomic nuclei to measure concentrations of a variety of cerebral metabolites with neurobiological significance: N-aceytl-aspartate (NAA), a marker of neuronal viability; choline-containing compounds (free choline, phosphocholine and glycerophosphocholine, Cho), markers of membrane breakdown and turn over; creatine (Cr), a marker of energy metabolism; myo-inositol (mI), an organic osmolyte and glial marker; and glutamate (Glu), a marker of excitatory neurotransmission and synaptic integrity (15).
While we measured all spectroscopically visible metabolites, our hypotheses were centered on alterations in NAA and mI concentrations, both of which are accepted markers of prodromal cognitive impairment (16,17). We based our predictions on evidence that adipose tissue secretes proinflammatory adipocytokines capable of crossing the blood brain barrier (18). Within the central nervous system, adipocytokines can induce a local inflammatory response and activate microglia (19), which may result in oxidative damage. These processes may be reflected in higher levels of the organic osmolyte and glial marker, mI, and lower levels of the neuronal marker NAA (15). Additionally, insulin dysregulation, an established consequence of obesity (20), may affect neuronal survival through disruption of cerebral glucose metabolism (21), also lowering NAA. Finally, obesity has been linked to alterations in osmotic regulation in the peripheral (22) and central nervous systems (23), which might induce cellular damage through shrinkage and swelling causing further changes in cerebral mI and NAA levels. Thus, we hypothesized that lower NAA concentrations could provide evidence of decreased neuronal integrity (24) and would be commensurate with the observations of reduced grey matter volume in association with higher BMI (6). Higher mI, on the other hand, would suggest microglial activation and osmotic regulation disturbance (25) as the potential mechanism relating higher BMI to lower cognitive function.
Materials and Methods
Participants
Adults between the ages of 40 and 60 years were recruited through flyers and newspaper advertisements. Individuals with a history of coronary artery disease, angina pectoris, myocardial infarctions, heart failure, and cardiac surgery were excluded in order to assess the impact of higher BMI on neurochemistry in otherwise healthy adults. Additional exclusion criteria included history of neurological disease (e.g., stroke, Parkinson’s disease, clinically significant traumatic brain injury), major psychiatric illness (e.g. schizophrenia, bipolar disorder), substance abuse (i.e., diagnosed abuse and/or previous hospitalization for substance abuse), smoking (within the last two years), and MRI contraindications. Medical conditions, treatments, and other exclusion factors were assessed according to participants’ self-report during telephone screening. Fifty-five participants completed the initial screen and were enrolled in the study after providing written consent. One participant was excluded from analyses due to poor quality MRS data (Cramer-Rao Lower Bounds for NAA/Cr, mI/Cr, Cho/Cr or Glu/Cr >12).
Procedures
The study was conducted in accordance with the Helsinki Declaration of 1975 and with approval from the local Institutional Review Board. All volunteers provided written informed consent before enrollment. Participants completed a medical history interview in which medical conditions and treatments were coded as either present or absent based on participants’ self-report. Participants then underwent a full neuropsychological evaluation, brain imaging, and a general health assessment, including a fasting blood draw for lipid and glucose assay. Visits were conducted on separate days, and participants completed the study within one month. Data for the study was collected from January 2008 to July 2010.
Neuropsychological Assessment
Participants completed a two-hour assessment battery including standard clinical neuropsychological instruments with established reliability and validity (26). In effort to reduce multiple comparisons, a global cognitive domain score was created. Participants’ raw test scores were converted into z-scores using the study sample mean and standard deviation. Timed test scores were multiplied by −1 so that higher scores indicate better performance. A composite global cognitive domain z-score was calculated for each participant by averaging the z-scores of all tests. The following test scores were included in the global cognitive domain: MMSE (27); WASI Vocabulary Subtest (28); WASI Matrix Reasoning Subtest (28); Category Fluency for Animals (29); RCF copy, immediate recall, delayed recall, and recognition discrimination (30); CVLT-II immediate recall, delayed recall, and recognition discrimination (31); Trail making A and B time to completion (32); COWAT (33); WAIS-III Digit Span Subtest (34); and Grooved Pegboard-Dominant Hand time to completion (35).
In exploratory follow-up analyses, the global cognitive functioning score was split into five separate cognitive domains in order to more fully characterize the impact of higher BMI and altered cerebral neurochemistry. Neuropsychological measures were grouped as follows: 1) general cognition: MMSE (27) and WASI FSIQ (28); 2) language: WASI Vocabulary Subtest (28) and Category Fluency for Animals (29); 3) visual-spatial: RCF copy (30) and WASI Matrix Reasoning Subtest (28); 4) memory: CVLT-II immediate recall, delayed recall, and recognition discrimination (31), RCF immediate recall, delayed recall, and recognition discrimination (30); 5) attention-executive-psychomotor functions: Trail making A and B time to completion (32), COWAT (33), WAIS-III Digit Span Subtest (34), and Grooved Pegboard-Dominant Hand time to completion (35). All tests were administered and scored by a trained research assistant using standard administration and scoring criteria.
Imaging Protocols and MRS Data Processing
MRS data for each participant were acquired in a single session on a 3T GE Signa Excite MRI scanner equipped with a standard head coil. Imaging included single voxel proton MRS performed using the GE pulse sequence PROBE-P, an automated point resolved spectroscopy (PRESS) sequence with chemical shift selected (CHESS) water suppression. Each spectroscopic voxel was prescribed from 3D high-resolution Spoiled Gradient Echo (SPGR) sagittal images (256 × 256 matrix, FOV = 24 × 24 cm2, 1 mm slice thickness, 0 gap) of the entire brain. 1H-MRS parameters were as follows: echo time/repetition time (TE/TR) = 35/3000 ms, 128 excitations, 5000 Hz spectral width, volume ~6 cm3 from the occipitoparietal gray matter including posterior cingulate gyrus (Fig. 1a). This region was selected because alterations in its neurochemical concentrations have well-documented associations with cognition (14,16,36). Commercially available software, LCModel, was used to quantify and separate the metabolite resonances from the macromolecule background (37) (Fig. 1b). The concentrations of NAA, Cho, mI, and Glu were reported as ratios relative to Cr in line with standard clinical protocols (38).
Figure 1.

Figure 1A. MRS voxel borders on high-resolution anatomy indicating volume of interest in the occipitoparietal junction
Figure 1B. Representative 1H MRS spectrum. The narrow line width and small residual indicate excellent model fit. NAA = N-acetyl-aspartate; Glu = glutamate; Cr = creatine + phosphocreatine; Cho = choline + phosphocholine; mI = myo-inoitol
General Health Assessment
Participants abstained from caffeine and fasted for at least four hours prior to the assessment. Body mass in kilograms and height in centimeters were measured on a physician’s balance scale for the subsequent calculations of BMI. BMI was calculated by dividing weight in kilograms by height in meters squared. Following 15 minutes of rest, participants sat upright while brachial blood pressure was measured using a semi-automated device. Approximately 3 milliliters of fasting blood was collected from the antecubital vein by venipucture. The plasma concentrations of glucose, triglycerides, total cholesterol, LDL-cholesterol, and HDL-cholesterol were measured using standard enzymatic technique (Cholestech LDX system, Cholestech Corporation, Hayward, CA).
Statistical Analyses
Descriptive statistics were calculated for demographics, medical variables, and raw cognitive test scores. The global cognitive domain score was assessed in relation to BMI and 1H MRS markers (NAA/Cr, Glu/Cr, mI/Cr and Cho/Cr) using linear regression statistically adjusting for age and years of education.
Then two sets of analyses were conducted. First, the association between BMI and the 1H MRS markers was analyzed using a single multivariate multiple linear regression model with all MRS parameters entered in at once, statistically adjusting for age, sex, fasting glucose levels, and systolic blood pressure. The above analysis was repeated using anti-hypertensive medications, and hypoglycemic medications as additional covariates (0 = no, 1 = yes). A two-tailed alpha level of 0.05 was used as the criterion for statistical significance.
In the second set of analyses, the indirect effect of BMI on the global cognitive domain score through mI/Cr levels was assessed using structural equation modeling. In contrast to mediation, indirect effects do not require a significant direct association between the independent and dependent variables (39). The advantage of SEM over multiple regression is that the former can be used to estimate simultaneous multivariate associations (e.g., the effects of X on Y, X on Z, and Y on Z), which would have to be estimated independently using regression techniques. The indirect effect of BMI on the global cognitive domain score through mI/Cr was assessed by comparing the direct and indirect models. The indirect model included estimates of the direct effects of BMI on cognition and two additional paths, one from BMI to mI/Cr and another from mI/Cr to cognition. A successful indirect model requires that both the path from BMI to mI/Cr and the path from mI/Cr to cognition be significant. The direct effect of BMI to the global cognitive domain score was also assessed. Finally, the difference between direct and indirect models were compared using a chi-square test with a significance level of p<0.05. An additional assessment on the significance of the indirect model was conducted by calculating confidence intervals. Confidence intervals were obtained using Preacher and Hayes’ SPSS macro (39), which utilizes as bootstrapping method for assessing indirect effects. In brief, this procedure involves taking one thousand random samples from the obtained data, sampling with replacement, and calculating the indirect effect for each sample. 95% confidence intervals are than calculated from the distributions of obtained scores over the samples correcting for bias due to the underlying distribution. In the current analysis, the global cognitive domain score was entered as the dependent variable, BMI was entered as the independent variable, and mI/Cr as the mediator. A 95% bias-corrected confidence interval that does not include 0 was considered as the criterion for significance. In subsequent exploratory analyses, the above procedures for detecting indirect effects were repeated for the five individual cognitive domain scores. Additionally, the indirect effect of BMI on global cognition through mI/Cr was re-assessed statistically adjusting for the memory domain in order to examine if the global cognitive domain score held predictive value over and above the contribution of the memory domain.
Structural equation modeling was accomplished using Mx 1.54a (40). All other statistical analyses were performed using SPSS 16.0 (SPSS Inc., Chicago, IL).
Results
Descriptive statistics
Selected demographic and medical characteristics of the subjects are reported in Table 1. Mean BMI was 29.4 kg/m2 with a range from 19.0 to 42.8 kg/m2. Fourteen participants (25.9%) had a normal BMI (18.5–24.9 kg/m2), 15 participants (27.8%) had an overweight BMI (25.0–29.9 kg/m2), and 25 participants (46.3%) had an obese BMI (≥30 kg/m2). Eleven participants (20.4%) were currently being treated with anti-hypertensive medications, three participants (5.6%) with lipid lowering agents, four participants (7.1%) with hypoglycemics, three participants (5.6%) with biphosphonates, one participant (1.8%) with thyroid replacement therapy, and one participant (1.8%) with antidepressant medications. Based on their self-report, twenty-two participants (40.7%) were classified as Caucasian, twenty-five participants (46.3%) as Hispanic, four participants (7.4%) as African-American, and three (5.6%) as other. Table 2 displays the mean raw cognitive test scores. Descriptive statistical analyses revealed a cognitively normal, ethnically diverse, middle-aged sample, well representative of the population of the state of Texas based on year 2000 US census data.
Table 1.
Selected participant characteristics (n=54)
| Characteristic | Mean±SD |
|---|---|
| Age, y | 50.7±6.3 |
| Sex (male/female) | 24:30 |
| Education, y | 15.2±2.7 |
| Body mass index, kg/m2 | 29.6±5.8 |
| Systolic blood pressure, mmHg | 126.3±16.7 |
| Diastolic blood pressure, mmHg | 75.9±9.4 |
| LDL-Cholesterol, mg/dl | 124.0±34.0 |
| HDL-Cholesterol, mg/dl | 49.0±16.7 |
| Triglyceride, mg/dl | 166.7±97.9 |
| Glucose, mg/dl | 105.5±31.1 |
| mI/Cr | 0.72±0.09 |
| Glu/Cr | 1.47±0.16 |
| Cho/Cr | 0.18±0.02 |
| NAA/Cr | 1.40±0.09 |
Table 2.
Neuropsychological Test Results
| Cognitive Domain | Mean±SD |
|---|---|
|
| |
| General cognition | |
| Mini Mental Status Exam (MMSE) | 28.4±1.3 |
| Weschler Abbreviated Test of Intelligence (WASI) | |
| Full Scale IQ | 113.5±11.9 |
|
| |
| Language | |
| WASI - Vocabulary Subtest | 63.9±10.0 |
| Category Fluency for Animals | 23.4±5.7 |
|
| |
| Visual-Spatial | |
| WASI Matrix Reasoning Subtest | 25.9±4.3 |
| Rey Complex Figure Test (RCF) – Copy | 30.3±3.9 |
|
| |
| Memory | |
| California Verbal Learning Test (CVLT) | |
| Immediate Recall | 10.7±3.1 |
| Delayed Recall | 11.2±3.2 |
| Recognition (Yes/No) | 3.1±0.8 |
| Rey Complex Figure Test (RCF) | |
| Immediate Recall | 16.0±5.4 |
| Delayed Recall | 15.5±5.5 |
| Recognition Discrimination | 19.2±3.8 |
|
| |
| Attention-executive-psychomotor function | |
| Controlled Oral Word Association Test (COWAT) | 37.3±10.8 |
| Trail Making Test A, sec | 32.0±10.7 |
| Trail Making Test B, sec | 80.0±31.0 |
| Weschler Adult Intelligence Scale III (WAIS-III) | |
| Digit Span Subtest, total | 16.1±4.1 |
| Grooved Pegboard, Dominant Hand, sec | 77.2±14.0 |
BMI and cerebral metabolism in relation to global cognitive test performance
BMI was not significantly associated with the global cognitive domain score (β=−0.078, p=0.57) independent of age and years of education (F(3,49)=1.473, p=0.23). Consistent with the literature on mild cognitive impairment (38), higher levels of mI/Cr were associated with lower performance in the global cognitive domain (β=−0.290, p=0.03) independent of age and years of education (F(3,49)=3.108, p=0.04) (Fig. 2). No significant relation was found between NAA/Cr, Glu/Cr, and Cho/Cr and the global cognitive domain independent of age and years of education.
Figure 2.

Scatterplot displaying the relation between mI/Cr and the global cognitive domain score
Cerebral metabolism in relation to BMI
The fully adjusted multivariate regression model successfully predicted the level of mI/Cr in occipitoparietal grey matter (F(5,45)=3.843, p=0.006), but not NAA/Cr (F(5,45)=1.419, p=0.24), Cho/Cr (F(5,45)=1.314, p=0.28) or Glu/Cr (F(5,45)=1.166, p=0.34). Higher BMI was significantly associated with higher mI/Cr (β=0.444, p=0.002), independent of age, sex, fasting glucose levels, and systolic blood pressure (Fig. 3). This relation remained unchanged when global cognitive function was included in the model (F(6,44)=4.127, p=0.002, β=0.417, p=0.003). Additionally, statistically adjusting for the use of anti-hypertensive (F(6,44)=3.141, p=0.01, β=0.434, p=0.004) or hypoglycemic medications (F(6,44)=3.155 p=0.01, β=0.455, p=0.002) did not alter the significance of the findings.
Figure 3.

Scatterplot displaying the relation between BMI and mI/Cr
The indirect effect of BMI on global cognitive performance through mI/Cr levels
As expected, the direct effect of BMI on cognition in midlife was subtle and the path from BMI to global cognitive performance was non-significant (β=−0.11, 95% CI −0.38, 0.16) (Fig. 4a). For the indirect model (Fig. 4b), the paths from BMI to mI/Cr (β=0.50, 95% CI 0.26, 0.74) and from mI/Cr to global cognitive performance (β=−0.33, 95% CI −0.63, −0.03) were significant. The path from BMI directly to global cognitive performance was non-significant (β=0.06, 95% CI −0.24, 0.36). A chi-square difference test of the direct and indirect models revealed that the indirect model was a better fit for the data (ΔX2(df=2) = 19.939, p<0.001). The significance of the indirect effect was confirmed by the 95% confidence intervals (95% CI range −0.369 to −0.039) derived by Preacher and Hayes’ (39) bootstrapping method for detecting indirect effects.
Figure 4.
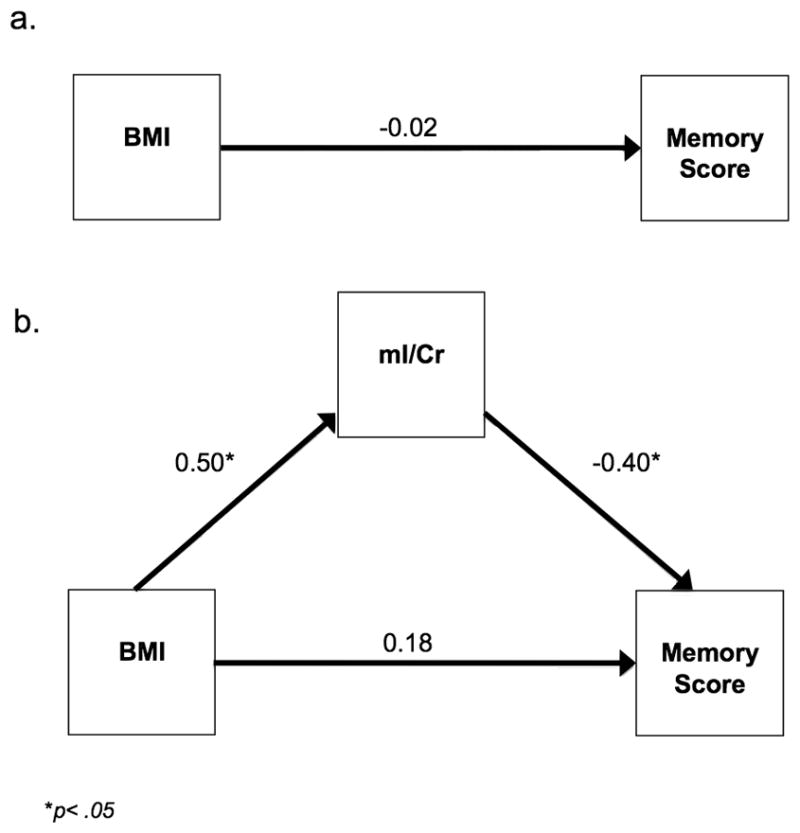
Figure 4A. Direct structural equation model for the global cognitive domain score
Figure 4B. Indirect structural equation model for the global cognitive domain score
The indirect effect of BMI on individual cognitive domain scores through mI/Cr levels
Memory performance was the only individual cognitive domain score that BMI had an indirect effect on through mI/Cr. Consistent with our results for global cognition, the direct effect from BMI to memory performance was subtle and did not reach statistical significance (β=−0.02, 95% CI −0.29, 0.05) (Fig. 5a). For the indirect model (Fig. 5b), the paths from BMI to mI/Cr (β=0.50, 95% CI 0.26, 0.74) and from mI/Cr to memory performance (β=−0.40, 95% CI −0.70, −0.10) were significant. The path from BMI directly to memory performance was non-significant (β=0.18, 95% CI −0.12, 0.48). A chi-square difference test of the direct and indirect models indicated that the indirect model provided a better fit for the data (ΔX2(df=2) = 22.027, p<0.001). The significance of the indirect effect was also confirmed by 95% confidence intervals (95% CI −0.048, −0.006).
Figure 5.
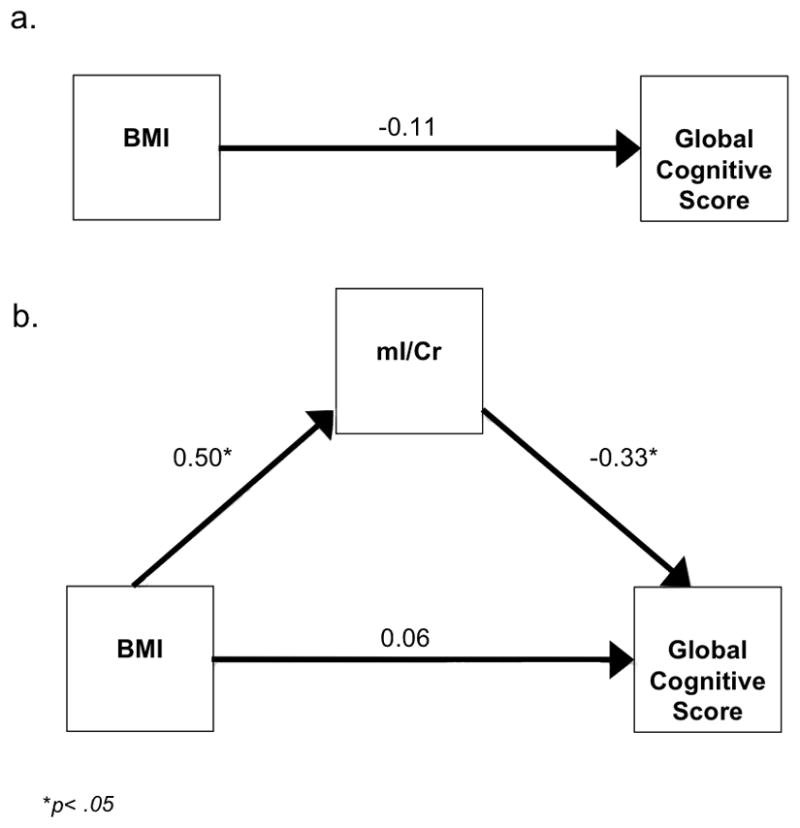
Figure 5A. Direct structural equation model for the memory cognitive domain score
Figure 5B. Indirect structural equation model for the memory cognitive domain score
No significant indirect effects were found for the general cognition, language, visual-spatial, and attention-executive-psychomotor cognitive domains. The criteria for indirect effects include the provision that the path from the independent variable to the mediating variable be significant as well as the path from mediating variable to the dependent variable. In our case, only the path from the independent variable (BMI) to the mediating variable (mI/Cr) was significant (β=0.50, 95% CI 0.26, 0.74). The path from the mediating variable (mI/Cr) to the dependent variable (cognitive domain score) was non-significant for the general cognition (β=−0.15, 95% CI −0.45, 0.15), language (β=−0.08, 95% CI −0.39, 0.20), visual-spatial (β=−0.29, 95% CI −0.60, 0.01), and attention-executive-psychomotor domain scores (β=−0.21, 95% CI −0.52, 0.10); thus preventing further exploration of any indirect effects of BMI on domain specific cognitive scores in those cases.
The indirect effect of BMI on global cognitive performance through mI/Cr levels controlling for the memory domain score
The indirect effect of BMI on global cognition was no longer detectable after statistically adjusting for memory performance. While the path from BMI to mI/Cr remained significant after adjustment for memory performance (β=0.50, 95% CI 0.26, 0.74), the path from mI/Cr to global cognition was no longer significant (β=0.01, 95% CI −0.15, 0.18); thus, violating criteria for further assessment of the indirect effect of BMI on global cognition in this case.
Discussion
Within our middle-aged sample, higher BMI was associated with elevations of mI/Cr in occipitoparietal grey matter. High levels of mI have been reported in patients with diabetes (41–43) and hypertension (44), conditions closely related to elevated BMI. In the current study, BMI was associated with elevations in mI/Cr even after statistically adjusting for systolic blood pressure, fasting glucose levels, and use of anti-hypertensive or hypoglycemic agents, suggesting that BMI independently accounts for variance in cerebral mI levels in otherwise healthy middle-aged adults. Consistent with the dementia literature (36,38), higher mI/Cr related to lower overall cognitive performance. More importantly, structural equation modeling determined that higher BMI had an indirect effect on poorer overall cognitive performance through the elevated cerebral mI levels. Exploratory follow-up analyses revealed that the memory score was only the individual cognitive domain score contributing to the effect. These results are similar to the findings by Kantarci et al. (2002) (38), which noted a significant correlation between elevated mI levels and verbal memory performance in individuals with MCI and Alzheimer’s disease. Thus, elevated mI levels in association with higher BMI may provide preliminary evidence of a potential neurochemical mechanism that may underlie obesity-related cognitive vulnerability within the memory domain.
Elevations in mI were predicted in this study based on similar findings in other cognitively vulnerable populations (38,45). In contrast to our original hypothesis, however, the relation between higher BMI and lower NAA was not observed in the present study. NAA is a marker of neuronal viability, and reductions have typically been observed in disorders with cerebral atrophy (15). In contrast, mI is a simple sugar alcohol that serves as an osmotic regulator and a proposed marker of gliosis (38). Reductions in NAA frequently occur in conjunction with elevations in mI in cognitively vulnerable populations (38,46). Reductions in NAA and elevations in mI, however, do not necessarily correlate with one another (46), suggesting that they reflect different pathological processes. The current findings suggest that osmotic regulation and/or glial cell alterations may precede the neuronal loss associated with higher BMI.
In the present study, mI/Cr was the only neurometabolite to relate to cognitive performance. Our follow-up analysis revealed that this effect was specific to memory. The significance of mI/Cr for cognition in adults with memory disorders has been demonstrated by previous studies, which have found that mI/Cr levels can predict the degree of cognitive decline in individuals with mild cognitive impairment and Alzheimer’s disease (36,38). As anticipated, BMI was not directly associated with cognitive performance in our sample. These results are not surprising given that the sample consisted of high-functioning middle-aged adults (mean FSIQ = 113.5). At midlife, obesity has small negative effects on cognition (r = −0.11 to r=−0.23) (7) that can be difficult to detect on pen and paper tests. Sensitive neurobiological markers such as cerebral neurochemistry bear importance for prevention since they may provide evidence of cognitive vulnerability in individuals who are currently cognitively-intact. Given that higher mI/Cr levels were related to poorer memory performance, BMI-related elevations in mI/Cr may be a mechanism contributing to cognitive vulnerability within the memory domain. Longitudinal studies on BMI and cognition will be instrumental in determining if mI concentrations are predictive of future cognitive trajectories.
Given the detected associations of cerebral mI levels with BMI and memory performance, speculation about the physiological pathways via which elevated BMI may lead to increased cerebral mI and poorer memory performance is of interest. In the brain, mI servers an organic osmolyte (47), protecting cells from death or damage by shrinkage or swelling subsequent to large alterations in water diffusion. Chronic hypernatremia induces robust increases in cerebral mI concentrations and even small, persistent changes in plasma tonicity may increase mI concentrations in the brain (48). In the periphery, overweight and obese individuals have higher extracellular relative to intracellular body fluid (ECF/ICF) that is presumed to be due to higher plasma tonicity (22). Evidence for similar effects in the central nervous system is provided by a diffusion weighted imaging study demonstrating that obese individuals have higher apparent diffusion coefficient (ADC) values in numerous regions throughout the brain in comparison to lean controls (23). ADC values represent the diffusion of water molecules within a tissue and vasogenic edema, a condition of elevated cerebral extracellular water distribution, is related to higher ADC values (49). Similarly in obese individuals, higher ADC values may represent an increased ECF secondary to plasma hypertonicity (23). In such a state, cerebral concentrations of mI would be upregulated to maintain osmotic balance. Thus, plasma hypertonicity may be a mechanism linking higher BMI to elevations in cerebral mI. Over time alterations in osmotic regulation may cause cellular damage through shrinkage or swelling, ultimately resulting in cerebral atrophy and memory decline.
Alternatively, the association between mI and BMI may be explained by inflammation-related gliosis. Insult or injury in the brain induces astrocyte proliferation and the presence of activated microglia, which release inflammatory cytokines and oxidative radicals (50). MI resides primarily in glial cells so inflammatory-induced gliosis may increase its cerebral concentrations (38). Elevations in mI have been detected in several conditions associated with neuroinflammation such as multiple sclerosis (51), acquired immunodeficiency syndrome (52), and Alzheimer’s disease (38). Inflammation is also a well-established symptom of obesity. Adipose tissue secretes numerous cytokines, some which are capable of crossing the blood brain barrier and initiating a local proinflammatory response (53). In rodents, high fat diets have been shown to increase astrocyte proliferation and microglial reactivity, resulting in poorer memory ability on a spatial navigation task (54). Obesity-related inflammation may therefore be a potential mechanism responsible for elevated mI concentrations and memory decline.
It is of note, however, that while the current study found a strong association between mI and BMI, the two other published 1H MRS studies examining cerebral neurochemistry and BMI did not find significant association with mI levels (55,56). Examining middle-aged adults, Gadzinksi et al. (2008) (55) reported that greater BMI was associated with lower NAA/Cr levels in the frontal, parietal, and temporal white matter, lower NAA/Cr in the frontal grey matter, and lower Cho/Cr in the frontal white mater. In a similar study of older adults, Gazdzinski et al. (2010) (56) found that BMI was related with decreased NAA/Cr and Glu/Cr in the anterior cingulate. The prior studies reported no association between NAA/Cr and BMI in more posterior grey matter regions similar to the current findings. Yet, elevations in mI/Cr concentrations in occipitoparietal grey matter are a unique finding in this study. The variation in findings may be due to methodological differences. The study conducted by Gazdzinski et al. (2008) (55) acquired data from a 1.5-Telsa scanner with an echo time/repetition time (TE/TR) = 25/1800 ms. In Gazdzinski et al. (2010) (56) a 4-Telsa scanner with a TE/TR = 15/2000 was utilized. The current study was conducted on a 3-Telsa scanner with a TE/TR = 35/3000 ms. Differences in magnetic field strength and TE/TR parameters can alter quantifiable precision due to changes in the signal-to-noise ratio and chemical shift dispersion (57). Another potential explanation for the discrepancy between the current study and previous ones may be explained by differences in the participant samples. In the current study, a relatively large proportion of participants were obese (47.2%) in comparison to the sparse representation of obese individuals in the other two studies, 10% (55) and 0% (56) respectively. It is possible that perturbations of mI/Cr in posterior areas do not emerge until BMI becomes sufficiently elevated.
While contemplating the results of the study, it is important to consider its strengths and limitations. A primary strength of the current study was the detailed characterization of the study participants in terms of cognitive function. Our comprehensive neuropsychological test battery provided a thorough assessment of participants’ cognitive functioning across multiple domains, thus allowing us to rule out pre-existing undetected or under-reported clinically significant cognitive impairment as an alternative explanation of our results observations. The study also included objective assessment of physiological indices such as fasting glucose levels and systolic blood pressure. This enabled us to statistically adjust for common co-morbidities associated with obesity and cerebral alterations in order to determine BMI’s independent impact on cerebral neurochemistry. A limitation of the study, on the other hand, was the relatively small and healthy sample, so the present findings must be considered preliminary. While the restriction of the sample to individuals without self-reported chronic diseases such as coronary artery disease, heart failure, and psychiatric illness allowed us to assess the impact of BMI on neurochemistry in and of itself, without the confounding effects of co-morbid medical conditions, the simultaneous examination of multiple cognitive risk factors will be important in future studies. Additionally, in the current analysis, BMI was the only measure of obesity assessed. Future studies would benefit from the inclusion of other indices such as waist circumference and waist-to-hip ratios in order to determine the definition of obesity that is most relevant to alterations in neurochemistry. Inclusion of physical fitness assessments would also be beneficial since a sedentary lifestyle is also a risk factor for cognitive deficits (58) and cerebral atrophy (59). Finally, our methods could be improved by inclusion of multiple spectroscopy voxels, tissue segmentation, and absolute quantification. The occipitoparietal region that was sampled in this study, though traditionally considered a grey matter region of interest, inherently includes some white matter. As neurometabolite concentrations have been noted to vary between grey and white matter tissue (24) and changes in grey/white matter composition have been reported in association with BMI (6), tissue segmentation may be a useful correction in the future. Inclusion of multiple voxels, on the other hand, would provide better characterization of BMI-related alterations across the cerebral cortex. Finally, absolute quantification methods would resolve potential problems with the use of Cr as a normalizing factor as they would remove the underlying assumption that Cr concentrations are constant across the full range of BMI. Last but not least, the cross-sectional nature of the study is a limitation. We are unable to determine if alterations in mI are pre-existing or develop as a result of higher BMI. It is also unclear as to whether mI elevations would reverse with successful weight loss. Longitudinal studies will be critical in determining whether the observed alterations in neurochemical concentrations are predictive of individual cognitive trajectories.
In conclusion, we found that higher BMI was associated with elevations in mI/Cr concentrations in the occipitoparietal grey matter and indirectly related to global cognitive performance through mI/Cr. Subsequent follow-up analyses revealed that this effect was driven by memory performance. The findings potentially implicate plasma hypertonicity and neuroinflammation as mechanisms underlying obesity-related brain dysfunction. Longitudinal studies will be necessary to determine if the observed neurometabolic alterations are predictive of future memory decline. With validation and absolute quantification, studies of neurometabolites may help uncover the pathological the pathological mechanisms underlying the deleterious effects of elevated BMI on central nervous system functioning.
Acknowledgments
This work was funded in part by grants from the American Heart Association (09BGIA2060722, APH), American Federation for Aging Research (8A0024, APH), the National Institutes of Health (NS075565, APH) and the University of Texas at Austin (APH). The authors thank the Imaging Center Staff for their help with the participants.
Abbreviations
- BMI
body mass index
- 1H MRS
proton magnetic resonance spectroscopy
- NAA
N-acetyl-aspartate
- Cr
creatine
- mI
myo-inositol
- Cho
choline
- Glu
glutamate
- MRI
magnetic resonance imaging
- TE/TR
echo time/repetition time
- SPGR
spoiled gradient echo
- LDL-cholesterol
low-density lipoprotein cholesterol
- HDL-cholesterol
high-density lipoprotein cholesterol
- ECF
extracellular fluid
- ICF
intracellular fluid
- ADC
apparent diffusion coefficient
- MMSE
Mini Mental Status Exam
- WASI
Wechsler Abbreviated Scale of Intelligence
- FSIQ
full scale intelligence quotient
- RCF
Rey Complex Figure Test
- CVLT-II
California Verbal Learning Test-II
- WAIS-III
Wechsler Adult Intelligence Scale-III
- COWAT
Controlled Oral Word Association Test
Footnotes
Conflict of Interest
Dr. Haley is funded by the National Institutes of Health, the American Heart Association, and the American Federation for Aging Research, and has received research support from the University of Texas at Austin and NINR Center (P30 NR005051). Dr. Tanaka received research support from the American Heart Association. Gonzales, Tarumi, Eagan, and Vaghasia have no disclosures to report. The publication of this manuscript in Psychosomatic Medicine will not constitute a conflict of interest with any financial or other relationships for any of the authors.
The publication of this manuscript in Psychosomatic Medicine will not constitute a conflict of interest with any financial or other relationships for any of the authors.
References
- 1.National Center for Health Statistics. Chartbook on trends in the health of Americans. Hyattsville: Public Health Service; 2006. [PubMed] [Google Scholar]
- 2.Visscher TLS, Seidell JC, Menotti A, Blackburn H, Nissinen A, Feskens EJM, Kromhout D. Underweight and overweight in relation to mortality among men aged 40–59 and 50–69 years: the Seven Countries Study. Am J Epidemiol. 2000;151:660–6. doi: 10.1093/oxfordjournals.aje.a010260. [DOI] [PubMed] [Google Scholar]
- 3.Baumgartner RN, Heymsfield SB, Roche AF. Human body composition and the epidemiology of chronic disease. Obes Res. 1995;3:73–95. doi: 10.1002/j.1550-8528.1995.tb00124.x. [DOI] [PubMed] [Google Scholar]
- 4.Whitmer RA, Gunderson EP, Quesenberry CP, Zhou J, Yaffe K. Body mass index in midlife and risk of Alzheimer disease and vascular dementia. Curr Alzheimer Res. 2007;4:103–9. doi: 10.2174/156720507780362047. [DOI] [PubMed] [Google Scholar]
- 5.Elias MF, Elias PK, Sullivan LM, Wolf PA, D’Agostino RB. Lower cognitive function in the presence of obesity and hypertension: the Framingham heart study. Int J Obes. 2003;27:260–8. doi: 10.1038/sj.ijo.802225. [DOI] [PubMed] [Google Scholar]
- 6.Walther K, Birdsill AC, Glisky EL, Ryan L. Structural brain differences and cognitive functioning related to body mass index in older females. Hum Brain Mapp. 2009;31:1052–64. doi: 10.1002/hbm.20916. [DOI] [PMC free article] [PubMed] [Google Scholar]
- 7.Gunstad J, Paul RH, Cohen RA, Tate DF, Spitznagel MB, Gordon E. Elevated body mass index is associated with executive dysfunction in otherwise healthy adults. Compr Psychiatry. 2007;48:57–61. doi: 10.1016/j.comppsych.2006.05.001. [DOI] [PubMed] [Google Scholar]
- 8.Volkow ND, Wang GJ, Telang F, Fowler JS, Goldstein RZ, Alia-Klein N, Logan J, Wong C, Thanos PK, Ma Y, Pradhan K. Inverse association between BMI and prefrontal metabolic activity in healthy adults. Obesity. 2008;17:60–5. doi: 10.1038/oby.2008.469. [DOI] [PMC free article] [PubMed] [Google Scholar]
- 9.Hayes AF. Beyond Baron and Kenny: statistical mediation analysis in the new millennium. Commun Monogr. 2009;76:408–20. Statistical Mediation Analysis in the. [Google Scholar]
- 10.MacKinnon DP, Krull JL, Lockwood CM. Equivalence of the mediation, confounding and suppression effect. Prev Sci. 2000;1:173–81. doi: 10.1023/a:1026595011371. [DOI] [PMC free article] [PubMed] [Google Scholar]
- 11.Shrout PE, Bolger N. Mediation in experimental and nonexperimental studies: New procedures and recommendations. Psychol Methods. 2002;7:422–45. [PubMed] [Google Scholar]
- 12.Summers M, Swanton J, Fernando K, Dalton C, Miller DH, Cipolotti L, Ron MA. Cognitive impairment in multiple sclerosis can be predicted by imaging early in the disease. J Neurol Neurosurg Psychiatry. 2008;79:955–8. doi: 10.1136/jnnp.2007.138685. [DOI] [PubMed] [Google Scholar]
- 13.Doraiswamy PM, Charles HC, Krishnan KRR. Prediction of cognitive decline in early Alzheimer’s disease. Lancet. 1998;352:1678. doi: 10.1016/S0140-6736(05)61449-3. [DOI] [PubMed] [Google Scholar]
- 14.Friedman SD, Brooks WM, Jung RE, Chiulli SJ, Sloan JH, Montoya BT, Hart BL, Yeo RA. Quantitative proton MRS predicts outcome after traumatic brain injury. Neurology. 1999;52:1384–91. doi: 10.1212/wnl.52.7.1384. [DOI] [PubMed] [Google Scholar]
- 15.Danielsen ER, Ross B. Magnetic resonance spectroscopy diagnosis of neurological diseases. New York: Marcel Dekker, Inc; 1999. [Google Scholar]
- 16.Kantarci K, Jack CR, Jr, Xu YC, Campeau NG, O’Brien PC, Smith GE, Ivnik RJ, Boeve BF, Kokman E, Tangalos EG, Petersen RC. Regional metabolic patterns in mild cognitive impairment and Alzheimer’s disease: a 1H MRS study. Neurology. 2000;55:210–7. doi: 10.1212/wnl.55.2.210. [DOI] [PMC free article] [PubMed] [Google Scholar]
- 17.Godbolt AK, Waldman AD, MacManus DG, Schott JM, Frost C, Cipolotti L, Fox NC, Rossor MN. MRS shows abnormalities before symptoms in familial Alzheimer disease. Neurology. 2006;66:718–22. doi: 10.1212/01.wnl.0000201237.05869.df. [DOI] [PubMed] [Google Scholar]
- 18.Banks WA, Kastin AJ, Huang W, Jaspan JB, Maness LM. Leptin enters the brain by a saturable system independent of insulin. Peptides. 1996;17:305–11. doi: 10.1016/0196-9781(96)00025-3. [DOI] [PubMed] [Google Scholar]
- 19.Lafrance V, Inoue W, Kan B, Luheshi GN. Leptin modulates cell morphology and cytokine release in microglia. Brain Behav Immun. 2010;24:358–65. doi: 10.1016/j.bbi.2009.11.003. [DOI] [PubMed] [Google Scholar]
- 20.Srinivasan SR, Myers L, Berenson GS. Predictability of childhood adiposity and insulin for developing insulin resistance syndrome (syndrome X) in young adulthood. Diabetes. 2002;51:204–9. doi: 10.2337/diabetes.51.1.204. [DOI] [PubMed] [Google Scholar]
- 21.Craft S, Stennis Watson G. Insulin and neurodegenerative disease: shared and specific mechanisms. Lancet Neurol. 2004;3:169–78. doi: 10.1016/S1474-4422(04)00681-7. [DOI] [PubMed] [Google Scholar]
- 22.Stookey JD, Barclay D, Arieff A, Popkin BM. The altered fluid distribution in obesity may reflect plasma hypertonicity. Eur J Clin Nutr. 2006;61:190–9. doi: 10.1038/sj.ejcn.1602521. [DOI] [PubMed] [Google Scholar]
- 23.Alkan A, Sahin I, Keskin L, Cikim AS, Karakas HM, Sigirci A, Erdem G. Diffusion-weighted imaging features of brain in obesity. Magn Reson Imaging. 2008;26:446–50. doi: 10.1016/j.mri.2007.10.004. [DOI] [PubMed] [Google Scholar]
- 24.Ross AJ, Sachdev PS. Magnetic resonance spectroscopy in cognitive research. Brain Res Rev. 2004;44:83–102. doi: 10.1016/j.brainresrev.2003.11.001. [DOI] [PubMed] [Google Scholar]
- 25.Brand A, Richter-Landsberg C, Leibfritz D. Multinuclear NMR studies on the energy metabolism of glial and neuronal cells. Dev Neurosci. 1993;15:289–98. doi: 10.1159/000111347. [DOI] [PubMed] [Google Scholar]
- 26.Lezak M, Howieson D, Loring D, Hannay H, Fischer J. Neuropsychological assessment. 4. New York: Oxford University Press; 2004. [Google Scholar]
- 27.Folstein MF, Folstein SEP, McHugh R. Mini-Mental State: a practical method for grading the cognitive state of patients for the clinician. Journal of Psychiatric Research. 1975;12(3):189–98. doi: 10.1016/0022-3956(75)90026-6. [DOI] [PubMed] [Google Scholar]
- 28.Wechsler D. Wechsler Abbreviated Scale of Intelligence. San Antonio: The Psychological Corporation; 1999. [Google Scholar]
- 29.Morris JC, Heyman A, Mohs RC, Hughes JP, Van Belle G, Fillenbaum G, Clark C. The consortium to establish a registry for Alzheimer’s disease (CERAD). I. Clinical and neuropsychological assessment of Alzheimer’s disease. Neurology. 1989;39:1159–65. doi: 10.1212/wnl.39.9.1159. [DOI] [PubMed] [Google Scholar]
- 30.Meyers JE, Meyers KR. Rey Complex Figure Test and recognition trial: Professional manual. Odessa: Psychological Assessment Resources; 1995. [Google Scholar]
- 31.Delis DC, Kramer JH, Kaplan E, Ober BA. California Verbal Learning Test: Adult version. San Antonio: The Psychological Corporation; 1987. [Google Scholar]
- 32.Reitan RM. Validity of the Trail Making Test as an indicator of organic brain damage. Percept Mot Skills. 1958;8:271–6. [Google Scholar]
- 33.Ruff RM, Light RH, Parker SB, Levin HS. Benton controlled oral word association test: Reliability and updated norms. Arch Clin Neuropsychol. 1996;11:329–38. [PubMed] [Google Scholar]
- 34.Wechsler D. WAIS-III administration and scoring manual. 3. San Antonio: The Psychological Corporation; 1997. [Google Scholar]
- 35.Ruff RM, Parker SB. Gender-and age-specific changes in motor speed and eye-hand coordination in adults: Normative values for the Finger Tapping and Grooved Pegboard tests. Percept Mot Skills. 1993;76:1219–30. doi: 10.2466/pms.1993.76.3c.1219. [DOI] [PubMed] [Google Scholar]
- 36.Griffith HR, Hollander JA, Okonkwo O, Evanochko WT, Harrell LE, Zamrini EY, Brockington JC, Marson DC. Executive function is associated with brain proton magnetic resonance spectroscopy in amnestic mild cognitive impairment. J Clin Exp Neuropsyc. 2007;29(6):599–609. doi: 10.1080/13803390600826595. [DOI] [PubMed] [Google Scholar]
- 37.Provencher SW. Estimation of metabolite concentrations from localized in vivo proton NMR spectra. Magn Reson Med. 1993;30:672–9. doi: 10.1002/mrm.1910300604. [DOI] [PubMed] [Google Scholar]
- 38.Kantarci K, Smith GE, Ivnik RJ, Petersen RC, Boeve BF, Knopman DS, Tangalos EG, Jack CR. 1H magnetic resonance spectroscopy, cognitive function, and apolipoprotein E genotype in normal aging, mild cognitive impairment and Alzheimer’s disease. J Int Neuropsychol Soc. 2002;8:934–42. doi: 10.1017/s1355617702870084. [DOI] [PMC free article] [PubMed] [Google Scholar]
- 39.Preacher K, Hayes A. SPSS and SAS Procedures for estimating indirect effects in simple mediation models. Behav Res Methods Instrum Comput. 2004;36:717–3. doi: 10.3758/bf03206553. [DOI] [PubMed] [Google Scholar]
- 40.Neale M. Mx: Statistical Modeling. 2. Richmond, VA: Department of Psychiatry, Box 710 MCV; 1997. [Google Scholar]
- 41.Sahin I, Alkan A, Keskin L, Cikim A, Karakas HM, Firat AK, Sigirci A. Evaluation of in vivo cerebral metabolism on proton magnetic resonance spectroscopy in patients with impaired glucose tolerance and type 2 diabetes mellitus. J Diabetes Complicat. 2008;22:254–60. doi: 10.1016/j.jdiacomp.2007.03.007. [DOI] [PubMed] [Google Scholar]
- 42.Geissler A, Fründ R, Schölmerich J, Feuerbach S, Zietz B. Alterations of cerebral metabolism in patients with diabetes mellitus studied by proton magnetic resonance spectroscopy. Exp Clin Endocrinol Diabetes. 2003;111:421–7. doi: 10.1055/s-2003-44289. [DOI] [PubMed] [Google Scholar]
- 43.Haroon E, Watari K, Thomas A, Ajilore O, Mintz J, Elderkin-Thompson V, Darwin C, Kumaran S, Kumar A. Prefrontal myo-inositol concentration and visuospatial functioning among diabetic depressed patients. Psychiatry Res. 2009;171:10–9. doi: 10.1016/j.pscychresns.2008.03.006. [DOI] [PubMed] [Google Scholar]
- 44.García Santos JM, Fuentes LJ, Vidal JB, Carrillo A, Antequera M, Campoy G, Antúnez C, Torres del Río S, García-Sevilla J, Ortega G. Posterior paralimbic and frontal metabolite impairments in asymptomatic hypertension with different treatment outcomes. Hypertens Res. 2010;33:67–75. doi: 10.1038/hr.2009.176. [DOI] [PubMed] [Google Scholar]
- 45.Shonk T, Ross BD. Role of Increased Cerebral myo-Inositol in the dementia of Down syndrome. Magn Reson Med. 1995;33:858–61. doi: 10.1002/mrm.1910330619. [DOI] [PubMed] [Google Scholar]
- 46.Zhu X, Schuff N, Kornak J, Soher B, Yaffe K, Kramer JH, Ezekiel F, Miller BL, Jagust WJ, Weiner MW. Effects of Alzheimer disease on fronto-parietal brain N-acetyl aspartate and myo-inositol using magnetic resonance spectroscopic imaging. Alzheimer Dis Assoc Disord. 2006;20:77–85. doi: 10.1097/01.wad.0000213809.12553.fc. [DOI] [PMC free article] [PubMed] [Google Scholar]
- 47.Ross BD. Biochemical considerations in 1H spectroscopy. Glutamate and glutamine; myo-inositol and related metabolites. NMR Biomed. 1991;4:59–63. doi: 10.1002/nbm.1940040205. [DOI] [PubMed] [Google Scholar]
- 48.Strange K, Emma F, Paredes A, Morrison R. Osmoregulatory changes in Myo-inositol content and Na+/Myo-inositol contransport in rat cortical astrocytes. Glia. 1994;12:35–43. doi: 10.1002/glia.440120105. [DOI] [PubMed] [Google Scholar]
- 49.Loubinoux I, Volk A, Borredon J, Guirimand S, Tiffon B, Seylaz J, Meric P, Rosenburg GA. Spreading of vasogenic edema and cytotoxic edema assessed by quantitative diffusion and T2 magnetic resonance imaging. Stroke. 1997;28:419–27. doi: 10.1161/01.str.28.2.419. [DOI] [PubMed] [Google Scholar]
- 50.Ringheim GE, Conant K. Neurodegenerative disease and the neuroimmune axis (Alzheimer’s and Parkinson’s disease, and viral infections) Journal Neuroimmunol. 2004;147:43–9. doi: 10.1016/j.jneuroim.2003.10.013. [DOI] [PubMed] [Google Scholar]
- 51.Srinivasan R, Sailasuta N, Hurd R, Nelson S, Pelletier D. Evidence of elevated glutamate in multiple sclerosis using magnetic resonance spectroscopy at 3 T. Brain. 2005;128:1016–25. doi: 10.1093/brain/awh467. [DOI] [PubMed] [Google Scholar]
- 52.Menon DK, Baudouin CJ, Tomlinson D, Hoyle C. Proton MR spectroscopy and imaging of the brain in AIDS: evidence of neuronal loss in regions that appear normal with imaging. J Comput Assist Tomogr. 1990;14:882–5. doi: 10.1097/00004728-199011000-00003. [DOI] [PubMed] [Google Scholar]
- 53.Greenberg AS, Obin MS. Obesity and the role of adipose tissue in inflammation and metabolism. Am J Clin Nutr. 2006;83:461–5. doi: 10.1093/ajcn/83.2.461S. [DOI] [PubMed] [Google Scholar]
- 54.Pistell PJ, Morrison CD, Gupta S, Knight AG, Keller JN, Ingram DK, Bruce-Keller AJ. Cognitive impairment following high fat diet consumption is associated with brain inflammation. J Neuroimmunol. 2010;219:25–32. doi: 10.1016/j.jneuroim.2009.11.010. [DOI] [PMC free article] [PubMed] [Google Scholar]
- 55.Gazdzinski S, Kornak J, Weiner MW, Meyerhoff DJ. Body mass index and magnetic resonance markers of brain integrity in adults. Ann Neurol. 2008;63:652–7. doi: 10.1002/ana.21377. [DOI] [PMC free article] [PubMed] [Google Scholar]
- 56.Gazdzinski S, Millin R, Kaiser LG, Durazzo TC, Mueller SG, Weiner MW, Meyerhoff DJ. BMI and neuronal integrity in healthy, cognitively normal elderly: a proton magnetic resonance spectroscopy study. Obesity. 2010;18:743–8. doi: 10.1038/oby.2009.325. [DOI] [PMC free article] [PubMed] [Google Scholar]
- 57.Bartha R, Drost DJ, Menon RS, Williamson PC. Comparison of the quantification precision of human short echo time 1H spectroscopy at 1.5 and 4. 0 Tesla. Magn Reson Med. 2000;44:185–92. doi: 10.1002/1522-2594(200008)44:2<185::aid-mrm4>3.0.co;2-v. [DOI] [PubMed] [Google Scholar]
- 58.Barnes DE, Yaffe K, Satariano WA, Tager IB. A longitudinal study of cardiorespiratory fitness and cognitive function in healthy older adults. J Am Geriatr Soc. 2003;51:459–65. doi: 10.1046/j.1532-5415.2003.51153.x. [DOI] [PubMed] [Google Scholar]
- 59.Colcombe SJ, Erickson KI, Raz N, Webb AG, Cohen NJ, McAuley E, et al. Aerobic fitness reduces brain tissue loss in aging humans. J Gerontol A Biol Sci Med Sci. 2003;58:176–80. doi: 10.1093/gerona/58.2.m176. [DOI] [PubMed] [Google Scholar]