Abstract
Adipose tissue located in the viscera is considered to be functionally and metabolically different from that found in the subcutaneous depot. However, subcutaneous adipose tissue in generalized regions is considered to be homogeneous in nature. Affymetrix GeneChip Human Exon 1.0 ST Arrays were used to determine differential gene expression in four subcutaneous adipose depots (upper abdomen, lower abdomen, flank and hip) in normal weight women. A total of 2890/24,409 transcripts were differentially expressed between all sites. When comparing the hip and flank to the lower abdomen, 248 and 83 genes were differentially expressed, respectively. When comparing the hip and flank to the upper abdomen, 2480 and 79 genes were differentially expressed, respectively. No genes were significantly different when the lower abdomen was compared to the upper abdomen and the hip to the flank. Genes involved in the complement and coagulation cascades and immune responses showed increased expression in the lower abdomen compared to the flank. In addition, two genes involved in the complement and coagulation cascade, CR1 and C7, were expressed more highly in the lower abdomen compared to the hip. Genes involved in basic biochemical metabolism including insulin signaling, the urea cycle, glutamate metabolism, arginine and proline metabolism and aminosugar metabolism had higher expression in the lower abdomen compared to the hip. These results in normal weight healthy women provide a new perspective on regional differences in subcutaneous adipose tissue biology that may have pathophysiologic implications when adiposity increases.
Introduction
An increase in the accumulation of abdominal adipose tissue (AT) and insulin resistance is well accepted (1, 2). Visceral adipose tissue (VAT) is functionally distinct compared to subcutaneous adipose tissue (SAT) (3–7). In general, this pattern of relative gene expression is one of reduced insulin sensitivity, increased basal and catecholamine-induced lipolysis, and secretion of pro-inflammatory cytokines. It is recognized that visceral and abdominal SAT are anatomically distinct and both depots have been suggested to independently enhance the risk of metabolic and cardiovascular disease (1, 8, 9).
Although the differences in morphology and physiological function between abdominal VAT and SAT have been well documented (2), the differences between distinct SAT depots have been less thoroughly investigated. It has been shown that there are differences in the steady state expression of lipoprotein lipase (LPL) in gluteal and abdominal SAT (10), but not between femoral and gluteal SAT (11). Moreover, during lactation free fatty acid flux is predominantly served by the gluteal/femoral and not the abdominal wall AT depot (12). In addition, the distribution of SAT influences insulin action, i.e. relative increases in the femoral-gluteal AT vs. abdominal depot is associated with lower plasma insulin and triglyceride levels (13, 14). The purpose of this study was to determine if there are differences in gene expression between distinct SAT depots, and if so, does the pattern of gene expression vary with time?
Methods and Procedures
Subjects
This study, approved by the Colorado Multiple Institutional Review Board, is a sub-study of a larger study that investigated whether or not body fat was regained subsequent to surgical suction lipectomy (15). In that study, baseline measurements were performed on all participants, including weight/height, anthropometric measures to include regional circumferences and body composition assessment using skinfold calipers, and AT biopsies. Participants were then randomized to either the surgery or control groups. Surgery patients had the surgery within 2–4 weeks. Both the surgery and control groups underwent identical measurements 6 weeks and 6 months later. Each participant granted informed consent before screening. Candidates for small-volume “contouring” liposuction (<5000 mL removal) were determined by the surgeon (CKL). Premenopausal women between 18–50 years with a BMI of 22–27 kg/m2 were considered eligible for the study. Eligible participants were weight stable for at least 3–6 months (<7% change from maximum weight) prior to entering the study. Participants were non-smokers with no history of glucose intolerance, dyslipidemia, liver, kidney or cardiac disease, hypertension, cancer or any disorder that might have interfered with a ‘normal’ lifestyle (nutrition, physical activity). Women on thyroid hormone replacement were included if TSH levels were normal. Women on oral contraceptives were included if this form of contraceptive therapy was maintained throughout study participation. Further exclusions were: reduced-obesity (history weight loss >10% of maximum body weight); history of liposuction or gastric bypass surgery; evidence of body dysmorphic disorder; taking medications affecting carbohydrate and lipid metabolism; hematocrit, hemoglobin, WBC, platelet count, liver or renal function tests outside of the normal range; fasting glucose >110 mg/dL; triglycerides >200 mg/dL; HDL cholesterol <35 mg/dL and LDL cholesterol >160 mg/dL; proteinuria; blood pressure >140/90 mm/Hg; electrocardiographic abnormalities.
Abdominal and Limb Circumferences/Subcutaneous Skinfold Measures
Circumferences were measured on the thigh, waist, abdomen, and hips using a standardized tape measure with tension regulator (Novel Products, Rockton, IL, USA). Waist circumference was measured just under the ribcage and abdominal circumference at the level of the umbilicus. Suprailiac and periumbilical subcutaneous skinfolds were measured at standard locations (Lange Skinfold Calipers, Healthcheck Systems, Inc., Brooklyn, NY, USA)(17). Anthropometric measurements were taken by the same investigator (TLH) (15).
Regional adipose tissue biopsies
Adipose tissue biopsies were collected from 2 subcutaneous sites at baseline (before randomization to the suction lipectomy group or the no suction lipectomy group), 6 weeks, and 6 months (Table 1). At baseline, the first site was chosen in a region where suction lipectomy would occur whereas the second site was a region wherein surgery would not ensue. Approximately 4 mL of AT were removed from each site during the biopsy. Following local anesthesia (1% lidocaine, 0.25% bupivicaine, and sodium bicarbonate mixed in 100 mL of 0.9% normal saline), stab incisions were made and fat biopsies were obtained using Coleman's manual vacuum technique (16). Collection of tissue was accomplished using a 10-mL syringe system consisting of a cannula and locking device to hold the plunger back thereby creating a vacuum. The cannula was inserted into the fat and pulled back and forth as the plunger was pulled back to create the vacuum. This resulted in minimal bleeding, ecchymoses, and pain while obtaining substantial quantities of non-lysed AT.
Table 1. List of Biopsy Sites at Baseline, six weeks and six months.
Biopsies were obtained at baseline for all 13 subjects for microarray analysis. Biopsies at six weeks and six months from the seven subjects that received suction lipectomy were not included in the microarray analysis.
| Subject | Baseline | 6 Weeks | 6 Months | |||
|---|---|---|---|---|---|---|
| 4 | UA | LA | UA | LA | F | H |
| 7 | UA | LA | UA | LA | F | H |
| 9 | F | H | F | H | UA | IT |
| 10 | F | H | F | H | UA | IT |
| 11 | UA | LA | F | H | UA | LA |
| 15 | UA | LA | UA | LA | F | H |
| 5 | UA | LA | ||||
| 6 | UA | LA | UA | Upper Abdomen | ||
| 8 | H | LT | LA | Lower Abdomen | ||
| 12 | F | LT | F | Flank | ||
| 14 | UA | LA | H | Hip | ||
| 16 | UA | LA | LT | Lateral Thigh | ||
| 17 | UA | LA | IT | Inner Thigh | ||
Exon array analysis
Six subjects from the non-surgery group were randomly chosen for microarray analysis at baseline, 6wk and 6mo. Seven subjects were randomly chosen from the surgery group for microarray analysis at baseline. RNA was isolated from the AT and expression of 24,409 genes quantified using the Affymetrix GeneChip Human Exon 1.0 ST Array. The Exonmap package in R was used to analyze the expression data (17). This package supports a variety of routines for translating between probe sets, exons, genes and transcripts, and makes use of a relational database (X:Map) to define these relationships for the current genome assembly. X:Map is an annotation database using Ensembl. Exonmap provided some basic functions to load expression data into R and uses RMA to normalize and generate expression summaries for the probe sets. The genes with the lowest overall variance and fold change were removed by the filter. A non-paired T test was used to detect differences between the sites. The p-values associated with the t-test were adjusted for multiple testing by using the Benjamini & Hochberg approach (18). Genes with an adjusted p-value (q-value < 0.05) were considered differentially expressed. Principal Component Analysis (PCA) (19) was performed on our data using R (20). Non-negative matrix factorization was used to predict the classes within the significant genes that were predicted between the sites. The significant genes were assigned to functional pathways using GENEBROWSER2 (21, 22).
Real-Time PCR
RNA isolation from adipose tissue biopsies was performed using both TRIzol reagent (Invitrogen) and the RNeasy Mini Kit (Qiagen). Total RNA (500 ng) was reverse transcribed with the iScript cDNA synthesis kit (Bio-Rad, Hercules, CA), and quantitative PCR was performed using primer sets for genes of interest and reference genes and iQ SYBR Supermix (Bio-Rad) following manufacturer's protocols. Reactions were run in duplicate on an iQ5 real-time PCR detection system (Bio-Rad) along with a no-template control per gene. Validation experiments were performed to demonstrate that efficiencies of target and reference genes were approximately equal. Data were normalized to RPL13A (5’ CCT GGA GGA GAA GAG GAA AGA GA 3’ and 5’ TTG AGG ACC TCT GTG TAT TTG TCA A 3’) and fold change was determined using the formula 2−ΔΔCt. Primer sequences for PAI-1 were 5’ CCT GGC CTC AGA CTT CGG GGT 3’and 5’ GGG CCA TGC CCT TGT CAT CAA TCT T 3’, for CR1 were 5’ CCG GTG GCC TGG GGT CAA TG 3’ and 5’ CGT CTG CAC CTG TCC TTA GCA CC 3’, for F13A1 were 5’ GTG CTG ATC CAA GCC GGC GA 3’ and ACC TGA GTG CCA CGG ACC TTG A 3’, for C7 were 5’ GCC AGT GGG ACT TCT ATG CCC CT 3’ and 5’ TGA CCG CCT GCG AGT CTG AGT 3’, for C2 5’ TCC CTC CCG CGG CTC TCT AC 3’ and 5’ GCC AGA CCT GGG TAC AGG AAC AG 3’ and for C1qC were 5’ GGA CCC CTG CCC AGT TCC TTC T 3’ and 5’ CCT GTG TTG GCT TGG CCC CTG 3’.
Results
Subjects and Randomization
Eligibility for the liposuction study was assessed in 75 women during the years 2004–2007 and 34 subjects were randomized into the study. Fourteen women were randomized to receive liposuction surgery and 18 to the control group. The biopsies from seven women in the liposuction group and six in the control group were randomly chosen for GeneChip analysis. Amongst the subjects chosen for GeneChip analysis, no significant differences in anthropometric measurements including weight, BMI, abdominal circumferences and subcutaneous skin-fold thickness measurements were observed over the course of the study (Table 2).
Table 2. Anthropometric Measurements at Baseline, six weeks and six months.
No significant changes were observed in anthropometric measurements over time. Baseline, 6 week and 6 month measurements were analyzed using an ANOVA. Values displayed are the average ± standard deviation.
| BMI (kg/m2) | Waist1 (cm) | Abdomen1 (cm) | Hip1 (cm) | Thigh1 (cm) | Suprailiac2 (cm) | Peri-umbicular2 (cm) | |
|---|---|---|---|---|---|---|---|
|
|
|||||||
| Baseline n=13 | 23.9 ±2.5 | 75.8±6.86 | 80.4±9.45 | 98.43±6.7 | 53.97±4.4 | 19.8±5.1 | 20.4±8.00 |
| 6 wk n=6 | 23.8±2.8 | 74.9±6.46 | 79.8±8.15 | 98.2±6.9 | 54.6±4.92 | 18.1±5.5 | 20.5±7.2 |
| 6 mo n=6 | 23.9±2.8 | 75.2±6.1 | 81.2±8.3 | 99.1±5.8 | 54.9±4.2 | 18.1±7.5 | 21.1±9.0 |
| p-value | 0.997 | 0.968 | 0.951 | 0.968 | 0.925 | 0.838 | 0.983 |
Circumference,
Skinfold
Microarray Analysis
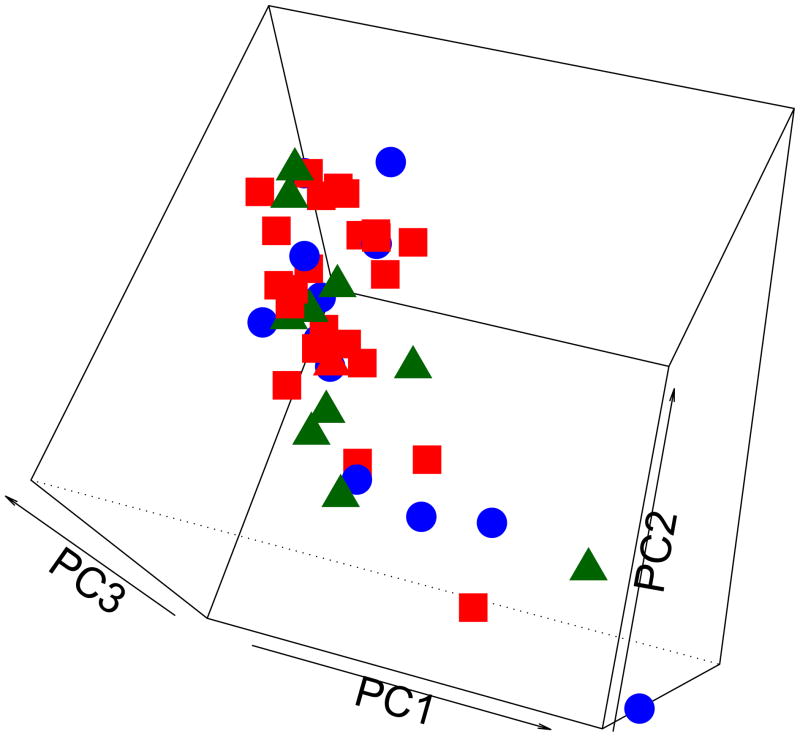
We compared the variance/covariance features between genes at different time points by conducting principal component analysis (PCA). Our results showed there was no significant change in gene expression over time when biopsies taken at baseline were compared to those obtained at six weeks and six months (ANOVA and PCA) (Figure 1). This suggests that gene expression is stable within subcutaneous AT depots over time. However, we did find that SAT gene expression varied between sites in these normal weight, healthy women (Figure 2).
Figure 1. Principal component analysis (PCA) between sites over time: baseline (Square), six weeks (Circle) and six month (Triangle) biopsies.
Gene expression data from biopsies at each time point were used to compare the variance/covariance features over time. Gene expression patterns did not change over time when biopsies taken at baseline were compared to those obtained at six weeks and six months.
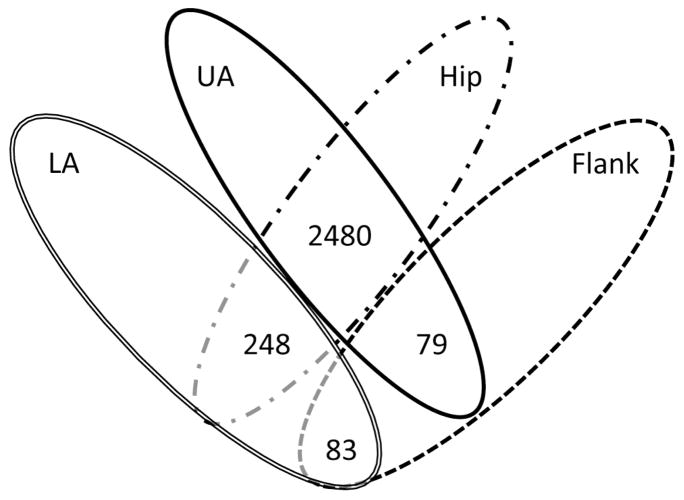
Figure 2. Four-way Venn diagram of genes differentially expressed between sites.
The p-values associated with the t-test were adjusted for multiple testing by using the Benjamini & Hochberg approach. The number of genes with a q-value < 0.05 were considered differentially expressed.
When comparing the hip and flank to the lower abdomen, 248 and 83 genes were differentially expressed, respectively. When comparing the hip and flank to the upper abdomen, 2480 and 79 genes were differentially expressed, respectively. No genes were differentially expressed when comparing the lower abdomen to the upper abdomen, and the hip to the flank (Figure 2).
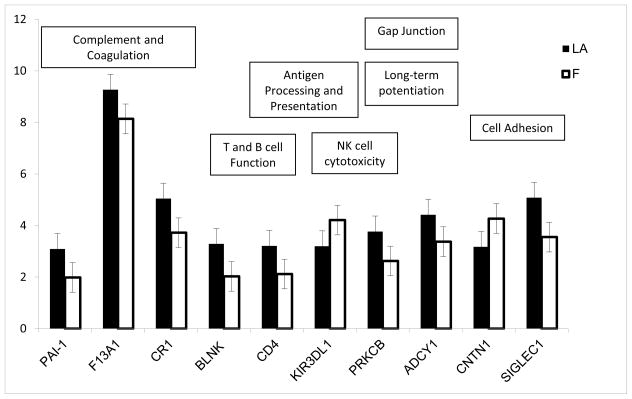
From the 83 genes differentially expressed in the lower abdomen compared to the flank (Supplemental File 1), 10 genes clustered into 12 functional pathways with a p-value < 0.05 (Figure 3). Nine of the 10 genes were expressed more highly in the lower abdomen with the exception of Killer cell immunoglobulin-like receptor 3DL1 (KIR3DL1) and Contactin 1 (CNTN1). Six of these 10 genes are involved in pathways related to the immune response. Of particular interest, three genes clustered into the complement and coagulation cascade, plasminogen activator inhibitor-1 (PAI-1), coagulation factor XII (F13A1), and complement receptor-1 (CR1) (p=6.67×10⁻⁶) and showed higher levels of expression in the lower abdomen compared to the flank. Although levels of complement component 2 (C2) were not significantly different (p = 0.09), C2 expression was highly correlated with the expression of F13A1 and CR1 (r = 0.86, 0.74 and 0.85, respectively). In addition, cluster of differentiation 4 (CD4) and B-cell linker (BLNK), genes that are involved in the development of T and B cells, were expressed higher in the lower abdomen compared to the flank.
Figure 3. Expression of genes that clustered to significantly enriched pathways in the lower abdomen compared to the flank.
From the 83 genes differentially expressed in the lower abdomen compared to the flank, 10 genes clustered into 12 functional pathways with a p-value < 0.05. Corresponding pathways are shown in the figure.
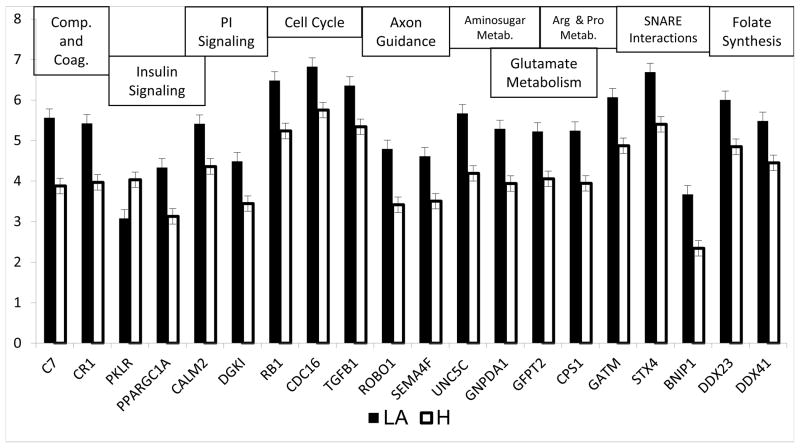
Twenty of the 248 genes (Supplemental File 2) differentially expressed in the lower abdomen compared to the hip clustered into 11 functional pathways with a p-value < 0.05 (Figure 4). All of these 20 genes in these pathways were more strongly expressed in the lower abdomen with the exception of pyruvate kinase isozyme R/L (PKLR). Five of the eleven enriched pathways are related to basic biochemical metabolism, including insulin signaling, the urea cycle, glutamate metabolism, arginine and proline metabolism and aminosugar metabolism (Figure 4). Two genes involved in the complement and coagulation cascade, CR1 and complement component 7 (C7), were more highly expressed in the lower abdomen compared to the hip.
Figure 4. Expression of genes that clustered to significantly enriched pathways in the lower abdomen compared to the hip.
Twenty of the 248 genes differentially expressed in the lower abdomen compared to the hip clustered into 11 functional pathways with a p-value < 0.05. Corresponding pathways are shown in the figure.
Real-Time PCR
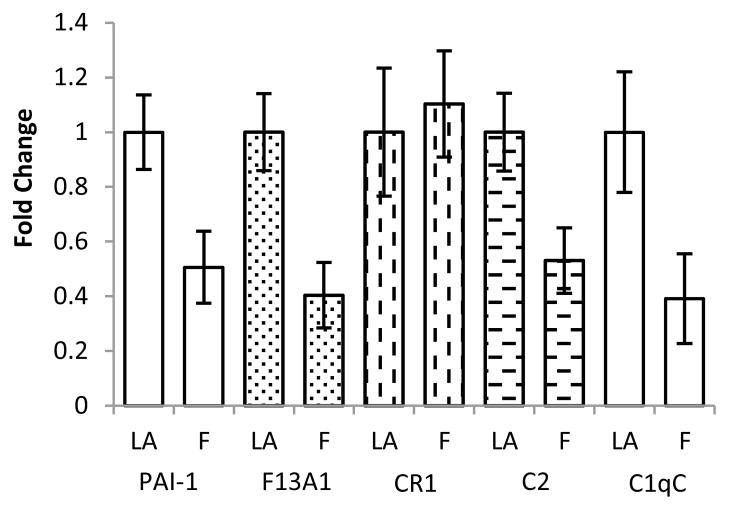
Four genes from the complement and coagulation cascade that were differentially expressed according to the microarray and two that approached significance were chosen for confirmation by real-time PCR. Of the five genes chosen for confirmation in the lower abdomen compared to the hip, PAI-1, F13A1, C2 and C1qC were concordant with the microarray data showing higher expression in the lower abdomen compared to the flank (Figure 5). Whereas C2 and C1QC expression approached significance according to the microarray, real-time PCR analysis showed significant differences of the two genes in the lower abdomen compared to the flank. C7 and CR1 were chosen for real-time PCR in the lower abdomen compared to the hip. C7 expression was higher in the lower abdomen compared to the hip, however, CR1 displayed no change in expression when comparing the lower abdomen to both the flank and hip.
Figure 5. Real-Time PCR Validation of Microarray.
Fold change was determined using the equation 2−Δ−ΔCt with expression in the lower abdomen used as the reference between groups. Values displayed are the fold change ± SD.
Discussion
The use of a pathway analysis tool provides a method to group the list of differentially expressed genes from our microarray data into functional pathways. Given the fact that the women in this study had an average BMI of 23.8 and all of the biopsies were from the SAT, large differences in gene expression were not expected. However, changes in the expression of groups of genes with related function are meaningful to compare possible functional differences between SAT depots. In this study, gene expression in distinct SAT depots sampled did not change over the six-month period. This suggests that in weight stable women without any perturbations, gene expression patterns in SAT were stable over time. However, differences in regional expression were consistent with abdominal SAT being associated with increased expression of genes that may contribute to insulin resistance and the metabolic syndrome, even before overweight/obesity commence.
Six genes that were up-regulated in the lower abdomen were chosen for verification by real-time PCR, i.e. PAI-1, F13A1 and CR1 that were significantly higher in the lower abdomen compared to the flank according to the microarray and C2 and C1QC that approached significance. In the lower abdomen compared to the hip the microarray revealed C7 and CR1 expression to be higher in the lower abdomen. CR1 was the only gene identified in both sets of analyses. Based on the RT-PCR we were able to confirm the increased expression of PAI-1, F13A1 and C2 in the lower abdomen compared to the flank and increased C7 in the lower abdomen compared to the hip. The discordance between the microarray and real-time PCR observed with CR1 is mostly likely explained by the increased sensitivity of real-time PCR analysis and the low expression levels of CR1. Thus, in a sampling of transcripts analyzed by real-time PCR, we feel that the regional SAT microarray data now set the stage for much more extensive pursuit of these pathways and the mechanism(s) by which anatomic region modify gene expression.
In obesity, increased AT mass is often associated with a pro-inflammatory state that may contribute to the development of insulin resistance and the metabolic syndrome (23). Increased adipocyte size and number are linked to higher levels of macrophage infiltration and activation through the release of MCP-1 (24–26). These macrophages are an important source of the inflammatory cytokines TNF-α and IL-6 (27). Of interest, cross-sectional data from the Framingham Heart Study show both VAT and SAT volumes are associated with elevated levels of the pro-inflammatory cytokines C-reactive protein, fibrinogen, IL-6 and TNF-α (28).
Our data demonstrate that genes related to the complement and coagulation cascades were dominantly expressed in the lower abdomen. The complement system is integral in the initiation and maintenance of the pro-inflammatory response (29). The complement components C2, C3, C4, C7 and Factor B are expressed more highly in VAT compared to SAT (5). In our study, we found higher expression of C7 in the lower abdomen compared to the hip and higher expression of C2 and C1QC in the lower abdomen compared to the flank. C1Q, the first subcomponent of complement, is able to bind to endothelial cells, activate the complement pathway and illicit the production of IL-8, IL-6 and MCP-1 (30).
Increased levels of the pro-thrombotic protein plasminogen activator inhibitor-1 (PAI-1) are also associated with the insulin resistant state and the risk of cardiovascular disease and type-2 diabetes (33). PAI-1 produced by the stromal vascular cells present in VAT and circulating levels of PAI-1 are associated with the volume of VAT (34). In addition to abdominal VAT, the amount of abdominal SAT is related to circulating PAI-1 levels, but not femoral SAT (35). In our study, the increase in PAI-1 gene expression in the upper abdominal SAT compared to SAT located in the flank provides further evidence that the abdominal wall is primed for further contribution to the risk for type-2 diabetes and CVD when central adiposity expands.
The current prevalence of overweight and obesity in the US is 68% for both men and women (36). Overweight and obesity are undeniably risk factors for the development and progression of chronic metabolic diseases such as diabetes and cardiovascular disease. Identifying the changes that take place in the AT as weight gain begins will be beneficial in developing prevention and treatment strategies for obesity-related metabolic diseases. In weight stable healthy individuals we observed differences in the expression of genes related to the pro-inflammatory process and insulin signaling in SAT depots. This emphasizes the need for longitudinal studies in subjects before and after weight gain to determine the timing and amount of increased expression within these gene family members across various SAT adipose tissue depots.
Supplementary Material
Acknowledgments
ADA Fellowship (Mechanisms defending fat mass in humans after lipectomy) to CWR and NS, R01 DK 061668-01A1 to RHE, 5R01LM008111 to LH, 5T15LM009451 to AK-F.
Footnotes
Disclosure
The authors declare no conflict of interest.
Supplementary Material is available at www.nature.com/obesity
References
- 1.Fox CS, Massaro JM, Hoffmann U, et al. Abdominal visceral and subcutaneous adipose tissue compartments: association with metabolic risk factors in the Framingham Heart Study. Circulation. 2007;116:39. doi: 10.1161/CIRCULATIONAHA.106.675355. [DOI] [PubMed] [Google Scholar]
- 2.Wajchenberg BL. Subcutaneous and visceral adipose tissue: their relation to the metabolic syndrome. Endocrine reviews. 2000;21:697. doi: 10.1210/edrv.21.6.0415. [DOI] [PubMed] [Google Scholar]
- 3.Arner P. Differences in lipolysis between human subcutaneous and omental adipose tissues. Annals of medicine. 1995;27:435–8. doi: 10.3109/07853899709002451. [DOI] [PubMed] [Google Scholar]
- 4.Dusserre E, Moulin P, Vidal H. Differences in mRNA expression of the proteins secreted by the adipocytes in human subcutaneous and visceral adipose tissues. Biochimica et Biophysica Acta (BBA) - Molecular Basis of Disease. 2000;1500:88–96. doi: 10.1016/s0925-4439(99)00091-5. [DOI] [PubMed] [Google Scholar]
- 5.Gabrielsson BG, Johansson JM, Lonn M, et al. High Expression of Complement Components in Omental Adipose Tissue in Obese Men. Obesity. 2003;11:699–708. doi: 10.1038/oby.2003.100. [DOI] [PubMed] [Google Scholar]
- 6.Laviola L, Perrini S, Cignarelli A, et al. Insulin signaling in human visceral and subcutaneous adipose tissue in vivo. Diabetes. 2006;55:952. doi: 10.2337/diabetes.55.04.06.db05-1414. [DOI] [PubMed] [Google Scholar]
- 7.Wajchenberg B, Giannella-Neto D, Da Silva M, Santos R. Depot-specific hormonal characteristics of subcutaneous and visceral adipose tissue and their relation to the metabolic syndrome. Hormone and metabolic research. 2002;34:616–21. doi: 10.1055/s-2002-38256. [DOI] [PubMed] [Google Scholar]
- 8.Abate N, Garg A, Peshock R, Stray-Gundersen J, Grundy S. Relationships of generalized and regional adiposity to insulin sensitivity in men. Journal of Clinical Investigation. 1995;96:88. doi: 10.1172/JCI118083. [DOI] [PMC free article] [PubMed] [Google Scholar]
- 9.Williams MJ, Hunter GR, Kekes-Szabo T, Snyder S, Treuth MS. Regional fat distribution in women and risk of cardiovascular disease. The American journal of clinical nutrition. 1997;65:855. doi: 10.1093/ajcn/65.3.855. [DOI] [PubMed] [Google Scholar]
- 10.Arner P, Lithell H, Wahrenberg H, Brönnegard M. Expression of lipoprotein lipase in different human subcutaneous adipose tissue regions. Journal of Lipid Research. 1991;32:423–9. [PubMed] [Google Scholar]
- 11.Rebuffé-Scrive M, Lönnroth P, Marin P, Wesslau C, Björntorp P, Smith U. Regional adipose tissue metabolism in men and postmenopausal women. International journal of obesity. 1987;11:347. [PubMed] [Google Scholar]
- 12.Rebuffe-Scrive M, Enk L, Crona N, et al. Fat cell metabolism in different regions in women. Effect of menstrual cycle, pregnancy, and lactation. Journal of Clinical Investigation. 1985;75:1973. doi: 10.1172/JCI111914. [DOI] [PMC free article] [PubMed] [Google Scholar]
- 13.Van Pelt RE, Jankowski CM, Gozansky WS, Schwartz RS, Kohrt WM. Lower-Body Adiposity and Metabolic Protection in Postmenopausal Women. J Clin Endocrinol Metab. 2005;90:4573–8. doi: 10.1210/jc.2004-1764. [DOI] [PMC free article] [PubMed] [Google Scholar]
- 14.Yim J-E, Heshka S, Albu JB, Heymsfield S, Gallagher D. Femoral-gluteal subcutaneous and intermuscular adipose tissues have independent and opposing relationships with CVD risk. Journal of Applied Physiology. 2008;104:700–7. doi: 10.1152/japplphysiol.01035.2007. [DOI] [PMC free article] [PubMed] [Google Scholar]
- 15.Hernandez TL, Kittelson JM, Law CK, et al. Fat Redistribution Following Suction Lipectomy: Defense of Body Fat and Patterns of Restoration. Obesity. 2011 doi: 10.1038/oby.2011.64. [DOI] [PubMed] [Google Scholar]
- 16.Coleman SR. Structural fat grafts: the ideal filler? Clinics in plastic surgery. 2001;28:111–9. [PubMed] [Google Scholar]
- 17.Okoniewski M, Yates T, Dibben S, Miller C. An annotation infrastructure for the analysis and interpretation of Affymetrix exon array data. Genome Biology. 2007;8:R79. doi: 10.1186/gb-2007-8-5-r79. [DOI] [PMC free article] [PubMed] [Google Scholar]
- 18.Benjamini Y, Hochberg Y. Controlling the false discovery rate: a practical and powerful approach to multiple testing. JSTOR. 1995:289–300. [Google Scholar]
- 19.Jolliffe I. Principal component analysis. 2002 doi: 10.1098/rsta.2015.0202. [DOI] [PMC free article] [PubMed] [Google Scholar]
- 20.Team RDC. R: A language and environment for statistical computing. Foundation for Statistical Computing; Vienna, Austria: 2011. [Google Scholar]
- 21.Arrais J, Fernandes J, Pereira J, Oliveira J. GeneBrowser 2: an application to explore and identify common biological traits in a set of genes. BMC Bioinformatics. 2010;11:389. doi: 10.1186/1471-2105-11-389. [DOI] [PMC free article] [PubMed] [Google Scholar]
- 22.Subramanian A, Tamayo P, Mootha VK, et al. Gene set enrichment analysis: A knowledgebased approach for interpreting genome-wide expression profiles. PNAS. 2005;102:15545–50. doi: 10.1073/pnas.0506580102. [DOI] [PMC free article] [PubMed] [Google Scholar]
- 23.Yudkin JS, Stehouwer CDA, Emeis JJ, Coppack SW. C-Reactive Protein in Healthy Subjects: Associations With Obesity, Insulin Resistance, and Endothelial Dysfunction : A Potential Role for Cytokines Originating From Adipose Tissue? Arterioscler Thromb Vasc Biol. 1999;19:972–8. doi: 10.1161/01.atv.19.4.972. [DOI] [PubMed] [Google Scholar]
- 24.Bruun JM, Lihn AS, Pedersen SB, Richelsen B. Monocyte Chemoattractant Protein-1 Release Is Higher in Visceral than Subcutaneous Human Adipose Tissue (AT): Implication of Macrophages Resident in the AT. J Clin Endocrinol Metab. 2005;90:2282–9. doi: 10.1210/jc.2004-1696. [DOI] [PubMed] [Google Scholar]
- 25.Ibrahim MM. Subcutaneous and visceral adipose tissue: structural and functional differences. Obesity Reviews. 2010;11:11–8. doi: 10.1111/j.1467-789X.2009.00623.x. [DOI] [PubMed] [Google Scholar]
- 26.Xu H, Barnes GT, Yang Q, et al. Chronic inflammation in fat plays a crucial role in the development of obesity-related insulin resistance. The Journal of Clinical Investigation. 2003;112:1821–30. doi: 10.1172/JCI19451. [DOI] [PMC free article] [PubMed] [Google Scholar]
- 27.Weisberg SP, McCann D, Desai M, Rosenbaum M, Leibel RL, Ferrante AW. Obesity is associated with macrophage accumulation in adipose tissue. The Journal of Clinical Investigation. 2003;112:1796–808. doi: 10.1172/JCI19246. [DOI] [PMC free article] [PubMed] [Google Scholar]
- 28.Pou KM, Massaro JM, Hoffmann U, et al. Visceral and Subcutaneous Adipose Tissue Volumes Are Cross-Sectionally Related to Markers of Inflammation and Oxidative Stress: The Framingham Heart Study. Circulation. 2007;116:1234–41. doi: 10.1161/CIRCULATIONAHA.107.710509. [DOI] [PubMed] [Google Scholar]
- 29.Zhang J, Wright W, Bernlohr DA, Cushman SW, Chen X. Alterations of the classic pathway of complement in adipose tissue of obesity and insulin resistance. Am J Physiol Endocrinol Metab. 2007;292:E1433–40. doi: 10.1152/ajpendo.00664.2006. [DOI] [PubMed] [Google Scholar]
- 30.van den Berg RH, Faber-Krol MC, Sim RB, Daha MR. The First Subcomponent of Complement, C1q, Triggers the Production of IL-8, IL-6, and Monocyte Chemoattractant Peptide-1 by Human Umbilical Vein Endothelial Cells. The Journal of Immunology. 1998;161:6924–30. [PubMed] [Google Scholar]
- 31.Festa A, DiAgostino R, Tracy RP, Haffner SM. Elevated levels of acute-phase proteins and plasminogen activator inhibitor-1 predict the development of type 2 diabetes. Diabetes. 2002;51:1131. doi: 10.2337/diabetes.51.4.1131. [DOI] [PubMed] [Google Scholar]
- 32.Bastelica D, Morange P, Berthet B, et al. Stromal Cells Are the Main Plasminogen Activator Inhibitor-1-Producing Cells in Human Fat: Evidence of Differences Between Visceral and Subcutaneous Deposits. Arterioscler Thromb Vasc Biol. 2002;22:173–8. doi: 10.1161/hq0102.101552. [DOI] [PubMed] [Google Scholar]
- 33.Mavri A, Alessi MC, Bastelica D, et al. Subcutaneous abdominal, but not femoral fat expression of plasminogen activator inhibitor-1 (PAI-1) is related to plasma PAI-1 levels and insulin resistance and decreases after weight loss. Diabetologia. 2001;44:2025–31. doi: 10.1007/s001250100007. [DOI] [PubMed] [Google Scholar]
- 34.Flegal KM, Carroll MD, Ogden CL, Curtin LR. Prevalence and Trends in Obesity Among US Adults, 1999–2008. JAMA. 2010;303:235–41. doi: 10.1001/jama.2009.2014. [DOI] [PubMed] [Google Scholar]
Associated Data
This section collects any data citations, data availability statements, or supplementary materials included in this article.


