

Abstract
Inhaled corticosteroids are the most commonly used controller medications prescribed for asthma. Two single-nucleotide polymorphisms (SNPs), rs1876828 in CRHR1 and rs37973 in GLCCI1, have previously been associated with corticosteroid efficacy. We studied data from four existing clinical trials of asthmatics who received inhaled corticosteroids and had lung function measured by forced expiratory volume in one second (FEV1) before and after the period of such treatment. We combined the two SNPs rs37973 and rs1876828 into a predictive test of FEV1 change using a Bayesian model, which identified patients with good or poor steroid response (highest or lowest quartile, respectively) with predictive performance of 65.7% (p = 0.039 vs. random) area under the receiver-operator characteristic curve in the training population and 65.9% (p = 0.025 vs. random) in the test population. These findings show that two genetic variants can be combined into a predictive test that achieves similar accuracy and superior replicability compared with single SNP predictors.
Keywords: Pharmacogenetics, Asthma, Glucocorticoids, Predictive Modeling
INTRODUCTION
Asthma is a widespread disease with over 23 million diagnosed cases in The United States.(1) Inhaled corticosteroids (ICS) are the most commonly prescribed and effective controller medication(2); however, there is growing evidence for inter-individual variability of response to such treatments.(3) Recent studies have identified genetic variants that impact the efficacy of treatments for asthma.(4–5) These suggest the potential to provide personalized treatment plans for individual patients by determining which treatments will be most efficacious through genetic tests. Accordingly, a test for the effectiveness of this medication would be of great use and have widespread applicability. However, such tests have proven difficult to develop.
Two SNPs have demonstrated association with ICS response in asthma patients, rs1876828 in the corticotrophin releasing hormone receptor 1 (CRHR1) gene, and rs37973 in the glucocorticoid induced transcript 1 (GLCCI1) gene. The SNP rs1876828 minor allele (A, 22% frequency in Caucasians) has been associated with increased FEV1 following corticosteroid therapy in Caucasian asthmatics (homozygous minor had FEV1 change 23.7% +/− 9.75 vs. FEV1 change 5.14% +/− 1.31 for homozygous major individuals).(4) This gene has also been implicated in steroid response to other disorders, including ICS response in chronic obstructive pulmonary disorder,(6) glucocorticoid response in leukemia,(7) and the regulation of neurotransmitters in the treatment of depression and anxiety.(8) The SNP rs37973 has major allele A and minor allele G, with a minor allele frequency of 44% in Caucasian populations. In recent work,(5) the presence of the rs37973 minor allele has been associated with poor response to ICS therapy for asthma, where homozygous major individuals had FEV1 change 9.3% +/− 1.1% compared to homozygous minor FEV1 change of 3.2% +/− 1.6%, after adjustment for common covariates (age, sex, and height).
The objective of this study was to determine whether these two previously identified SNPs would together define a genetic test capable of predicting good and poor ICS responders both in the previously studied asthma cohorts and in an additional cohort.
METHODS
Outcome Measurement
Forced expiratory volume in 1 second (FEV1) is a standard measure of lung function and recommended for aiding diagnosis of asthma severity.(9) To measure response to steroid therapy, we studied the change in FEV1 from its first measurement prior to any ICS treatment (termed baseline FEV1), to its measurement after a course of ICS treatment of at least four weeks (subsequent FEV1). We report this as a percent of baseline FEV1: FEV1 Change = [FEV1(baseline) − FEV1(subsequent)] / FEV1(baseline). Recent work suggests this measure is a good candidate for pharmacogenetic study due to high intra-class correlation.(10) However, previous studies also noted this measurement can be dependent on baseline FEV1.(11) To account for the dependence on baseline FEV1, we adjusted FEV1 change using a linear model.
For most analysis herein, we gave attention to the tails of the adjusted FEV1 change distributions; considering only the highest and lowest quartiles. This omits average-case responders in an effort to better classify those patients that are either very good or very poor ICS therapy responders. This is a technique that has proven effective in gene expression(12) and pharmacogenetic datasets.(13)
Subject Populations
To measure the effectiveness of ICS treatment on percent improvement of baseline FEV1, we studied four clinical trials of asthmatics who received ICS, with or without additional therapies. For building and defining the predictive model, we used the Salmeterol or Corticosteroids Study (SOCS)(14) and the Salmeterol +/− Inhaled Corticosteroids (SLIC) trial.(15) For replication we combined data from the Leukotriene Modifier Or Corticosteroid or Corticosteroid-Salmeterol (LOCCS) trial(16) and the IMProving Asthma Control Trial (IMPACT)(17). In each of the trials, patients received daily ICS treatment and measured FEV1 before and after treatment. These are two cohorts that have similar characteristics, shown in Table 1.
Table I. Data Summary for Populations Examined.
Reported are total dataset size, gender percentage, mean age, mean height, and three mean measurements of FEV1: the baseline measurement, the subsequent measurement that is compared to the baseline, and then the percent change from baseline to subsequent measurement.
| Dataset | |||
|---|---|---|---|
| SOCS/SLIC | LOCCS/IMPACT | All Combined | |
| Total (n) | 204 | 215 | 419 |
| Gender (% female) | 63.2% | 63.7% | 63.5% |
| Age (years) | 34.1 (+/− 11.9) | 34.2 (+/− 14.7) | 34.1 (+/− 14.4) |
| * Height (in) | 66.5 (+/− 4.02) | 65.4 (+/− 4.48) | 66.0 (+/− 4.29) |
| * FEV1 baseline (Liters) | 2.68 (+/− 0.73) | 2.86 (+/− 0.78) | 2.77 (+/− 0.76) |
| * FEV1 subsequent (Liters) | 2.82 (+/− 0.76) | 3.06 (+/− 0.78) | 2.95 (+/− 0.78) |
| FEV1 change (%) | 7.32% (+/− 20.2) | 8.23% (+/− 12.2) | 7.79% (+/− 16.5) |
Indicates that the distributional difference between SOCS/SLIC and LOCCS/IMPACT is significant at p < 0.05. Other p-values are nonsignificant (p > 0.05).
SOCS enrolled 164 subjects with moderate persistent asthma and provided 400 micrograms of inhaled triamcinolone for a six-week run-in period prior to randomization. SLIC enrolled 175 patients with moderate asthma who were unresponsive to ICS; these patients shared the six-week initial run-in phase of SOCS, receiving a similar dose of inhaled triamcinolone during this period. Combining SOCS and SLIC we have FEV1 measurements taken before and after receiving six weeks of ICS therapy on a total of 204 Caucasians.
LOCCS is similar to SOCS/SLIC in that it contains many patients with mild to moderately severe asthma given inhaled corticosteroid treatments for a four week run-in period. The LOCCS trial is designed to test the relative effectiveness of fluticasone (an inhaled corticosteroid), montelukast (a leukotriene inhibitor), and a combination of fluticasone/salmeterol (a long-acting beta-agonist). We obtained data from 185 of the patients in LOCCS who had FEV1 measurements at time points at least four weeks apart while receiving a daily or twice-daily inhaled corticosteroid dose.
IMPACT is designed with three arms, with 225 patients randomized to either receive budesonide (an inhaled corticosteroid), zafirlukast (a leukotriene inhibitor), or placebo. We used data from the Caucasian patients who received budesonide, and who had FEV1 measurements before and after at least six weeks of corticosteroid therapy (n = 39). To increase our dataset size, we combined the patients from both LOCCS and IMPACT into one dataset, where we have 215 Caucasians with mild-to-moderate asthma who received an inhaled corticosteroid and measured FEV1 before and after a period of treatment. We used this dataset for replication of our original result obtained in SOCS/SLIC.
The SNP rs37973 was genotyped using Taqman (Applied Biosystems, Foster City, CA) in SOCS/SLIC and LOCCS, where the average completion rate exceeded 98%. The rs1876828 SNP was genotyped using Sequonom (Sequenom, San Diego, CA) in SOCS/SLIC (completion > 96.8%) and LOCCS (completion > 99.6%). In the IMPACT trial, genotype data was obtained from DbGaP (The database of Genotypes and Phenotypes, http://www.ncbi.nlm.nih.gov/gap), where results of Affymetrix 6.0 Array assays are available. Both SNPs are absent on this platform, and accordingly were imputed in IMPACT using the Markov Chain Haplotyping program (MaCH)(18), based on 1000 Human Genomes Project(19) data. We used maximum posterior genotype dosage, called to the nearest genotype, with both SNPs having high-confidence imputation (r2 = .901 for rs1876828 and r2 = .986 for rs37973).
Statistical Analysis
Using Bayes factors, we measured the association of a SNP with change in FEV1. A Bayes factor is a hypothesis test, which evaluates the ratio of the likelihood of the data considering an interaction to the likelihood of the data considering no interaction.(20) We followed equations for Bayes factor formulae for both linear effects and categorical effects using a Gamma distribution prior with parameters (k = 0.5, theta = 2), as described by Sebastiani, Abad, and Ramoni.(21) P-values for distributions of Bayes factors were computed using label permutation.(22)
Conditional Gaussian networks are a type of Bayesian network for combining discrete variables with continuous variables; where the continuous variables have Gaussian distributions that are conditioned on the values of the discrete variables.(23) This is suitable for modeling the linear effect of minor allele dosing of SNPs on FEV1 change. We used the algorithm of Cowell(24) to compute the probability of the class given the values of the SNPs for an unknown individual using a conditional Gaussian Bayesian network. To assess predictive accuracy of a model, we computed area underneath receiver-operator characteristic curve (AUC) convex hulls. We followed prescriptions of Lasko et al.(25) and computed AUC confidence intervals by the asymptotic method.(26)
Computations were done in MATLAB (R2010a), with software written by the present authors.
RESULTS
After genotyping quality control and restricting attention to individuals of Caucasian heritage, SOCS/SLIC had 204 patients with FEV1 measurements who received ICS therapy, and LOCCS/IMPACT had 215. While baseline FEV1 varied from SOCS/SLIC (2.77L +/− 0.73) to LOCCS/IMPACT (2.86L +/− 0.76) significantly (p = 0.012), and subsequent FEV1 displayed a similar difference (2.823L +/− 0.76 vs. 3.06L +/− 0.78; p = 0.0016), the FEV1 change was not significantly different (7.32% +/− 20.2% vs. 8.23% +/− 12.2%; p = 0.57).
Many studies of ICS response, and lung function in general, that measured the FEV1 or FEV1 change in an individual noticed the dependence of FEV1 on certain covariates including height, age, gender, and the baseline FEV1 itself. In each of our datasets we found that height, age, and gender were unrelated to FEV1 change, while FEV1 change did exhibit a great dependence on baseline FEV1 (Table 2). We thus adjusted for baseline FEV1 to avoid regression to the mean (regression coefficient = −.52). The distributions of adjusted FEV1 change stratified by rs37973 and rs1876828 genotype are depicted in Figure 1a (for SOCS/SLIC) and Figure 1b (for LOCCS/IMPACT).
Table II. P-Values for Tests of Correlation with FEV1 Change.
We show p-values here for tests of correlation with FEV1 change in each of the datasets. Only baseline FEV1 is significantly correlated with FEV1 change.
| Height | Age | Gender | Baseline FEV1 | |
|---|---|---|---|---|
| SOCS/SLIC | 0.808 | 0.416 | 0.891 | < 0.001 |
| LOCCS/IMPACT | 0.232 | 0.970 | 0.577 | < 0.001 |
| All datasets combined | 0.276 | 0.576 | 0.836 | < 0.001 |
Figure 1.
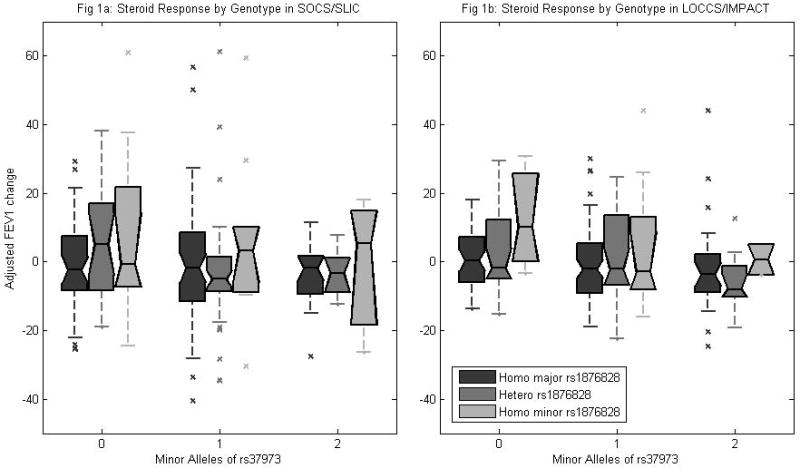
Figure 1a shows summary distribution of FEV1 change per genotype in the SOCS/SLIC population (n = 204). Center mark on each box represents median value, boxes extend to upper and lower quartile boundaries. Outliers plotted as individual marks. Figure 1b shows summary distribution of FEV1 change per genotype in the LOCCS/IMPACT population (n = 215).
The association between steroid response and these two SNPs has been investigated in some of these datasets before: in previous work SOCS/SLIC was used as a secondary replication dataset for rs37973 and LOCCS was used as a tertiary replication where in each case an association was observed that displayed nominal significance (p = 0.03) but would not have passed multiple testing corrections.(5) Similarly, SOCS/SLIC was used as a replication dataset for association of CRHR1 SNPs, where rs1876828 displayed a significant association with steroid response.(4) Neither SNP has been previously tested in the IMPACT dataset. Since the present investigation concerns prediction, not only association, we used the SOCS/SLIC dataset as our discovery (training) dataset and the LOCCS/IMPACT dataset for testing the model. Since the interaction of these two SNPs has not been investigated in any dataset or previous study, the LOCCS/IMPACT dataset represents an important replication of the interaction of these SNPs in a predictive model.
To guide our predictive model selection process, we computed a test of the interactions of the SNPs rs37973 and rs1876828 with baseline FEV1 change using Bayes Factors. This resulted in a significant categorical association of rs1876828 (p < 0.008, permutation test) and a linear (additive) association of rs37973 approaching significance (p < 0.051, permutation test) in the SOCS/SLIC dataset. We therefore assumed a model where rs37973 has a linear effect on the outcome and rs1876828 has a categorical effect. We combined these SNPs into a Bayesian network that can accommodate both linear and categorical effects, known as a Conditional Gaussian Bayesian Network. Bayesian networks are a modeling tool that have been used to predict outcomes in various diseases, including atherosclerosis(27), stroke(28), and bronchodilator response in asthmatics.(13)
We then considered the tails of the adjusted FEV1 change distribution, that is, individuals who were either very good or very poor responders to ICS therapy. This is a strategy that assumes whatever genetic effects may be causing a difference in FEV1 change in response to ICS therapy should be more apparent and easier to identify in the tails of the distribution. Accordingly, we considered only the extreme quartiles, as has been the case in previous studies in pharmacogenetics,(5, 13) using individuals in the highest quartile as positive examples and individuals in the lowest quartile as negative examples for the conditional Gaussian Bayesian network. This results in a smaller effective dataset size (SOCS/SLIC = 103, LOCCS/IMPACT = 109), but one where sample size is traded for increased genetic effect sizes. We computed AUCs as a measure of predictive accuracy. AUC values range from 100% which indicates perfect prediction to 50% which indicates performance indistinguishable from random guessing. Using the conditional Gaussian Bayesian network trained on SOCS/SLIC, we obtained an AUC of 65.7% (95% confidence interval = [54.9%, 76.4%], nonparametric asymptotic method(26); p = 0.039 vs. random, permutation method) in SOCS/SLIC (Figure 2) and AUC of 65.9% (95% confidence interval = [55.5%, 76.3%], p = 0.025 vs. random) in LOCCS/IMPACT. The AUC aggregates different sensitivity-specificity tradeoffs for various parameter settings of the classifier. For example, using a predictive probability cutoff of 0.70, the SOCS/SLIC classifier achieves 56% sensitivity and 57% specificity; in LOCCS/IMPACT 51% sensitivity and 59% specificity.
Figure 2.
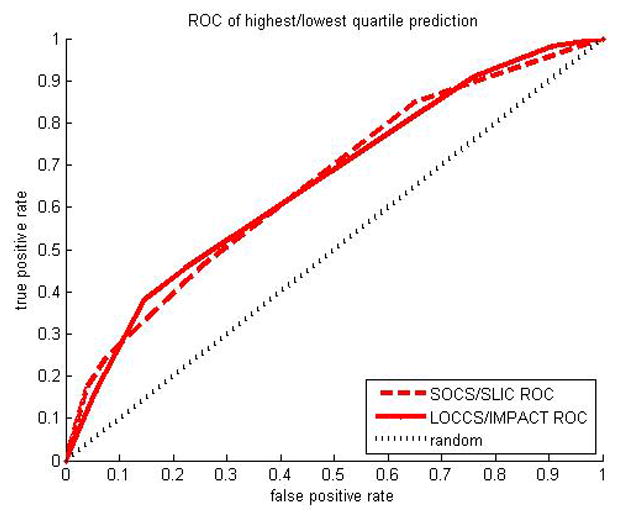
Receiver Operator Characteristic (ROC) curve shown for prediction of highest vs lowest quartile adjusted FEV1 change using Bayesian classifier. Area Under the Curve (AUC) is 65.7% in SOCS/SLIC and 65.9% in LOCCS/IMPACT. The 50% AUC line is shown for a random classifier.
The above constitutes a nominally predictive model of strong and weak inhaled corticosteroid-response in both the SOCS/SLIC cohort and in the LOCCS/IMPACT group, since both models perform significantly better than chance. Because this model integrates the two SNPs in a non-linear way, we give some additional insight into how the model works.
We found that there was a strong effect of rs37973 genotype with FEV1 change quartiles in LOCCS/IMPACT: each copy of the major allele conferred a larger chance of highest-quartile FEV1 change than lowest-quartile FEV1 change, relative to homozygotes of the minor allele (odds ratio 2.42, p = 0.0040, Cochran-Armitage test), a number in excess of that reported previously for this SNP (odds ratio 1.52).(5) The same trend is also significant in SOCS/SLIC, although with a smaller effect-size (odds ratio 1.95, p = 0.029). No significant genotype effects were found for rs1867828.
With big effects for rs37973 genotypes, particularly in LOCCS/IMPACT, we tried predicting FEV1 change with just this one SNP. In this case we predicted reasonably in LOCCS/IMPACT, with AUC of 66% in adjusted FEV1 on highest and lowest quartiles (p = 0.026). Prediction was not significant on extreme quartiles of FEV1 (AUC 63%, p = 0.114) in SOCS/SLIC, indicating that this one-SNP prediction demonstrates less replicability than the two-SNP prediction model.
We noticed that rs1876828 modifies the effect of rs37973 in some genotypes. Specifically, among individuals heterozygous for rs1876828, rs37973 significantly segregated FEV1 change in SOCS/SLIC into highest and lowest quartiles (p = 0.032, exact test), shown in Table 3. In prediction of SOCS/SLIC, rs37973 predicted FEV1 change extreme quartiles with 79.0% AUC (p = 0.027), given rs1876828 heterozygosity. The same trend was observed in LOCCS/IMPACT, but did not reach statistical significance (AUC 70%, p = 0.131). Considering only rs1876828 homozygotes increased the allelic odds ratios for the major allele of rs37973 in SOCS/SLIC for proclivity to highest-quartile FEV1 change vs. lowest-quartile FEV1 change (odds ratio 4.3, p = 0.029); and we observed a slight increase in LOCCS/IMPACT (odds ratio 3.0, p = 0.048; compared with unstratified allelic odds ratio in LOCCS/IMPACT of 2.4, discussed above).
Table IIIa. SOCS/SLIC Steroid Response Extreme Quartiles Stratified by Genotype.
Distribution of high/low FEV1 change is shown according to genotype for both SNPs. P-values are shown for Fisher exact test. The distribution for rs1876828 heterzygotes is significantly skewed with the AA rs37973 genotype being associated with higher FEV1 change and the AG and GG genotypes associated with lower FEV1 change, but this is not observed in homozygotes.
| rs37973 Genotype | rs1876828 Homozygous Minor | rs1876828 Heterozygotes | rs1876828 Homozygous Major | |||
|---|---|---|---|---|---|---|
| Highest FEV1 | Lowest FEV1 | Highest FEV1 | Lowest FEV1 | Highest FEV1 | Lowest FEV1 | |
| AA | 4 | 2 | 9 | 2 | 11 | 9 |
| AG | 3 | 3 | 5 | 9 | 15 | 17 |
| GG | 1 | 1 | 1 | 2 | 3 | 6 |
| p-value (Fisher) | ~1 | 0.032 | 0.89 | |||
While rs37973 showed a strong linear effect in LOCCS/IMPACT and a weaker effect in SOCS/SLIC, to build a model that robustly predicts FEV1 change across datasets, the additional effect modification of rs1876828 was needed. It is this effect modification that is embodied in the conditional Gaussian Bayesian network, and this effect modification that lead to the robust prediction of that model.
DISCUSSION
We found that two genetic variants can be combined into a predictive test that achieves reasonable accuracy and similar replicability. We found that the SNPs, rs37973 in GLCCI1 and rs1876828 in CRHR1, can distinguish individuals who are very good responders to ICS therapy from very poor responders with an accuracy of 65.7% AUC in SOCS/SLIC (p = 0.039) and of 65.9% AUC in LOCCS/IMPACT (p = 0.025). Furthermore, a two-SNP model had replicated accuracy above random in both datasets, while neither SNP alone achieved this (AUC 63%, p = 0.114 for rs37973; and AUC 54%, p ~= 0.9 for rs1876828), owing to the SNPs’ nonlinear interaction.
Because activation of CRHR1 triggers the release of cortisol, it was theorized that decrease in function or expression of CRHR1 would therefore lead to diminished natural steroid levels, and thus patients in this category may exhibit an increased response to administered corticosteroids compared with wildtype patients.(4) Such a simple arrangement was not observed in our present study.
However, it is worth noting that the SNP under investigation here, rs1876828, is in linkage disequilibrium with a major inversion polymorphism on chromosome 17, which measures 900kb and encompasses the entire CRHR1 gene.(29) It has been argued that this inversion itself is the main driver of CRHR1 association with steroid response,(30) although the exact mechanism of this is unknown.
The glucocorticoids induced transcript 1 (GLCCI1), located at chromosome 7p21.3, is comparatively unstudied. The GLCCI1 SNP rs37973 has recently been shown to be associated with steroid response in asthmatics.(5) This study contained functional validation suggesting that rs37973 was an expression-SNP for GLCCI1, where the minor allele at rs37973 was associated with decreases of GLCCI1 expression.(5)
Previous predictive models in asthma include a Bayesian network of bronchodilator response (BDR) to beta-2 agonists.(13) This study built a traditional (in contrast to a conditional Gaussian) Bayesian network of 15 SNPs chosen from a candidate gene study of the Childhood Asthma Management Program, which achieved an AUC of 75% in cross-validation. However, this has not so far been replicated in an independent population. There was also a logistic regression model of BDR that used 8 SNPs to predict poor responders in separate populations,(31) however the parameters of the regression models were trained and tested on each population separately. In contrast, we built and trained the Bayesian network described herein on the SOCS/SLIC dataset and tested it on the LOCCS/IMPACT dataset, providing an independent validation of the model.
Other pharmacogenetic studies have focused not on prediction, but on quantifying the effect size of risk alleles, where there is great variability in genetic effect sizes for different pharmacophenotypes. Some genetic variants have been reported conferring increased irinotecan toxicity with odds ratios of ~28.(32) A study reported a cytochrome P450, family 2, subfamily C, polypeptide 9 (CYP2C9) variant that conferred a 4.2 odds ratio of increased adverse events associated with warfarin treatment.(33) Some variants of the CYP2C9 gene have been reported to effect incidence of side effects in patients taking clopidogrel with odds ratios ~1.5,(34–35) although there has been a more recent report of a variant in the purinergic receptor P2Y, G-protein coupled, 12 (P2RY12) gene with a 4.0 odds ratio.(36) Similarly, the solute carrier organic anion transporter family, member 1B1 (SLCO1B1) gene has variants reported to increase the risk of cardiomyopathy following statin treatment by 4.5.(37) The odds ratios reported in the present study (2.4 and 4.3) are in the range of current warfarin, clopidogrel and statin results.
One potential limitation of our study is that it only predicted membership of high- and low-responders to ICS. In both our testing and training populations, we had (separately) taken the top and bottom quartiles and discarded the rest of the datapoints. While this is an accepted tactic in predictive modeling, it means that our test may not classify individuals with average or middle ICS response. Nevertheless, a test that discriminates very well between high and low responders would be of clinical use. Additionally, our results are dependent on the populations that were used to build the models; these were white adult asthma patients with mild or moderate asthma. The results may not generalize to children or other ethnic groups where the haplotypes and patterns of linkage disequilibrium mean that the rs1876828 SNP may not indicate who has the CRHR1 inversion (for example: a different CRHR1 SNP was implicated for ICS response in a Korean population).(6) It may be that a dearth of homozygous individuals at rs1876828 leads to our unusual nonlinear effect observed in effect modification of rs37973 by rs1876828.
Our predictive model answers the question clinicians have long asked of gene-association studies: given these associated SNPs, what can be done with them? We have shown that even just two SNPs can be combined into a model that achieves predictive accuracy that is statistically better than chance on separate populations. Just as multiple gene pathways can influence asthma pathology, multiple markers of these genes can be combined into increasingly accurate predictors of that pathology, and future studies will undoubtedly combine many more SNPs in increasingly sophisticated models. Our study suggests that there is promise in using multiple SNPs to develop useful predictive tests.
Table IIIb. LOCCS/IMPACT Steroid Response Extreme Quartiles Stratified by Genotype.
Distribution of high/low FEV1 change is shown according to genotype. P-values are shown for Fisher exact test. As in SOCS/SLIC, homozygotic major rs37973 individual show greater steroid response, although this is not statistically significant.
| rs37973 Genotype | rs1876828 Homozygous Minor | rs1876828 Heterozygotes | rs1876828 Homozygous Major | |||
|---|---|---|---|---|---|---|
| Highest FEV1 | Lowest FEV1 | Highest FEV1 | Lowest FEV1 | Highest FEV1 | Lowest FEV1 | |
| AA | 2 | 0 | 7 | 3 | 14 | 7 |
| AG | 2 | 3 | 9 | 7 | 16 | 22 |
| GG | 0 | 0 | 1 | 5 | 4 | 7 |
| p-value (Fisher) | 0.43 | 0.12 | 0.14 | |||
Acknowledgments
This work is supported by: U01 HL65899, P01 HL083069, R01 HL092197, K08 HL088046, and T32 HL007427 from the National Heart, Lung and Blood Institute, National Institutes of Health. We thank the participants, investigators, and administrators of the studies considered herein: SOCS/SLIC, LOCCS, and IMPACT. We thank Barbara Klanderman, Trisha Rodgers, and Liz Bevilacqua for their prior effort in genotyping these SNPs at the Channing Lab.
Footnotes
Conflicts of Interest
Dr. Peters has served as a consultant for AstraZeneca, Aerocrine, Airsonett AB, Delmedica, GlaxoSmithKline, Merck, and TEVA, and is a member of Speakers’ Bureaus sponsored by Integrity Continuing Education and Merck, and is a consultant to the ALA-ACRC’s DCC and was PI of its LOCCS trial. Dr. Lima has received a $75000 research grant from Merck. Drs Chang, McGeachie, Peters, Tantisira, and Wu declare no competing financial interests.
References
- 1.Association AL. Trends in Asthma Morbidity and Mortality. Washington, DC: American Lung Association, Services EaSURaP; 2010. [Google Scholar]
- 2.Expert Panel Report 3 (EPR-3): Guidelines for the Diagnosis and Management of Asthma-Summary Report 2007. J Allergy Clin Immunol. 2007 Nov;120(5 Suppl):S94–138. doi: 10.1016/j.jaci.2007.09.043. [DOI] [PubMed] [Google Scholar]
- 3.Szefler SJ, Martin RJ, King TS, Boushey HA, Cherniack RM, Chinchilli VM, et al. Significant variability in response to inhaled corticosteroids for persistent asthma. J Allergy Clin Immunol. 2002 Mar;109(3):410–8. doi: 10.1067/mai.2002.122635. [DOI] [PubMed] [Google Scholar]
- 4.Tantisira KG, Lake S, Silverman ES, Palmer LJ, Lazarus R, Silverman EK, et al. Corticosteroid pharmacogenetics: association of sequence variants in CRHR1 with improved lung function in asthmatics treated with inhaled corticosteroids. Hum Mol Genet. 2004 Jul 1;13(13):1353–9. doi: 10.1093/hmg/ddh149. [DOI] [PubMed] [Google Scholar]
- 5.Tantisira KG, Lasky-Su J, Harada M, Murphy A, Litonjua AA, Himes BE, et al. Genomewide association between GLCCI1 and response to glucocorticoid therapy in asthma. N Engl J Med. 2011 Sep 29;365(13):1173–83. doi: 10.1056/NEJMoa0911353. [DOI] [PMC free article] [PubMed] [Google Scholar]
- 6.Kim WJ, Sheen SS, Kim TH, Huh JW, Lee JH, Kim EK, et al. Association between CRHR1 polymorphism and improved lung function in response to inhaled corticosteroid in patients with COPD. Respirology. 2009 Mar;14(2):260–3. doi: 10.1111/j.1440-1843.2008.01425.x. [DOI] [PubMed] [Google Scholar]
- 7.Jones TS, Kaste SC, Liu W, Cheng C, Yang W, Tantisira KG, et al. CRHR1 polymorphisms predict bone density in survivors of acute lymphoblastic leukemia. J Clin Oncol. 2008 Jun 20;26(18):3031–7. doi: 10.1200/JCO.2007.14.6399. [DOI] [PubMed] [Google Scholar]
- 8.Licinio J, O’Kirwan F, Irizarry K, Merriman B, Thakur S, Jepson R, et al. Association of a corticotropin-releasing hormone receptor 1 haplotype and antidepressant treatment response in Mexican-Americans. Mol Psychiatry. 2004 Dec;9(12):1075–82. doi: 10.1038/sj.mp.4001587. [DOI] [PubMed] [Google Scholar]
- 9.National Asthma Education and Prevention Program. Expert Panel Report: Guidelines for the Diagnosis and Management of Asthma Update on Selected Topics--2002. J Allergy Clin Immunol. 2002 Nov;110(5 Suppl):S141–219. [PubMed] [Google Scholar]
- 10.Wu AC, Tantisira K, Li L, Schuemann B, Weiss S. Repeatability of response to asthma medications. J Allergy Clin Immunol. 2009 Feb;123(2):385–90. doi: 10.1016/j.jaci.2008.10.015. [DOI] [PMC free article] [PubMed] [Google Scholar]
- 11.Tantisira KG, Fuhlbrigge AL, Tonascia J, Van Natta M, Zeiger RS, Strunk RC, et al. Bronchodilation and bronchoconstriction: predictors of future lung function in childhood asthma. J Allergy Clin Immunol. 2006 Jun;117(6):1264–71. doi: 10.1016/j.jaci.2006.01.050. [DOI] [PubMed] [Google Scholar]
- 12.Liu H, Li J, Wong L. Use of extreme patient samples for outcome prediction from gene expression data. Bioinformatics. 2005 Aug 15;21(16):3377–84. doi: 10.1093/bioinformatics/bti544. [DOI] [PubMed] [Google Scholar]
- 13.Himes BE, Wu AC, Duan QL, Klanderman B, Litonjua AA, Tantisira K, et al. Predicting response to short-acting bronchodilator medication using Bayesian networks. Pharmacogenomics. 2009 Sep;10(9):1393–412. doi: 10.2217/pgs.09.93. [DOI] [PMC free article] [PubMed] [Google Scholar]
- 14.Lazarus SC, Boushey HA, Fahy JV, Chinchilli VM, Lemanske RF, Jr, Sorkness CA, et al. Long-acting beta2-agonist monotherapy vs continued therapy with inhaled corticosteroids in patients with persistent asthma: a randomized controlled trial. JAMA. 2001 May 23–30;285(20):2583–93. doi: 10.1001/jama.285.20.2583. [DOI] [PubMed] [Google Scholar]
- 15.Lemanske RF, Jr, Sorkness CA, Mauger EA, Lazarus SC, Boushey HA, Fahy JV, et al. Inhaled corticosteroid reduction and elimination in patients with persistent asthma receiving salmeterol: a randomized controlled trial. JAMA. 2001 May 23–30;285(20):2594–603. doi: 10.1001/jama.285.20.2594. [DOI] [PubMed] [Google Scholar]
- 16.Peters SP, Anthonisen N, Castro M, Holbrook JT, Irvin CG, Smith LJ, et al. Randomized comparison of strategies for reducing treatment in mild persistent asthma. N Engl J Med. 2007 May 17;356(20):2027–39. doi: 10.1056/NEJMoa070013. [DOI] [PubMed] [Google Scholar]
- 17.Boushey HA, Sorkness CA, King TS, Sullivan SD, Fahy JV, Lazarus SC, et al. Daily versus as-needed corticosteroids for mild persistent asthma. N Engl J Med. 2005 Apr 14;352(15):1519–28. doi: 10.1056/NEJMoa042552. [DOI] [PubMed] [Google Scholar]
- 18.Willer CJ, Sanna S, Jackson AU, Scuteri A, Bonnycastle LL, Clarke R, et al. Newly identified loci that influence lipid concentrations and risk of coronary artery disease. Nat Genet. 2008 Feb;40(2):161–9. doi: 10.1038/ng.76. [DOI] [PMC free article] [PubMed] [Google Scholar]
- 19.A map of human genome variation from population-scale sequencing. Nature. 2010 Oct 28;467(7319):1061–73. doi: 10.1038/nature09534. [DOI] [PMC free article] [PubMed] [Google Scholar]
- 20.Kass RE, Raftery AE. Bayes Factors. Journal of the American Statistical Association. 1995;90(430):773–95. [Google Scholar]
- 21.Sebastiani P, Abad M, Ramoni MF. Bayesian Networks for Genomic Analysis. In: Dougherty ER, Shmulevich I, Chen J, Wang ZJ, editors. Genomic Signal Processing and Statistics. 2005. pp. 281–320. [Google Scholar]
- 22.Good I. The Bayes/Non-Bayes compromise: A brief review. J Amer Stat Assoc. 1992;87:597–606. [Google Scholar]
- 23.Lauritzen SL, Wermuth N. Graphical Models for Association Between Variables, Some of Which are Quantitative and Some Qualitative. Annals of Statistics. 1989;17(1):31–57. [Google Scholar]
- 24.Cowell RG. Local Propagation in Conditional Gaussian Bayesian Networks. Machine Learninig Research. 2005;6:1517–50. [Google Scholar]
- 25.Lasko TA, Bhagwat JG, Zou KH, Ohno-Machado L. The use of receiver operating characteristic curves in biomedical informatics. J Biomed Inform. 2005 Oct;38(5):404–15. doi: 10.1016/j.jbi.2005.02.008. [DOI] [PubMed] [Google Scholar]
- 26.DeLong ER, DeLong DM, Clarke-Pearson DL. Comparing the areas under two or more correlated receiver operating characteristic curves: a nonparametric approach. Biometrics. 1988 Sep;44(3):837–45. [PubMed] [Google Scholar]
- 27.McGeachie M, Ramoni RL, Mychaleckyj JC, Furie KL, Dreyfuss JM, Liu Y, et al. Integrative predictive model of coronary artery calcification in atherosclerosis. Circulation. 2009 Dec 15;120(24):2448–54. doi: 10.1161/CIRCULATIONAHA.109.865501. [DOI] [PMC free article] [PubMed] [Google Scholar]
- 28.Sebastiani P, Ramoni MF, Nolan V, Baldwin CT, Steinberg MH. Genetic dissection and prognostic modeling of overt stroke in sickle cell anemia. Nat Genet. 2005 Apr;37(4):435–40. doi: 10.1038/ng1533. [DOI] [PMC free article] [PubMed] [Google Scholar]
- 29.Stefansson H, Helgason A, Thorleifsson G, Steinthorsdottir V, Masson G, Barnard J, et al. A common inversion under selection in Europeans. Nat Genet. 2005 Feb;37(2):129–37. doi: 10.1038/ng1508. [DOI] [PubMed] [Google Scholar]
- 30.Tantisira KG, Lazarus R, Litonjua AA, Klanderman B, Weiss ST. Chromosome 17: association of a large inversion polymorphism with corticosteroid response in asthma. Pharmacogenet Genomics. 2008 Aug;18(8):733–7. doi: 10.1097/FPC.0b013e3282fe6ebf. [DOI] [PMC free article] [PubMed] [Google Scholar]
- 31.Wu AC, Himes BE, Lasky-Su J, Litonjua A, Li L, Lange C, et al. Development of a Pharmacogenetic Predictive Test in asthma: proof of concept. Pharmacogenet Genomics. 2010 Feb;20(2):86–93. doi: 10.1097/FPC.0b013e32833428d0. [DOI] [PMC free article] [PubMed] [Google Scholar]
- 32.Marsh S, Hoskins JM. Irinotecan pharmacogenomics. Pharmacogenomics. 2010 Jul;11(7):1003–10. doi: 10.2217/pgs.10.95. [DOI] [PMC free article] [PubMed] [Google Scholar]
- 33.Meckley LM, Wittkowsky AK, Rieder MJ, Rettie AE, Veenstra DL. An analysis of the relative effects of VKORC1 and CYP2C9 variants on anticoagulation related outcomes in warfarin-treated patients. Thromb Haemost. 2008 Aug;100(2):229–39. [PubMed] [Google Scholar]
- 34.Meschia JF. Pharmacogenetics and stroke. Stroke. 2009 Nov;40(11):3641–5. doi: 10.1161/STROKEAHA.109.562231. [DOI] [PMC free article] [PubMed] [Google Scholar]
- 35.Mega JL, Close SL, Wiviott SD, Shen L, Hockett RD, Brandt JT, et al. Cytochrome P450 genetic polymorphisms and theresponse to prasugrel: relationship to pharmacokinetic, pharmacodynamic, and clinical outcomes. Circulation. 2009 May 19;119(19):2553–60. doi: 10.1161/CIRCULATIONAHA.109.851949. [DOI] [PubMed] [Google Scholar]
- 36.Ziegler S, Schillinger M, Funk M, Felber K, Exner M, Mlekusch W, et al. Association of a functional polymorphism in the clopidogrel target receptor gene, P2Y12, and the risk for ischemic cerebrovascular events in patients with peripheral artery disease. Stroke. 2005 Jul;36(7):1394–9. doi: 10.1161/01.STR.0000169922.79281.a5. [DOI] [PubMed] [Google Scholar]
- 37.Link E, Parish S, Armitage J, Bowman L, Heath S, Matsuda F, et al. SLCO1B1 variants and statin-induced myopathy--a genomewide study. N Engl J Med. 2008 Aug 21;359(8):789–99. doi: 10.1056/NEJMoa0801936. [DOI] [PubMed] [Google Scholar]