

Abstract
Inadequate feeding and care may contribute to high rates of stunting and underweight among children in rural families in India. This cluster‐randomized trial tested the hypothesis that teaching caregivers appropriate complementary feeding and strategies for how to feed and play responsively through home‐visits would increase children's dietary intake, growth and development compared with home‐visit‐complementary feeding education alone or routine care. Sixty villages in Andhra Pradesh were randomized into three groups of 20 villages with 200 mother–infant dyads in each group. The control group (CG) received routine Integrated Child Development Services (ICDS); the complementary feeding group (CFG) received the ICDS plus the World Health Organization recommendations on breastfeeding and complementary foods; and the responsive complementary feeding and play group (RCF&PG) received the same intervention as the CFG plus skills for responsive feeding and psychosocial stimulation. Both intervention groups received bi‐weekly visits by trained village women. The groups did not differ at 3 months on socioeconomic status, maternal and child nutritional indices, and maternal depression. After controlling for potential confounding factors using the mixed models approach, the 12‐month intervention to the CFG and RCF&PG significantly (P < 0.05) increased median intakes of energy, protein, Vitamin A, calcium (CFG), iron and zinc, reduced stunting [0.19, confidence interval (CI): 0.0–0.4] in the CFG (but not RCF&PG) and increased (P < 0.01) Bayley Mental Development scores (mean = 3.1, CI: 0.8–5.3) in the RCF&PG (but not CFG) compared with CG. Community‐based educational interventions can improve dietary intake, length (CFG) and mental development (RCF&PG) for children under 2 years in food‐secure rural Indian families.
Keywords: feeding methods, responsive complementary feeding, toddler, growth and development
Introduction
India has the highest prevalence of undernutrition in the world, with 48–50% of <5‐year‐olds presenting as malnourished (UNICEF 2009). Higher incomes and better food security do improve nutrition over time, but undernutrition does not simply occur because of food insecurity or low income (World Bank 2006). Inappropriate infant‐feeding and care practices also contribute to malnutrition and behavioural interventions can improve nutrition of infants and toddlers (Imdad et al. 2011).
Dietary surveys in India (NNMB 2006) showed that most rural adults in Andhra Pradesh met their recommended daily intakes for energy and protein, whereas children under 3 years old in the same families did not. Food insecurity for energy and protein at the household level therefore was not the key cause of childhood undernutrition. Factors influencing low‐micronutrient intake because of dietary inadequacy could be inappropriate feeding and care in addition to constraints of availability or affordability at the household level.
Food security is a basic requirement for the success of educational interventions to improve caring practices of infants by providing caregivers the skills and motivation to improve infant diet and engage in responsive feeding (Engle et al. 1999, Bentley et al. 2011; Engle & Pelto 2011). Responsive feeding defined by Black & Aboud (2011) is the ‘reciprocity between child and caregiver’ and is ‘a three‐step process: (1) the child signals requests through motor actions, facial expressions, or vocalizations; (2) the caregiver recognizes the signals and responds promptly in a manner that is emotionally supportive, contingent on the signal, and developmentally appropriate, and (3) the child experiences a predictable response to cues’. Components of responsive feeding that are effective in increasing food intake include responding positively to the child with smiles, eye contact, and encouraging words; feeding the child slowly and patiently with good humour; waiting when the child stops eating and then offering more; and giving finger foods so the child can feed him/herself and staying with the child attentively through the mealtime (PAHO/WHO 2003; Aboud et al. 2009). Food refusal and low appetite are common problems, and responsive feeding that recommends how to feed complementary foods is associated with improved food intake (Dearden et al. 2009). A behaviour‐change intervention in Bangladesh focusing on modelling, stimulation and feeding improved children's nutrition and language development, but not weight (Aboud & Akhter 2011).
Educational interventions can improve infant and young child feeding (Caulfield et al. 1999; Bhutta et al. 2008; Imdad et al. 2011). In a systematic review, Imdad et al. (2011) demonstrated improvements in weight and linear growth of interventions providing either complementary foods or nutritional counselling alone. The mixed results for counselling alone improved when animal‐source foods were also promoted (Imdad et al. 2011). An effectiveness trial promoting adequate and sustainable complementary feeding in India (Bhandari et al. 2004) found encouraging good feeding practices and strengthening existing government services was linked to improved breastfeeding and children's food intake but had no significant effect on physical growth. In Peru, nutrition education alone in health centres resulted in improved nutritional status and reductions in stunting (Penny et al. 2005).
Increasing the quality of mother–child interactions through educational interventions has been shown in multiple studies to increase children's cognitive development both in high‐income countries (Minkovitz et al. 2003; Landry et al. 2006) and in low‐ and middle‐income countries (Rahman et al. 2004; Eshel et al. 2006; Engle et al. 2007; Walker et al. 2011). One of the pathways through which a home‐visit educational intervention might affect children's dietary intake and care practices is through its impact on maternal depression. Symptoms of maternal depression have been linked with poorer child growth and increased morbidity in Pakistan (Rahman et al. 2004). An intervention in Jamaica improved caregiving practices, increased mother–infant interaction and resulted in reduced maternal depression (Baker‐Henningham et al. 2005).
We aimed to determine whether a cluster‐randomized educational intervention focusing on responsive feeding and mother–child interaction, in combination with messages about appropriate breastfeeding and complementary feeding from 3 to 15 months of age, would improve adequacy of dietary intake, iron status, growth and development. The cluster approach to randomization was undertaken because of the education‐based materials used in the intervention, which had the potential to be shared among mothers within the same village and dilute the intervention effects if randomization was undertaken at the individual level. The present study compares outcomes from three groups of mothers who participated in: (1) a combined educational intervention (responsive complementary feeding and mother–child interaction); (2) an education intervention on complementary food and feeding; or in (3) the standard of care – the Integrated Child Development Services (ICDS) programme. This cluster‐randomized intervention trial in rural Andhra Pradesh was an INDO–US Collaborative study [National Institutes of Health (NIH), National Institute of Child Health and Human Development (NICHD), United States and the Indian Council of Medical Research (ICMR), India].
Key messages
-
•
Intervention messages based on formative research are culture‐appropriate and are effective to achieve study goals.
-
•
Educating mothers/caregivers on age and culture‐appropriate complementary foods improves infants and toddler growth.
-
•
Responsive complementary feeding educational intervention and skills to stimulate infants through play to mothers/caregivers improves toddler developmental outcomes.
Materials and methods
The study was approved by the Institutional Ethics Committee of the National Institute of Nutrition, ICMR, Hyderabad, India and the Institutional Review Board of the University of North Carolina, Chapel Hill, USA.
Participants
Sixty villages were selected purposively from three ICDS project areas – the largest multi‐services government programme for maternal and child nutrition, health and development in India. Sets of three villages that matched on population size, maternal literacy and birthrate using the then latest census figures (2001) were grouped together to form strata to allow a stratified random allocation of village clusters across the three arms of the study until there were 20 villages per group. This resulted in a total of 60 villages that provided the required sample of 600 pregnant women in their third trimester of pregnancy, over a period of 6 months. These sets of matched village strata did not share geographical boundaries to prevent the contamination of intervention messages between the three groups. The random allocation using a random number generator (facilitated through a tailor‐made syntax programme in the Statistical Package for the Social Sciences (SPSS), which uses the select cases function) was undertaken by a researcher who was not familiar with the villages or their characteristics other than what could be derived from the 2001 census data. Figure 1 presents a flow chart that identifies the process of selecting clusters and participants for the study.
Figure 1.
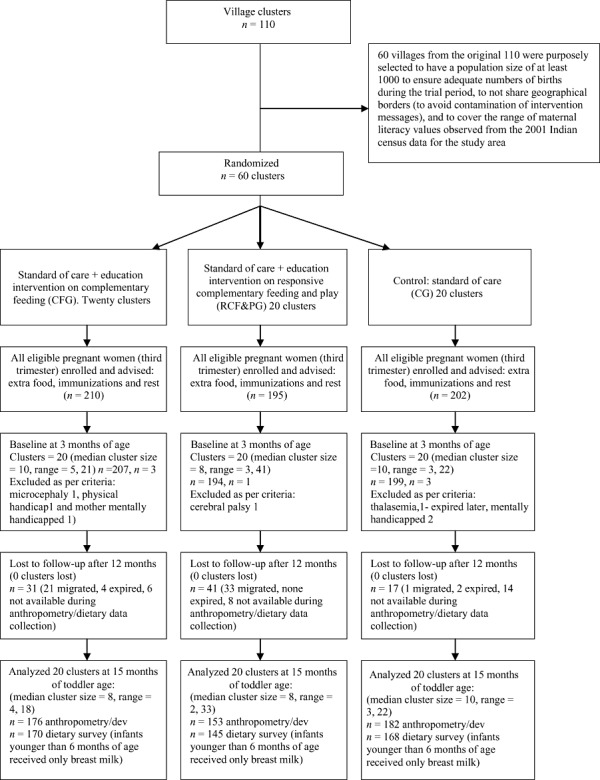
Trial profile. Of the 89 lost to follow‐up, 55 had migrated permanently, 6 expired during the first 12 months and 28 were not at home during multiple attempts at evaluation.
We explained the study objectives to all the pregnant women in the villages and asked if they would like to participate in the study. There were no refusals. The intervention began when infants were 3 months of age because pregnant women in these communities give birth in their natal villages and return home when their infants are about 3 months old. Mothers and infants (3 months of age) were followed for 12 months.
Using the method proposed by Jekel et al. (2001), the sample size for the study (n = 600) was calculated based on an assumption of 20% loss to follow‐up (actual loss to follow‐up was 15%). The required sample size was based on dietary intake, the most difficult of the primary outcomes to measure and therefore requiring the largest sample size. A sample size of 160 per group was estimated with α = 0.05, 80% power and 265 kcals as the standard deviation of energy intake based on the National Nutrition Monitoring Bureau reports (NNMB 2002), to enable the prediction of a mean difference of 100 kcal, considering the intra‐cluster correlation (ICC) of 0.05 to account for clustering. The required sample size was calculated to be 20 clusters of eight individuals (considered to be a realistic average number of births to be recruited from a village). To allow a 20% attrition rate, the required sample size was 200 per group across 20 clusters. As the clusters were villages, it was not anticipated that any whole village would drop out of the study and no allowance was made for such attrition (and this assumption held during the study). There were no good estimates of the likely size of the ICCs from studies in a similar context ahead of the study. Increasing the ICC to 0.10 for the energy intake data resulted in a required sample size of 240 per group across 20 clusters allowing for 20% attrition of individuals. The final study sample size that could be recruited from births occurring in the study area during the available recruitment period met the assumptions for 20% loss to follow‐up for an ICC of 0.05.
Reasons for follow‐up losses during the study were migration (9.2%), house found locked on repeated visits (4.7%) and death of the child (1%). The demographic characteristics of those lost to follow‐up and those who remained were not different (discussed in the Results section).
Study groups comprised:
-
1
Control group (CG): Mothers and infants in this group received only the routine ICDS 1 services, which were operating across all study groups. These services consist mainly of centre‐based supplemental food provided to 1–6‐year‐olds, pregnant and nursing mothers, home‐visit counselling on breastfeeding and complementary feeding, monthly growth monitoring, and non‐formal preschool education for children 3–5 years of age.
-
2
Complementary feeding group (CFG): In addition to the ICDS services, mothers in this group received 11 nutrition education messages on sustained breastfeeding and complementary feeding through twice‐a‐month or four times a month (depending on the age of the infant) home‐visits over 12 months by the trained village women (VW) using flip charts, other visual material, demonstrations and counselling sessions. Age‐appropriate intervention messages and materials used for complementary feeding followed the Pan American Health Organization (PAHO)/World Health Organization (WHO) Guidelines (PAHO/WHO 2003).
-
3
Responsive complementary feeding and play group (RCF&PG): In addition to the ICDS services, mothers in this group received education on complementary feeding as in the CFG (11 messages), eight messages and skills on responsive feeding, and eight developmental stimulation messages using five simple toys. These age‐appropriate messages and skills on how to understand and respond to infants’ cues of hunger/appetite or satiation comprised the responsive feeding intervention (Engle et al. 2000; PAHO/WHO 2003), consistent with some of the responsive feeding messages developed in Guideline #3 of the PAHO/WHO Guidelines (PAHO/WHO 2003) and messages on play and stimulation (Box 1). This group of mothers also received developmentally appropriate toys five times during the intervention with instructions on how to use them to engage and play with their children.
Box 1. Messages in the intervention flip chart used by village workers to deliver the intervention to mothers/caregivers (messages varied by child age)
| Complementary feeding messages (11) | Responsive feeding messages (8) | Developmental stimulation messages (8) |
|---|---|---|
| Continue frequent on demand breastfeeding | Smile and respond to your baby during feeding | Smile and look into your child's eyes |
| Give food of soft, thick consistency | Teach your child to eat patiently and lovingly | Respond to child's sounds, gestures and interests |
| Give pulses daily | Actively help your child to eat | Give time to explore objects/persons/things |
| Give animal foods: egg, milk, meat, liver when you eat them | Respond to cues of hunger, satiety and rejection | Help your child find new things to do with familiar toys |
| Give X (age‐appropriate amount) of food at each meal | Help, but do not physically restrain the child | Play simple games e.g. Peek‐a boo |
| Give dark green/orange vegetables/fruits | Praise, encourage child to eat; give positive comments | Talk to child and give names for things and people |
| Give food three times a day | Response to child refusal is to offer one more bite | Ask your child simple questions |
| Continue feeding during illness; increase during convalescence | Encourage self‐feeding and give child chewable ‘finger‐foods’ to eat | Explain things and show children how to do things |
| Give spoonful of oil or ghee | ||
| Give ICDS fortified food | ||
| Wash your and child's hands before preparing food and feeding |
Complementary feeding group received 11 messages on complementary feeding only. Responsive complementary feeding and play group received all messages given in the Box.
Six months prior to the selection of the sample for the main study, formative research was carried out in four villages from the same district to understand the knowledge and beliefs, motivations and aspirations of mothers/families about infant foods and feeding; number of meals, quantity offered, styles of feeding, child stimulation, and local terms and their usage. Messages and materials were constructed utilizing the formative research and found to be culturally appropriate. The messages regarding food were pre‐tested for ease in understanding and communicating and for feasibility of their adoption, considering local availability and affordability. Messages that addressed appropriate caregiver knowledge, beliefs, and care practices related to infant feeding and stimulation were also selected. Both barriers and facilitating factors were identified before creating messages. For example, the reported practice of giving children only two meals a day was based on the belief that the child would not be able to digest more meals. However, the families ate three meals and some also fed three meals to their older children. Using this information, messages suggesting three meals a day were given with the rationale to motivate adherence: ‘give your child three meals a day; he/she will cry less and play more’. Photographs modelling specific behaviours were produced as part of the formative research and were incorporated into the age‐specific flip charts. Each message was followed by a motivating statement, checking questions (to ensure understanding and intended practices), and reminders.
The messages in the flip chart were communicated to caregivers by high school‐educated VW who were themselves mothers. They received supervised training on how to counsel mothers/caregivers using the pictorial flip charts. The intervention teams (60 VW) were trained to have focused ‘conversations’ with mothers for the various intervention topics. The messages varied by child age. The key intervention messages shown in Box 1 are from the flip charts.
Frequency of home‐visits was the same for the two intervention groups. The first visits were in the fourth month, after the baseline when infants were 3 months old. From 4 to 6 months, mothers were visited twice per month, or 6 visits; from 7 to 9 months, they were visited 4 times a month, or 12 visits; and from 10 to 14 months, they were visited twice a month, or 12 visits, for a total of 30 planned visits. The final assessment was at 15 months of infants’ age.
Trained graduates in nutrition supervised the VW, examined their records of visits and asked mothers independently what they were told in the VWs’ last visit. They also held periodic reinforcement training sessions with VWs. The VWs visiting the CFG and the RCF&PG homes were trained separately with specific flip charts. When mothers were not present during the home‐visits, other family members were given the messages so that new practices could be implemented even in the absence of the mother.
Assessment process and measures
The assessment teams (psychologists and nutritionists) were blinded to the intervention and had no interaction with the VWs. They did not meet as they used different transport and time table of activities. The villages had no identification mark to indicate the group to which they had been randomized. The assessment teams collected data at baseline when infants were 3 months old and subsequently at 6, 9, 12 and 15 months of infants’ age. For all evaluations, a window period of plus or minus 15 days was provided around ages 3, 6, 9, 12 15 months for data collection. This was standard and fixed for logistic reasons. The assessment measures and the child's age when collected are listed later.
-
1
Demographic data on family caste, maternal education and parity, and socio‐economic data including family assets were collected at baseline. Family socio‐economic status was scored using the standard of living index from the National Family Health Survey of India (NFHS‐3, 2007).
-
2
Dietary Intake at 6, 9, 12 and 15 months of infants’ age: A standardized semi‐quantitative Food Frequency Questionnaire was used to assess the frequency of micronutrient‐rich vegetable and animal foods consumed by infants during the previous week. Dietary intake was evaluated by the 24‐h recall method using standard cups with specified volume to help recall the food serving amounts. The Nutritive Value of Indian Foods (Gopalan et al. 1971 revised, 2007) was used for assessing nutrient intakes of each infant. Frequency of breast milk feeds, but not volume, was assessed. Recommended dietary intakes (RDIs) for energy and nutrients from complementary foods for breastfed (assuming average breast milk intake) and non‐breastfed children were used to evaluate dietary intake (WHO 1998; Dewey & Brown 2003).
-
3
Maternal knowledge and beliefs about complementary and responsive feeding at infant ages 6, 9, 12, and 15 months were assessed through pre‐tested questionnaires. The questions were constructed based on the formative research data and the intervention messages.
-
4
Anthropometry: Infants and toddlers were weighed every month using standard Seca electronic weighing scales (Seca, Birmingham, UK) precise to 10 g and calibrated weekly. An infantometer, a portable rigid length board with a head and a sliding foot piece with precision of 0.1 cm, was used to measure supine length of infants every month. All measurement techniques, including maternal height and weight at baseline, followed standard approved procedures (Lohman et al. 1988).
-
5
Bayley Scales of Infant Development‐II (BSID‐II) were administered to toddlers at age 15 months plus or minus a window period of 15 days. The BSID‐II provides motor, mental and total scores (Bayley 1993) using the chronological age at testing for calculating them. Testers were trained and assessed for inter‐tester reliability (94–98%). All procedures outlined in the manual were followed strictly. Raw scores were transformed into index scores based on the reference norms provided. Because the basic comparison was among groups, any cultural bias would be equally distributed across groups.
-
6
Haemoglobin: The heel/finger prick blood was analysed for haemoglobin concentration using cyanmethaemoglobin method at 3 and 15 months of age for infants and mothers (International Committee for Standardization in Haematology 1967). Standard of care for nutritional anaemia was practised according to Indian ICDS (ICDS website http://wcd.nic.in/icds.htm)
-
7
Morbidity data were collected monthly through a recall of the prevalent illness symptoms (fever, diarrhoea, dysentery, acute respiratory infection, etc) suffered by the infant in the previous week. The data was scored on the basis of the presence or the absence of morbidity as 1 or 0. Each of the five symptoms mentioned earlier received a score of 1 if present and scored 1, 2, 3, 4 or 5 as appropriate.
-
8
Maternal depression: The Center for Epidemiological Survey – Depression scale (CES‐D; Radloff 1977) was used to assess maternal symptoms of depression at baseline and 6, 9, 12 and 15 months post‐partum.
Statistical analyses
Data analysis was performed with SPSS, version 15.0 (SPSS Inc., Chicago, IL, USA). All results reported were adjusted for cluster randomization using mixed models for continuous variables. Estimates for categorical variables were produced using generalized estimating equations. Mixed models were used to examine the effects of the intervention on growth, addressing the correlations among repeated measures on the same subject as well as clustering within villages. The primary study outcomes considered were nutrient intake, growth and development measures and secondary outcomes were morbidity, haemoglobin, and maternal knowledge, beliefs and behaviours.
The first step in the analyses compared the intervention groups at baseline adjusting for clustering effects. Analyses of baseline data assessed differences between groups in key outcome variables of child haemoglobin concentration, infant anthropometric measures and breastfeeding status, as well as potential confounding factors including maternal depression status, maternal haemoglobin concentration and anthropometry, birthweight, and socio‐demographic factors. The anthropometric data were examined as raw variables as well as z‐scores using the WHO standards (WHO 2006).
Key outcomes examined post baseline were z‐scores for weight‐for‐age, length‐for‐age and weight‐for‐length between 3, 6, 9, 12 and 15 months of age, weight and length values at 3, 6, 9, 12, and 15 months of age; maternal knowledge and beliefs about complementary and responsive feeding at 6, 9, 12 and 15 months of age; child development (BSID‐II) at 15 months; as well as consumption of various foods and nutrient intakes for energy, protein, iron, zinc, calcium, and vitamin A at 9 and 15 months. Log transformation was performed when the data were skewed. In these analyses, baseline values of the outcome variable (where appropriate), were controlled for morbidity (for analyses of anthropometric variables), child's age and sex, maternal height, birthweight, mother's education and maternal depression at baseline, membership of a scheduled caste/tribe, and standard of living index at follow‐up (15 months of toddler age). Values presented in the text and tables are means ± standard deviation at the individual level and ICCs are presented to quantify the clustering effects. As per the original protocol for the study, the dropouts were excluded from analyses. However, those who were lost to follow‐up were compared with those who were analysed on baseline characteristics. Differences in all analyses were considered significant at P < 0.05.
Results
There were no significant differences among the three groups in any of the baseline characteristics (Table 1). Those who completed the intervention did not differ significantly from those lost to follow‐up in these baseline measures (data not shown).
Table 1.
Baseline comparisons of the three study groups' characteristics
| Variables | *CG | † CFG | ‡ RCF&PG |
|---|---|---|---|
| Males | 50.8 | 48.3 | 49.0 |
| Born at home | 15.1 | 18.9 | 22.2 |
| Mean birthweight (kg) | 2.8 ± 0.49 | 2.9 ± 0.49 | 2.8 ± 0.48 |
| (n = 510) | |||
| % Term births | 84.4 | 88.3 | 86.6 |
| Parity | |||
| 1 | 40.7 | 40.3 | 34.7 |
| 2 | 37.7 | 39.3 | 45.6 |
| ≥3 | 21.6 | 20.4 | 19.7 |
| Weight at 3 months (kg) | 5.5 ± 0.78 | 5.6 ± 0.87 | 5.6 ± 0.74 |
| Length at 3 months (cm) | 58.9 ± 2.45 | 59.0 ± 2.62 | 59.4 ± 2.39 |
| Mean child haemoglobin (g dL–1) at 3 months | 9.0 ± 0.64 | 8.9 ± 0.72 | 9.0 ± 0.78 |
| (n = 578) | |||
| % Breastfed at 6 months | 99.4 | 99.5 | 100 |
| Mean maternal age (years) | 21.9 ± 3.1 | 22.3 ± 3.5 | 22.3 ± 3.4 |
| (n = 596) | |||
| Maternal education | |||
| % Illiterate | 37.4 | 38.9 | 38.2 |
| % Primary school | 34.9 | 35.8 | 29.8 |
| % Secondary or high school | 27.2 | 25.3 | 32.0 |
| % Mothers working | 52.5 | 56.4 | 55.3 |
| Mean standard of living index score | 26.3 ± 7.36 | 25.6 ± 7.36 | 25.3 ± 7.50 |
| Mean maternal weight (kg) | 45.2 ± 6.26 | 45.8 ± 6.70 | 44.9 ± 7.34 |
| Mean maternal height (cm) | 152.1 ± 5.53 | 151.5 ± 5.45 | 150.9 ± 5.63 |
| Mean maternal BMI | 19.5 ± 2.31 | 20.0 ± 2.63 | 19.7 ± 2.72 |
| Mean maternal haemoglobin (g dL–1) | 9.6 ± 1.06 | 9.7 ± 0.92 | 9.7 ± 0.99 |
| (n = 578) | |||
| Mean maternal depression score | 30.8 ± 8.48 | 30.4 ± 8.08 | 30.1 ± 8.35 |
| (n = 589) | |||
| Caste status | |||
| %Scheduled castes | 27.1 | 27.1 | 15.5 |
| % Scheduled tribes | 2.0 | 0.0 | 5.2 |
| % Other backward castes | 62.3 | 66.7 | 66.5 |
| % Other castes (%) | 8.5 | 6.3 | 12.9 |
*Control group (CG): n = 199. †Complementary feeding group (CFG): n = 207. ‡Responsive complementary feeding and play group (RCF&PG): n = 194. Data present mean ± standard deviation and percentages. Means/percentages in rows do not differ significantly (cluster‐adjusted analysis of variance with mixed models and generalized estimating equations).
After 12 months of intervention and consequent attrition (15%), the sample comprised 511 mothers and children with 182 in CG, 176 in CFG and 153 in the RCF&PG. All 60 clusters remained in the study. Loss to follow‐up was greater in the RCF&PG (22%) compared with the CG (9%) and CFG (16%) although this difference was not statistically significant (see Fig. 1 for full details of attrition). ICC ranged from 0.002 (calcium at 15 months) to 0.121 (length at 3 months) with a mean of 0.059 across all of the key outcomes studied. Initial sample size calculations were based on an ICC of up to 0.05. This means that the study was slightly underpowered (76% compared with the desired 80%) for one of the main outcomes; energy intake (this is based on the final average cluster size of 8 across 20 clusters, assuming an ICC of 0.1, which was the maximum ICC observed for energy intake at any of the ages).
Maternal knowledge and beliefs about complementary and responsive feeding
Maternal knowledge and beliefs regarding complementary and responsive feeding were compared among groups at 6, 9, 12 and 15 months of infants’ age. Because infants at 6 months received very little food in addition to breast milk and the 12‐month data were similar to those at 15 months, only the data at 9 and 15 months are compared and shown for clarity (Table 2).
Table 2.
Maternal knowledge and beliefs about complementary and responsive feeding across the three study groups
| Study groups | Age (months) | CG* | CFG † | RCF&PG ‡ |
|---|---|---|---|---|
| Variables | (%) | (%) | (%) | |
| Complementary feeding | ||||
| Minced meat mixed with rice is a good food for an 8‐month‐old | 9 | 40.3 a | 86.6 b | 82.9 b |
| 15 | 55.2 a | 85.2 b | 86.7 b | |
| At 7 months of age, egg is a good nutritious food | 9 | 35.8 a | 74.9 b | 75.5 b |
| 15 | 61.7 a | 87.4 b | 88.0 b | |
| Liver is a good food when infant is 7–8 months old | 9 | 18.8 a | 57.9 b | 63.9 b |
| 15 | 44.0 a | 78.7 b | 76.5 b | |
| At 9 months, needs about three fistfuls of food (muddas) per meal | 9 | 75.3 a | 93.3 b | 97.5 b |
| 15 | 74.9 a | 90.7 b | 92.2 b | |
| A child 9–10 months needs additional snacks as well as three meals | 9 | 79.0 a | 91.5 b | 89.9 b |
| 15 | 83.9 a | 95.1 b | 95.8 b | |
| A 7‐month child will grow well if greens are included in meals | 9 | 17.1 a | 37.1 b | 39.9 b |
| 15 | 30.9 a | 42.6 b | 45.8 b | |
| Responsive feeding | ||||
| It is important to smile and look at the infant's face while feeding | 9 | 96.6 | 97.8 | 97.5 |
| 15 | 94.9 | 100.0 | 97.6 | |
| Teach your child to eat patiently and lovingly | 9 | 98.8 | 100.0 | 97.3 |
| 15 | 99.4 | 99.5 | 98.8 | |
| Actively help your child to eat | 9 | 90.9 | 99.4 | 100.0 |
| 15 | 89.0 | 87.3 | 84.8 | |
| Help the child, but do not physically restrain while feeding | 9 | 14.2 | 7.9 | 13.9 |
| 15 | 89.5 | 92.9 | 89.1 | |
| Praise/encourage child to eat, give positive comments | 9 | 98.8 | 100.0 | 97.3 |
| 15 | 98.8 | 100.0 | 100.0 | |
| Respond to child refusal by waiting and offering one more bite | 9 | 58.6 | 68.7 | 75.8 |
| 15 | 69.1 | 72.2 | 69.9 | |
| Encourage experience with self‐feeding/give finger foods | 9 | 96.0 | 98.3 | 96.9 |
| 15 | 96.6 | 100.0 | 98.8 | |
| Child should be fed more often during illness such as diarrhoea | 9 | 30.3 a | 46.3 b | 46.5 b |
| 15 | 63.4 a | 81.4 b | 85.5 b |
*Control group (CG): n = 176/168 at 9/15 months. †Complementary feeding group (CFG): n = 177/170 at 9/15 months. ‡Responsive complementary feeding and play group (RCF&PG): n = 158/145 at 9/15 months. Data present percentages. Percentages in a row with superscripts without a common letter differ, P < 0.05 (cluster‐adjusted analysis of variance with generalized estimating equations).
Results (Table 2) on knowledge and beliefs related to complementary feeding show that the educational messages to the intervention groups were significantly associated with changed maternal knowledge/beliefs about foods that are good for infants at 9 and 15 months. A higher percentage of mothers/caregivers in the CFG and RCF&PG responded positively on selected appropriate foods to be given to infants compared with those in the CG. The percentage of mothers who had more knowledge regarding recommended foods from animal sources, such as egg and liver, was higher both at 9 and 15 months in the intervention groups but this was not seen in the CG.
Results on maternal responsive feeding knowledge and beliefs (Table 2) indicate a high percentage (90–100%) of positive responses of mothers/caregivers across all the groups on five of the eight questions. This means that there is little variation in knowledge for these questions between the groups even after intervention. The only responsive feeding knowledge and beliefs variable for which both intervention groups were reporting significantly more than the CG was related to the intervention groups being more likely to recommend that a child be fed more often during illness than the CG at both age 9 and 15 months.
Dietary intake
In addition to consuming complementary foods, 99% and 95% of infants at 9 and 15 months, respectively were being breastfed in all three groups. The frequency of foods offered to infants (days per week) across the three groups at 9 and 15 months of age is given in Table 3.
Table 3.
Percentage of children consuming different foods and frequency (median days per week) of consumption in the three groups by 9‐ and 15‐month‐old infants
| Foods/study groups | % Infants | |||
|---|---|---|---|---|
| Groups | Age (months) | Median number of days per week | ||
| 9 | 15 | |||
| Rice | *CG | 81.8 a | 94.9 a | 7 (7, 7) |
| † CFG | 96.1 b | 99.5 b | 7 (7, 7) | |
| ‡ RCF&PG | 93.8 b | 99.4 b | 7 (7, 7) | |
| Goat/chicken liver | CG | 2.3 a | 13.1 a | 0 (0, 1) |
| CFG | 30.7 b | 38.0 b | 0 (0, 1) | |
| RCF&PG | 25.6 b | 33.7 b | 0 (0, 1) | |
| Goat meat | CG | 4.5 a | 33.0 | 0 (0, 1) |
| CFG | 22.3 b | 43.5 | 10 (0, 2) | |
| RCF&PG | 11.3 c | 44.0 | 10 (0, 2) | |
| Poultry | CG | 1.7 | 18.9 a | 0 (0, 1) |
| CFG | 4.5 | 37.5 b | 0 (0, 1) | |
| RCF&PG | 4.4 | 45.2 b | 0 (0, 1) | |
| Banana | CG | 38.6 a | 61.9 a | 1 (0, 2) |
| CFG | 60.9 b | 79.3 b | 2 (1, 3) | |
| RCF&PG | 59.4 b | 78.3 b | 2 (1, 3) | |
| Buffalo milk | CG | 100 | 72.7 | 7 (0, 7) |
| CFG | 98.6 | 81.5 | 7 (5, 7) | |
| RCF&PG | 99.2 | 78.9 | 7 (4, 7) | |
| Egg | CG | 17.6 a | 54.0 a | 1 (0, 2) |
| CFG | 55.3 b | 73.9 b | 1 (0, 2) | |
| RCF&PG | 51.9 b | 77.7 b | 1 (1, 2) | |
| Spinach | CG | 5.1 a | 29.5 a | 0 (0, 1) |
| CFG | 20.1 b | 42.4 b | 0 (0, 1) | |
| RCF&PG | 14.4 b | 45.2 b | 0 (0, 1) | |
| Pulses | CG | 98.3 | 71.6 a | 7 (7, 7) |
| CFG | 98.6 | 89.7 b | 7 (7, 7) | |
| RCF&PG | 100 | 86.7 b | 7 (7, 7) | |
| Added fat | CG | 24.4 a | 29.5 a | 0 (0, 2) |
| CFG | 51.4 b | 42.4 b | 0 (0, 2) | |
| RCF&PG | 44.4 b | 52.4 b | 1 (0, 3) | |
*Control group (CG): n = 176/168 at 9/15 months. †Complementary feeding group (CFG): n = 177/170 at 9/15 months. ‡Responsive complementary feeding and play group (RCF&PG): n = 158/145 at 9/15 months. Data present percentages. Percentages in a column with superscripts without a common letter differ, P < 0.05 (cluster‐adjusted analysis of variance with generalized estimating equations). Figures in parenthesis are inter‐quartile ranges.
The percentage of children consuming different foods and frequency (median days per week) of consumption at 9 months showed significant group differences. Significantly lower proportions of CG children were being fed all foods examined except for buffalo milk, which was consumed by almost 100% of children across all groups and daily (Table 3). Significantly fewer infants in the CG were fed rice, liver, goat meat, banana, egg, spinach and added fat than the two intervention groups. Among the CFG and RCF&PG, the percentage of infants receiving different categories of foods was not significantly different except for the percentage receiving meat, which was significantly lower in the RCF&PG. Despite the intervention, across all groups, liver, goat meat, poultry and greens were fed to less than 30% of infants and eggs and added fat to about 50% and with a median frequency of only 1–2 times a week or less. Only rice, milk and pulses were regularly fed to the majority of infants. Table 3 also gives the inter‐quartile range (IQR) (in parenthesis) at the twenty‐fifth and seventy‐fifth percentile (median number of times per day) consumption of different foods in the previous week at 15 months.
The percentage consuming the foods offered at 15 months were similar to those at 9 months with a significantly lower percentage of toddlers in the CG being fed these foods including rice, liver, poultry, eggs, spinach, pulses, added fat and bananas compared with toddlers in the two intervention groups. At 15 months there were no significant differences in foods fed between the two intervention groups. However, less than 50% of toddlers were fed liver, meat, poultry, spinach and added fat, and frequency of giving these foods remained low. Foods offered by a majority of families, regardless of study groups, were rice, milk and pulses.
The median nutrient intakes with the twenty‐fifth and seventy‐fifth percentile values (IQR) in parenthesis are given in Table 4. The median nutrient intakes were significantly higher among children in the CFG and RCF&PG compared with the CG for energy, protein vitamin A, iron (15 months only) and zinc. Calcium was significantly higher in the two intervention groups at 9 months compared with the CG. At 15 months, calcium intake by the CFG was significantly higher compared with the CG. Even though the CFG and RCF&PG had significantly higher levels of micronutrient intake compared with the CG, these were well below the RDIs (Table 4) for all the micronutrients except calcium at 9 months. Energy and protein intakes of infants and toddlers were comparable with the RDIs for complementary foods for breastfed children (Dewey & Brown 2003) irrespective of the study groups (Table 4).
Table 4.
Dietary intake of energy and nutrients in the three study groups by 9 and 15 months old
| Nutrients | Age (months) | 9 | 15 | |||
|---|---|---|---|---|---|---|
| *CG | † CFG | ‡ RCF&PG | *CG | † CFG | ‡ RCF&PG | |
| RDI kcal = 310 | RDI kcal = 550 | |||||
| Energy (kcal) | 209 a | 348 b | 331 b | 460 a | 569 b | 569 b |
| (122, 338) | (229, 540) | (239, 516) | (429, 489) | (539, 618) | (528, 607) | |
| RDI g = 3.1 | RDI g = 5.5 | |||||
| Protein (g) | 5.0 a | 5.0 a | 8.3 b | 8.0 b | 10.4 a | 13.1 b 12.6 b |
| (3, 8) | (5, 13) | (5, 12) | (10, 12) | (12, 15) | (11, 14) | |
| RDI µg = 92 | RDI µg = 126 | |||||
| Vitamin A (µg) | 16 a | 37 b | 36 b | 61.1 a | 84.2 b | 69.6 b |
| (0.5, 45.3) | (13, 84) | (13, 73) | (49, 74) | (69, 99) | (54, 88) | |
| RDI mg = 98 | RDI mg = 346 | |||||
| Calcium (mg) | 77 a | 127 b | 127 b | 210 a | 245 b | 231 ab |
| (14, 177) | (44, 245) | (44, 235) | (173, 272) | (196, 311) | (178, 289) | |
| RDI mg = 9.1 | RDI mg = 5.6 | |||||
| Iron (mg) | 0.6 | 0.9 | 0.8 | 1.29 a | 1.72 b | 1.59 b |
| (0.2, 1.3) | (0.5, 1.5) | (0.6, 1.3) | (1.2, 1.4) | (1.6, 1.8) | (1.4, 1.7) | |
| RDI mg = 2.3 | RDI mg = 2.3 | |||||
| Zinc (mg) | 0.4 a | 0.7 b | 0.8 b | 0.76 a | 1.04 b | 1.05 b |
| (0.0, 0.7) | (0.4, 1.2) | (0.5, 1.0) | (0.7, 0.8) | (1.0, 1.1) | (1.0, 1.1) | |
RDI, recommended dietary intakes. *Control group (CG): n = 176/168 at 9/15 months. †Complementary feeding group (CFG): n = 177/170 at 9/15 months. ‡Responsive complementary feeding and play group (RCF&PG): n = 158/145 at 9/15 months. Data present medians. Figures in parenthesis indicate the twenty‐fifth and seventy‐fifth percentile values for each group. Medians in a row with superscripts without a common letter differ at 9 and 15 months, P < 0.05 (cluster‐adjusted analysis of covariance). Data present adjusted (standard of living index, birthweight, maternal height, maternal depression score at 3 months, maternal education, scheduled caste/tribe) using mixed models. RDIs based on Dewey and Brown 2003, WHO (1998) for complementary foods for breastfed children.
In the mixed model, controlling for maternal height, birthweight, scheduled caste/tribe, standard of living index, maternal education and baseline depression score, the CFG and RCF&PG continued to have significantly higher mean intakes of energy [β = 105, standard error (SE) = 30.2, β = 107, SE = 29.1, respectively], protein (β = 2.6, SE = 0.79; β = 2.1, SE = 0.82, respectively), iron (β = 0.3, SE = 0.15, β = 0.4, SE = 0.15, respectively), vitamin A intakes (log transformed) (β = 0.19, SE = 0.060, β = 0.13, SE = 0.063, respectively) and zinc (β = 0.20, SE = 0.07; β = 0.30, SE = 0.07, respectively) compared with the CG at 15 months. However, in these adjusted analyses, the CFG but not RCF&PG, was significantly different in calcium intake (log transformed) (β = 0.14, SE = 0.053) when compared with the CG at 15 months. Energy intake among the CFG and RCF&PG was similar to the RDI. Children's protein intake in the intervention groups and the CG all exceeded the RDI.
Growth
The baseline mean z‐scores for length (CG: −0.72, CI: −0.97 to −0.46, CFG: −0.61, CI: −0.85 to −0.36, RCF&PG: −0.59, CI: −0.85 to −0.33) and weight (CG: −0.82, CI: −1.04 to −0.59, CFG: −0.62, CI: −0.83 to −0.40, RCF&PG: −0.79, CI: −1.02 to −0.56) were similar across the three groups. There were no statistically significant mean differences for weight and length among the three groups at 3, 6, 9, 12 and 15 months of infant ages. After adjusting for potentially confounding factors, including morbidity, there were no significant differences among the three groups in mean length and weight at 15 months of age (Table 5).
Table 5.
Mean length and weight of infants/toddlers at ages 3, 6, 9, 12 and 15 months across the three groups
| Age (months) | Difference | |||||
|---|---|---|---|---|---|---|
| 3 | 6 | 9 | 12 | 15 | ||
| Length | ||||||
| CG | 58.9 ± 2.45 | 64.2 ± 2.33 | 68.0 ± 2.48 | 70.9 ± 2.58 | 73.9 ± 2.76 | 14.9 ± 2.56 |
| (n) | 199 | 183 | 187 | 187 | 182 | |
| CFG | 59.0 ± 2.62 | 64.4 ± 2.49 | 68.3 ± 2.48 | 71.4 ± 2.50 | 74.4 ± 2.51 | 15.4 ± 2.52 |
| (n) | 207 | 194 | 186 | 188 | 176 | |
| RCF&PG | 59.4 ± 2.39 | 64.2 ± 2.31 | 68.0 ± 2.31 | 71.0 ± 2.39 | 74.2 ± 2.51 | 15.2 ± 2.60 |
| (n) | 194 | 183 | 175 | 168 | 153 | |
| P value | 0.548 | 0.670 | 0.598 | 0.268 | 0.223 | 0.175 |
| Weight | ||||||
| CG | 5.5 ± 0.78 | 6.8 ± 0.9 | 7.4 ± ± 0.94 | 8.0 ± 1.04 | 8.6 ± 1.09 | 3.2 ± 0.82 |
| CFG | 5.6 ± 0.87 | 6.9 ± 0.92 | 7.6 ± 0.94 | 8.1 ± 0.96 | 8.7 ± 0.95 | 3.0 ± 0.76 |
| RCF&PG | 5.6 ± 0.74 | 6.8 ± 0.87 | 7.4 ± 0.91 | 8.0 ± 0.91 | 8.5 ± ± 0.95 | 3.0 ± 0.75 |
| P value | 0.633 | 0.550 | 0.616 | 0.379 | 0.066 | 0.052 |
CG, control group; CFG, complementary feeding group; RCF&PG, responsive complementary feeding and play group. Data present means ± standard deviation. Means in a column do not differ significantly for any of the measures at all ages of assessment (cluster‐adjusted analysis of covariance). Data present adjusted (standard of living index, birthweight, maternal height, maternal depression score at 3 months, maternal education, scheduled caste/tribe) using mixed models. The n applies to length as well as weight across ages in the three groups.
Growth in length and weight over 1 year of intervention was similar across groups. Regarding stunting, there was no significant difference among groups. Stunting was 37% in the CG, 28% in the CFG and 36% in the RCF&PG.
After adjusting for the baseline length‐for‐age z‐score, maternal height, birthweight, morbidity, scheduled caste/tribe, maternal education, maternal depression score at 3 months, and the standard of living index, intervention group was associated with significant differences in the change in length‐for‐age z‐scores between 3 and 15 months of age (β = 0.19, SE = 0.09) for CFG children compared with the CG, but there was no significant difference between RCF&PG (β = 0.10, SE = 0.10) and the CG. The model explained 43% of the variation in the change in length‐for‐age. No significant differences in change in weight‐for‐age or weight‐for‐length z‐scores were observed between the control and intervention groups between 3 and 15 months of age in either unadjusted or adjusted analyses.
Haemoglobin
There was a significant increment (mean ± SE) in haemoglobin concentration over 12 months of intervention equalling 0.3 ± 0.066 g dL–1 among the intervened groups compared with 0.08 ± 0.065 g dL–1 among the CG. The mean and SE of haemoglobin of the two intervention groups (CFG = 9.3 ± 0.06; RCF&PG = 9.3 ± 0.07) was significantly (P < 0.05) greater compared with the CG (9.0 ± 0.07) at 15 months. The two intervention groups (CFG and RCF&PG) were not significantly different from each other.
Morbidity
There were no significant differences in mean morbidity score by groups at 3 and 12 months of age. However, there were significant group differences at 15 months in mean number of morbidities, with the CG having a higher mean morbidity score (1.76 ± 0.10 SE) compared with the CFG (0.90 ± 0.08 SE) and the RCF&PG (0.99 ± 0.09 SE) (P < 0.001), which did not differ from each other.
Child development
The mean mental development scores were significantly different among the groups both without (data not shown) and with controlling for the confounding factors (standard of living index, birthweight, maternal height, maternal depression score at 3 months, maternal education, scheduled caste/tribe; (F 2, 38.5) = 3.77, P = 0. 032; Table 6). CFG children had greater mean scores (β = 1.6, SE = 1.07) than CG children, but this difference was not statistically significant. Multiple regression analyses showed that mental index scores were significantly higher (β = 3.1, SE = 1.12) among RCF&PG children compared with the CG. There were no significant differences in the motor development index among the three groups in either unadjusted or adjusted analyses (Table 6).
Table 6.
Motor and mental development scores of children in the three study groups at 15 months
| Groups | Motor development | Mental development |
|---|---|---|
| *CG | 114.3 ± 14.3 | 104.4 ± 8.6 a |
| † CFG | 115.7 ± 14.1 | 105.6 ± 8.4 ab |
| ‡ RCG&PG | 116.7 ± 14.2 | 107.4 ± 8.1 b |
*Control group (CG): n = 182. †Complementary feeding group (CFG): n = 176. ‡Responsive complementary feeding and play group (RCF&PG): n = 153. Data (mean ± standard deviation) present adjusted (standard of living index, birthweight, maternal height, maternal depression score at 3 months, maternal education, scheduled caste/tribe) regression equation. Means in a column with superscripts without a common letter differ, P < 0.05 (cluster‐adjusted analysis of covariance with mixed model).
Discussion
The present efficacy trial used home‐visits by trained VW to deliver a complementary feeding, responsive complementary feeding and child development educational intervention to mothers/caregivers of infants and toddlers 3–15 months of age. The intervention significantly improved complementary feeding and nutrient intake of infants, but nutrient intakes were still well below the RDIs for all nutrients except energy and protein. Growth improvements were seen in the CFG children only. Children in the two intervention groups were significantly more likely to improve their iron status over the study period. Mental development scores, but not motor, were significantly better in the RCF&PG group.
One of the selection criteria used to include villages into the study was population size and only larger villages were selected and randomized. Therefore, the results might not be applicable to smaller villages that were not selected because they would not produce sufficient births to meet the statistical power requirements of the study. Furthermore, the slightly larger than anticipated ICC values for dietary intake mean that for this outcome, the study had less than optimal power to detect differences at the hypothesized 100 Kcal level. Despite this lack of power, the study did observe statistically significant differences among the groups in this outcome.
Local food recipes that used protein and micronutrient‐rich foods were promoted from 6 to 15 months of infants’ age. This study used formative research to develop intervention messages in order to achieve behavioural change towards improving the outcome measures. Messages developed in a culturally sensitive way have greater potential for adoption (Dewey & Adu‐Afarwuah 2008).
Complementary feeding messages delivered through home‐visits were effective in changing knowledge and behaviours among mothers/caregivers in both intervention groups at 6 and 12 months of intervention. Both intervention groups showed significant improvement in food intake and, for the CFG group, improvements in linear growth (CFG).
On the other hand, few differences were found in responsive feeding beliefs and attitudes. Formative data, based on in‐depth interviews and observations, strongly supported the need for improved responsive feeding behaviours. However, there was almost 100% agreement for 5 of the 8 responsive feeding knowledge and beliefs questions, suggesting that all of the mothers already held such beliefs before the intervention or that the survey items were insufficiently sensitive to elicit differences in the responses. The only question that differed by group was feeding during illness. It appears that these rural Indian mothers understood that responsive feeding practices were advisable, although additional observational research is needed to determine whether they were actually practising these behaviours.
Continued breastfeeding of children up to 2–3 years is culturally the norm in these rural communities, and more than 95% of mothers were still breastfeeding at the end of the study when the children were 15 months of age. Although micronutrients remained deficient across groups, dietary intakes for energy and protein increased significantly in both intervention groups compared with the control (at 15 months, energy was 460 kcals in the CG vs. 569 kcals among CFG and RCF&PG; protein was 10.4 g in the CG vs. 13.1 g and 12.6 g in the CFG and RCF&PG, respectively), and although these were adequate according to the RDI (energy 550 kcals and protein 5.5 g for breastfed children), they did not, per se, result in adequate growth.
Our results confirmed that the household ‘food security’ that had previously been reported in this rural region of Andhra Pradesh (NNMB 2002) was for macronutrients, rather than micronutrients, as intakes by infants were much below the RDIs for all micronutrients even in the intervention groups. Foods eaten routinely were rice, buffalo milk, lentil soup and buttermilk, with very low quantities of animal‐source foods other than buffalo milk, especially meats, liver and fruits. At 6 months (data not shown here), very small quantities of food were consumed and children were predominantly breastfed, despite intervention messages encouraging the introduction of complementary foods from 6 months. Significant differences in nutrient intakes at 9 and 15 months between intervention and CGs after 6 and 12 months of educational intervention indicated that change in knowledge had a positive effect on complementary feeding practices. However, less than half of the mothers implemented the recommendations for the more expensive micronutrient‐rich foods. Although improvement in haemoglobin was greater in the intervention groups compared with the CG, the actual increase was small. Education to mothers on animal foods, especially liver and minced goat meat was being practised by some mothers (23–44%) in the intervened groups. The quantities were very small because mothers had to be convinced to offer animal food to infants as young as 9–15 months, counter to normative infant‐feeding beliefs. Some mothers did start to feed these foods, but only in small quantities; families procured and consumed animal food (mostly goat meat), once a week and so it was only once a week that they also offered it to their infants. Affordability also appeared to be a limiting factor. Therefore, low availability of micronutrient‐rich foods in interior rural villages and lack of resources could be constraints for adherence. Alternatively, maternal perceptions about the quantities suggested may have influenced amounts offered or consumed.
Studies with varying methodologies have attempted to improve dietary intake and growth, through education as well as food supplementation. In one Indian study, an educational intervention reinforcing the existing governmental programme improved dietary intakes but had no impact on growth (Bhandari et al. 2004). In another study in China, educating mothers improved their knowledge, and also infant dietary intake and growth, as well as reducing prevalence of anaemia (Guldan et al. 2000). In Peru, dietary intake and growth were improved via similar interventions to those used here (Penny et al. 2005). The RCF&PG in the present study contained components of complementary and responsive feeding plus a focus on play/interaction and was envisaged to show the best results on the three outcomes. The modest but significantly lower prevalence of stunting among the CFG, but not RCF&PG children at 15 months of age, after controlling for potential confounding factors (maternal height, education, depression, caste, birthweight and family standard of living index), indicated no added (or even the same) benefit of the combined complementary food, responsive complementary feeding and play intervention on reducing stunting or other growth indices compared with the CFG group. However, the intervention improved dietary intakes in line with the study by Bhandari et al. (2004).
The overall effect of the intervention on growth could be accounted for, in part, by reduced morbidity. The mean morbidity scores (0.9–0.99) were not different between the intervention groups but were greater in the CG (1.7). The impact of higher morbidity might be a factor in the significantly higher prevalence of stunting in infants in the CG group at 15 months of age.
To better understand our results, we re‐examined differences among groups in their population characteristics and intervention. Although there were no obvious baseline differences across groups, we found that the randomization of villages to the two types of intervention did not identify subtle village‐level socioeconomic differences, despite matching of villages on available census variables such as maternal literacy. An important difference observed regarding the villages comprising the RCF&PG (5.2%) was that there were more tribal families (Table 1) in this group compared with villages comprising the CG (2.0%) and there were no tribal families in the villages comprising the CFG. The loss to follow‐up was also highest in the RCF&PG group. Tribal populations in India are known to be relatively more deprived than the scheduled castes (NNMB 2000). These observations suggest that future analyses should consider these two groups separately as the tribal group appeared to be more marginalized and faces larger challenges for improving infant growth. Although the loss to follow‐up was highest in the RCF&PG, analyses comparing those who completed the study vs. those who were lost to follow‐up showed no significant differences in the characteristics measured at baseline, suggesting that loss to follow‐up was fairly random. Furthermore, the level of loss to follow‐up was within the limits set a priori for the study for estimates of the required sample size. It is therefore likely that the loss to follow‐up did not significantly influence the overall results of the study.
Another possible interpretation is that the RCF&PG simply received too much information (27 messages in 30 home‐visits) – too many behaviour‐change messages – compared with the CFG (11 messages in 30 home‐visits). It is possible that the number of messages, combined with constraints on available time at their disposal, could have limited the mothers’/caregivers’ ability to practise all that the messages recommended. Because the RCF&PG group showed greater effects on mental development, they may have responded more to messages on child stimulation than child feeding. The findings of Aboud & Akhter (2011) also underline that a behaviour‐change programme focused on modelling and practice in stimulation and feeding improved children's language development. Micronutrient fortification of food improved children's weight but not length (Aboud & Akhter 2011). There is an important need for future work, particularly in settings with food insecurity, to identify the best ways to integrate complementary feeding, responsive feeding, and child development messages in ways that are understood and that achieve behaviour change.
Children's cognitive development at 15 months was significantly greater in the RCF&PG than in the CG, but the controls did not differ from the CFG. The overall score for the Psychomotor Index was higher than that for the Mental Development Index (MDI). The higher mean score for motor than mental scores is consistent with other studies (Pomerleau et al. 1994, Vierhaus et al. 2011) suggesting that scores tend to be lower for mental than for motor items in disadvantaged populations, and therefore the number of children in the upper range of the MDI is more limited.
The finding that a stimulation intervention affects only mental, and not motor development, is fairly common (Imdad et al. 2011). It is possible that the messages on psychosocial stimulation through enhanced caregiver–infant play matched the motivations and aspirations of mothers and caregivers for future school achievement for their children. This motivation was frequently observed during the formative research and was incorporated into our messaging. Caregivers/mothers in the RCF&PG were shown how to use toys in more complex ways according to the developmental level of their growing child with motivational messages that these activities would help children learn skills useful for later‐school achievement. Previous studies also found that developmental stimulation at a young age improved mental scores, and long‐term cognitive ability despite concurrent undernutrition (Grantham‐McGregor et al. 1991; Walker et al. 2004). Mothers and caregivers in the RCF&PG possibly found play messages more feasible and satisfying as they could play with their infants at any time, unlike during feeding when mothers were concerned about their child eating enough.
The provision of five simple toys and instructions on how to use them in play with their infants also made it possible for mothers to follow through on the messages given because resources (availability of toys) were not a constraint in the same way as the availability of micronutrient‐rich foods in the diet (which were not provided) for the complementary feeding messages. Using toys to play with their young children with the motivation that this would be helpful for later‐school achievement did result in improvement in the mental development scores of toddlers.
Conclusion
Complementary feeding messages to mothers and caregivers based on an understanding of their existing macronutrient food security but low‐micronutrient food security can increase dietary intake of energy, protein (and marginally for vitamin A, calcium iron and zinc), and modestly reverse the decline in linear growth rate among children over a 12‐month intervention with twice‐a‐month home‐visiting.
The intervention resulted in improved macronutrient intake in both intervention groups without giving additional supplemental food, but micronutrient deficiencies persisted. These findings highlight the importance and use of food security data to target interventions based on availability of both macro and micronutrient‐rich foods. Further work is needed to test additional strategies to achieve behavioural change for improving dietary diversity and increased quantities of locally available foods, particularly animal‐source foods, in this age group. Micronutrient fortification/supplementation, however, might be more effective and scalable.
The added benefit of responsive complementary feeding and developmental stimulation was seen in higher nutrient intake compared with the CG and higher mental development scores among the RCF&PG than in both the CG and the CFG, but no advantage was seen for improvements in growth. This study demonstrated that mental development scores can be improved with a very low‐cost education intervention strategy, even in the absence of improvements to growth. Such findings have important implications for helping undernourished children from rural communities in India to start school at appropriate developmental levels for their age.
Sources of funding
Indian Council of Medical Research, India and the NIH/NICHD (5 R01 HD042219‐S1); additional funding from UNICEF, New York.
Conflicts of interest
The authors declare that they have no conflicts of interest.
Contributions
SV, MEB, PE, HC‐K, PLG, and SLJ conceptualized and designed the research. SV, SFR and MRS conducted research. NB and PLG analysed the data. SV, MEB, PE, HC‐K, PLG, SLJ, NB, SFR, and MRS interpreted data. SV drafted the paper. SV, MEB, PE, PLG, SLJ, NB and HC‐K had primary responsibility for review and editing of the final content. All authors read and approved the final manuscript.
Acknowledgements
Mr. K. Narasimha Reddy and Mr. V. Venkatnarasimha Reddy, Technicians, Behavioural Sciences Unit, National Institute of Nutrition for their help in collecting anthropometric data. The Project staff for their dedicated services in collecting the data. Mothers and their children who participated in this study from villages in the Nalgonda District of Andhra Pradesh are gratefully acknowledged for making this study possible through their cooperation and patience.
Footnotes
ICDS is the only major national programme in India that provides young children and mothers supplementary nutrition, health care and pre‐school education.
References
- Aboud F.E. & Akhter S. (2011) A cluster‐randomized evaluation of a responsive stimulation and feeding intervention in Bangladesh. Pediatrics 127, e1191–e1197. [DOI] [PubMed] [Google Scholar]
- Aboud F.E., Shafique S. & Akhter S. (2009) A responsive feeding intervention increases children's self‐feeding and maternal responsiveness but not weight gain. The Journal of Nutrition 139, 1738–1743. [DOI] [PubMed] [Google Scholar]
- Baker‐Henningham H., Powell C., Walker S. & Grantham‐McGregor S. (2005) The effect of early stimulation on maternal depression: a cluster randomised controlled trial. Archives of Disease in Childhood 90, 1230–1234. [DOI] [PMC free article] [PubMed] [Google Scholar]
- Bayley N. (1993) Bayley Scales of Infant Development (BSID‐II). The Psychological Corporation: San Antonio, TX. [Google Scholar]
- Bentley M.E., Wasser H.M. & Creed‐Kanashiro H.M. (2011) Responsive feeding and child undernutrition in low‐ and middle‐income countries. The Journal of Nutrition 141, 502–507. [DOI] [PMC free article] [PubMed] [Google Scholar]
- Bhandari N., Mazumder S., Bahl R., Martines J., Black R.E. & Bhan M.K. (2004) An educational intervention to promote appropriate complementary feeding practices and physical growth in infants and young children in rural Haryana, India. The Journal of Nutrition 134, 2342–2348. [DOI] [PubMed] [Google Scholar]
- Bhutta Z.A., Ahmed T., Black R.E., Cousens S., Dewey K., Giugliani E. et al (2008) What works? Interventions for maternal and child undernutrition and survival. Lancet 371, 417–440. [DOI] [PubMed] [Google Scholar]
- Black M.M. & Aboud F.E. (2011) Responsive feeding is embedded in a theoretical framework of responsive parenting. The Journal of Nutrition 141, 490–494. [DOI] [PMC free article] [PubMed] [Google Scholar]
- Caulfield L., Huffman S. & Piwoz E. (1999) Interventions to improve intake of complementary foods by infants 6 to 12 months of age in developing countries: impact on growth and on the prevalence of malnutrition and potential contribution to child survival. Food and Nutrition Bulletin 20, 183–200. [Google Scholar]
- Dearden K.A., Hilton S., Bentley M.E., Caulfield L.E., Wilde C., Ha P.B. et al (2009) Caregiver verbal encouragement increases food acceptance among Vietnamese toddlers. The Journal of Nutrition 139, 1387–1392. [DOI] [PMC free article] [PubMed] [Google Scholar]
- Dewey K.G. & Adu‐Afarwuah S. (2008) Systematic review of the efficacy and effectiveness of complementary feeding interventions in developing countries. Maternal & Child Nutrition 4 (Suppl. 1), 24–85. [DOI] [PMC free article] [PubMed] [Google Scholar]
- Dewey K.G. & Brown K.H. (2003) Update on technical issues concerning complementary feeding of young children in developing countries and implications for intervention programs. Food and Nutrition Bulletin 24, 5–28. [DOI] [PubMed] [Google Scholar]
- Engle P.L. & Pelto G.H. (2011) Responsive feeding: implications for policy and program implementation. The Journal of Nutrition 141, 508–511. [DOI] [PMC free article] [PubMed] [Google Scholar]
- Engle P.L., Menon P. & Haddad L. (1999) Care and nutrition: concepts and measurement. World Development 27, 1309–1337. [Google Scholar]
- Engle P.L., Bentley M. & Pelto G. (2000) The role of care in nutrition programmes: current research and a research agenda. The Proceedings of the Nutrition Society 59, 25–35. [DOI] [PubMed] [Google Scholar]
- Engle P.L., Black M.M., Behrman J.R., Cabral de Mello M., Gertler P.J., Kapiriri L. et al (2007) Strategies to avoid the loss of developmental potential in more than 200 million children in the developing world. Lancet 20, 229–242. [DOI] [PubMed] [Google Scholar]
- Eshel N., Daelmans B., de Mello M.C. & Martines J. (2006) Responsive parenting: interventions and outcomes. Bulletin of the World Health Organization 84, 991–998. [DOI] [PMC free article] [PubMed] [Google Scholar]
- Gopalan C., Rama Sastry B.V. & Balasubramanian S.C. (1971) Nutritive Value of Indian Foods (revised, 2007). National Institute of Nutrition, Indian Council of Medical Research. Hyderabad. India.
- Grantham‐McGregor S.M., Powell C.A., Walker S.P. & Himes J.H. (1991) Nutritional supplementation, psychosocial stimulation, and mental development of stunted children: the Jamaican Study. Lancet 338, 1–5. [DOI] [PubMed] [Google Scholar]
- Guldan G.S., Fan H.C., Ma X., Ni Z.Z., Xiang X. & Tang M.Z. (2000) Culturally appropriate nutrition education improves infant feeding and growth in rural Sichuan, China. The Journal of Nutrition 130, 1204–1211. [DOI] [PubMed] [Google Scholar]
- Imdad A., Yakoob M.Y. & Bhutta Z.A. (2011) Impact of maternal education about complementary feeding and provision of complementary foods on child growth in developing countries. BMC Public Health [Electronic Resource] 11 (Suppl. 3), S25. [DOI] [PMC free article] [PubMed] [Google Scholar]
- International Committee for Standardization in Haematology (1967) International Committee for Standardization in Haematology: protocol for type testing equipment and apparatus used for haematological analysis. British Journal of Haematology 13, 68–75. [Google Scholar]
- Jekel J.F., Elmore J.G. & Katz D.L. (2001) Epidemiology, Biostatistics, and Preventive Medicine .
- Landry S.H., Smith K.E. & Swank P.R. (2006) Responsive parenting: establishing early foundations for social, communication, and independent problem‐solving skills. Developmental Psychology 42, 627–642. [DOI] [PubMed] [Google Scholar]
- Lohman T.G., Roche A.F. & Martorell R. (1988) Anthropometric standardization reference manual Champaign, IL.
- Minkovitz C.S., Hughart N., Strobino D., Scharfstein D., Grason H., Hou W. et al (2003) A practice‐based intervention to enhance quality of care in the first 3 years of life: the Healthy Steps for Young Children Program. JAMA: The journal of the American Medical Association 290, 3081–3091. [DOI] [PubMed] [Google Scholar]
- NNMB (2000) Tribal Population, First Repeat Survey. National Nutrition Monitoring Bureau, National Institute of Nutrition (ICMR), Hyderabad, India.
- NNMB (2002) Diet and nutritional status of rural population. National Nutrition Monitoring Bureau, National Institute of Nutrition (ICMR), Hyderabad, India.
- NNMB (2006) Diet and nutritional status of population and prevalence of hypertension among adults in rural areas. National Nutrition Monitoring Bureau, National Institute of Nutrition (ICMR), Hyderabad, India.
- PAHO/WHO (2003) Guiding principles for complementary feeding of the breastfed child. Pan American Health Organization/World Health Organization, Washington, D.C.
- Penny M.E., Creed‐Kanashiro H.M., Robert R.C., Narro M.R., Caulfield L.E. & Black R.E. (2005) Effectiveness of an educational intervention delivered through the health services to improve nutrition in young children: a cluster‐randomised controlled trial. Lancet 365, 1863–1872. [DOI] [PubMed] [Google Scholar]
- Pomerleau A., Leahey L. & Malcuit G. (1994) Évaluation du développement de l’enfant au cours de la première année: l’utilisation de regroupements d’items du Bayley. Canadian Journal of Behavioural Science/Revue canadienne des sciences du comportement 26, 85–103. [Google Scholar]
- Radloff L.S. (1977) CES‐D Scale – a self‐report depression scale in research in the general population. In: Applied Psychological Measurement. (ed Center for Epidemiological Studies, N).
- Rahman A., Iqbal Z., Bunn J., Lovel H. & Harrington R. (2004) Impact of maternal depression on infant nutritional status and illness: a cohort study. Archives of General Psychiatry 61, 946–952. [DOI] [PubMed] [Google Scholar]
- UNICEF (2009) Tracking Progress on Child and Maternal Nutrition: a survival and development priority. New York.
- Vierhaus M., Lohaus A., Kolling T., Teubert M., Keller H., Fassbender I. et al (2011) The development of 3‐ to 9‐month‐old infants in two cultural contexts: Bayley longitudinal results for Cameroonian and German infants. European Journal of Developmental Psychology 8, 349–366. [Google Scholar]
- Walker S.P., Chang S.M., Powell C.A. & Grantham‐McGregor S.M. (2004) Psychosocial intervention improves the development of term low‐birth‐weight infants. The Journal of Nutrition 134, 1417–1423. [DOI] [PubMed] [Google Scholar]
- Walker S.P., Chang S.M., Vera‐Hernandez M. & Grantham‐McGregor S. (2011) Early childhood stimulation benefits adult competence and reduces violent behavior. Pediatrics 127, 849–857. [DOI] [PubMed] [Google Scholar]
- WHO (1998) Complementary feeding in developing countries: a review of current scientific knowledge. World Health Organization, Geneva: WHO.
- WHO (2006) Multicentre Growth Reference Study Group. WHO Child Growth Standards: length/height‐for‐age, weight‐for‐age, weight‐for‐length, weight‐for‐height and body mass index‐for‐age: Methods and development. Geneva: World Health Organization.
- World Bank (2006) Repositioning Nutrition as Central to Development. A Strategy for Large‐scale Action., Washington, D.C.