Abstract
Goals
To evaluate inter-observer variability among four new physician users on measures of esophageal body function.
Background
Esophageal high resolution manometry (HRM) allows observation of esophageal motility via pressure topography plots. Little is known about the inter-observer variability among physicians.
Study
Two resident and two fellow level physicians each interpreted 10 liquid swallows of 20 esophageal HRM studies (n=200 swallows) using the BioVIEW Analysis Suite (Sandhill Scientific, Inc.). Studies evaluated were from patients referred for evaluation of dysphagia but found to have normal esophageal manometry and complete liquid bolus transit. Physicians received an orientation session and reviewed recent literature. Each physician recorded contractile front velocity (CFV) and distal contractile integral (DCI) for each liquid swallow. STATISTICS: Inter-observer agreements for CFV and DCI were assessed by intraclass correlation (ICC) values. Linear correlations between measurements by two readers were assessed using linear regression modeling techniques.
Results
CFV and DCI values of up to 200 data points were analyzed. Four reader results for CFV and DCI showed strong agreement although stronger for DCI measures (ICC=0.94; 0.91 - 0.98) in comparison to CFV (ICC=0.79; 0.52 - 0.82). Further correlation was performed with two readers; readers 1 and 2 revealed excellent correlation for DCI (r=0.95, p<0.001) and good correlation for CFV (r=0.61, p<0.001).
Conclusions
With a thorough orientation session, good to excellent agreement for CFV and DCI measurements can be obtained from new physician users. CFV measures exhibit greater inter-observer variability possibly due to the artifact produced by intraesophageal pressurization.
Keywords: high resolution, manometry, HRM, motility, esophagus
Introduction
High resolution manometry (HRM) is a technique by which the pressure generated by the esophagus and its sphincters is measured using up to 36 closely-spaced pressure transducers. The information gathered is then reconstructed into a colored topographic plot, also known as the Clouse plot, which allows visual distinction between compartmentalized pressurization and conducted contractions1. This exciting new technique to evaluate esophageal motility has been at the forefront of esophageal motility research in recent years. HRM has been shown to effectively characterize both normal and abnormal bolus transport not well identified by standard waveform manometry alone. Interpretation of conventional manometry involves a degree of subjectivity, and previous studies have shown less than optimal inter-observer agreement in the assessment of manometric variables utilized for diagnosis of esophageal motility disorders2. Recent studies have shown good inter-observer agreement with respect to specific parameters derived from manual analysis of HRM studies3. A new classification scheme has been introduced which utilizes the specific capabilities of HRM technology to reclassify many esophageal dysmotilities4. For these reasons, HRM has been heralded by many clinicians as the successor and replacement for conventional manometry.
As this technology has been in existence for a limited time and has only recently been widely available, the majority of clinicians exposed to it in practice are relatively inexperienced in interpretation of HRM studies. Little is known about the inter-observer variability which may occur among physicians with limited HRM experience. The goal of this study was to assess the variability amongst four novice physician users after completing background training in esophageal motility measurement via HRM.
Materials and Methods
Patients
Esophageal high resolution manometric studies of twenty patients (11 males, mean age 62, range 40 to 77 years) who presented to the Medical University of South Carolina (MUSC) from January 2009 to September 2010 were analyzed. All patients being evaluated for the complaint of dysphagia underwent HRM instead of conventional manometry with hopes that use of additional pressure transducers and topographic Clouse plots would reveal more about the etiology of symptoms. HRM studies were conducted and analyzed for the clinical evaluation and treatment of these patients after the risks and benefits of the procedure were explained and informed consent was obtained. Twenty patient studies were selected for analysis via retrospective review of the esophageal manometry database. All patient studies included for interpretation met the following parameters: (1) 10 liquid swallows performed, (2) presence of complete liquid bolus transit (≥8/10 complete swallows by multichannel intraluminal impedance parameters), and (3) diagnosis of “normal esophageal manometry” was rendered when initially interpreted by an attending gastroenterologist with expertise in the field of esophageal motility. We felt that selection of patient pool of studies interpreted to be “normal” although subjects were still symptomatic of dysphagia would provide the most uniform subject group for this study of novice HRM inter-observer variability. All studies were then de-identified for repeat analysis by novice readers for the purpose of this project. The study protocol was approved by the Medical University of South Carolina (MUSC) Institutional Review Board.
High Resolution Impedance Manometry
The Sandhill Scientific Inc. HRM probe has 32 circumferential pressure sensors spaced 1 cm apart and 16 impedance channels with 2 cm spacing. The study is acquired with high resolution guided protocol on the Sandhill Scientific Inc. InSIGHT™ Acquisition software and analyzed using BioVIEW Analysis dedicated software.
Study Protocol
All study participants initially were evaluated with combined high-resolution impedance-manometry system (Sandhill Scientific Inc, Highlands Ranch, CO) for the purpose of guiding their ongoing clinical treatment. Esophageal function testing was conducted in standard fashion. After nasal local anesthesia (lidocaine gel), the HRM catheter was passed through the nasal cavity into the pharynx. Further intubation into the stomach was facilitated by repeated water swallows up to a depth of 60 cm. The catheter was then slowly pulled back in a step-by-step fashion to identify the lower esophageal sphincter (LES). The catheter was positioned so that impedance segments were located 5, 10, 15, and 20 cm above the LES. Once proper catheter placement was confirmed with real-time waveform analysis and identification of the LES, the catheter was fixed in place by taping it to the nose. Subjects then underwent standard HRM testing involving 10 liquid (5 ml saline 0.9%) swallows. Subsequently, the data were analyzed with the Sandhill BioVIEW Analysis Suite 64 software (Sandhill Scientific Inc, Highlands Ranch, CO). This software package allowed each interpreter to analyze each swallow using pressure topography plots by calculating esophageal body measures including the distal contractile integral (DCI) and contractile front velocity (CFV).
Data Analysis
Two internal medicine residents and two first year gastroenterology level fellowship physicians with background training in esophageal motility blindly and independently analyzed the 200 liquid swallows captured in the twenty patient studies. Prior to starting their analysis, each interpreter was provided reference literature regarding classification of esophageal motility abnormalities by both standard and high resolution manometry4,5. A sixty minute interactive tutorial was also held by educational instructors of Sandhill Scientific Inc. During this session, instructions were provided regarding correct use of the HRIM analysis tools and navigation of the BioVIEW software package.
Each interpreter was asked to analyze two parameters used to evaluate lower esophageal body smooth muscle function and mechanics, contractile front velocity (CFV) and distal contractile integral (DCI). At the time of this experiment, the Sandhill BioVIEW Analysis suite was being optimized to include a LES residual pressure parameter known as the integrated residual pressure (IRP). Since the IRP parameter was not yet perfected, we chose to focus strictly upon measures of the esophageal smooth muscle function for purposes of inter-observer variability. In order to evaluate these parameters, each swallow was analyzed using the Clouse plot with an isobaric contour set to 30 mmHg. CFV was calculated by marking the distal temporal margin of the transition zone and the superior margin of the esophagogastric junction (EGJ) on the 30-mmHg isobaric contour and then calculating the slope between the two points. The distal esophageal contraction was characterized by evaluating the DCI which assesses the dynamics of the contractile force with respect to length of lower esophageal smooth muscle (cm), contractile vigor (mmHg), and contractile duration (s). Similar to CFV, DCI was calculated utilizing the BioVIEW automated tool to outline the topographic esophageal contraction using a 30-mmHg isobaric contour. On the topographic plot, the area of contraction inferior to the distal margin of the transition zone and superior to the proximal margin of the esophagogastric junction (EGJ) on the 30-mmHg isobaric contour was outlined. Figure 1 illustrates the methods utilized by readers to meaure CFV and DCI.
Figure 1.
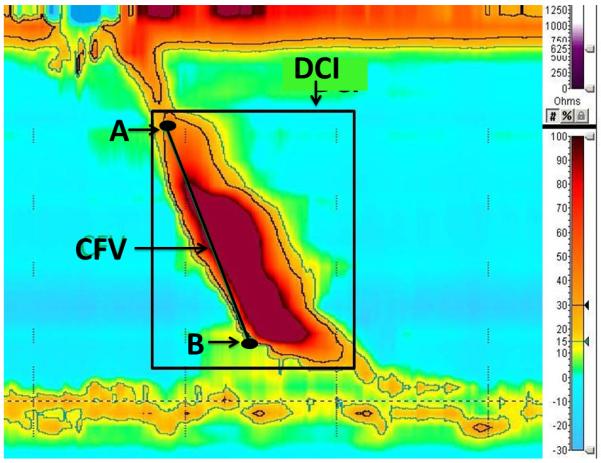
Definitions of CFV and DCI measures. CFV is signified as the slope of the line between point A at the distal temporal margin of the transition zone and point B at the superior margin of the esophagogastric junction (EGJ) on the 30-mmHg isobaric contour. DCI is the area of contraction inferior to the distal margin of the transition zone and superior to the proximal margin of the esophagogastric junction (EGJ) on the 30-mmHg isobaric contour as outlined in the black box.
Statistical Analysis
Each independent interpreter recorded DCI and CFV measures for 10 swallows of a total of 20 subjects without further instruction or feedback from instructors or colleagues. Intraclass correlation (ICC) values for inter-observer reliability based on the methods described by Shrout and Fleiss [6], and 95% confidence intervals were constructed by bootstrapping techniques. These analyses were performed using SAS v9.2 (Cary, NC). Further correlational analyses using traditional linear regression techniques were performed with two of the readers’ results in order to assess agreement among the readers who were deemed (by the group of 4 readers) to have committed the fewest errors.
Results
Twenty patient studies with complete liquid bolus transit and a waveform manometric diagnosis of “normal esophageal manometry” were retrospectively selected from the MUSC esophageal manometry database for re-analysis. Four physicians who spent at least one month working in the esophageal motility lab at MUSC but had limited exposure to HRM independently analyzed each of the twenty studies and recorded values for CFV and DCI for each liquid swallow of the twenty patient studies (n=200). The results of their analyses are shown in Table 1. All readers except one calculated similar values for CFV, with reader 4 routinely calculating a lesser velocity. Similarly, all readers except reader 3 routinely calculated similar DCI measures when comparing the results of the 200 liquid swallows analyzed.
Table 1.
Average Multi-reader comparison for CFV and DCI +/− SD with intraclass correlation (ICC) +/− 95% confidence intervals
| Reader 1 | Reader 2 | Reader 3 | Reader 4 | ICC | |
|---|---|---|---|---|---|
| CFV (cm/s) |
4.2 (3.8 - 4.5) |
4.8 (4.5 - 5.2) |
3.8 (3.5 - 4.1) |
2.8 (2.4 - 3.1) |
0.79 (0.52 - 0.87 |
| DCI (mmHg*s*cm) |
3351 (3149 - 3553) |
3234 (3027 - 3441) |
1576 (1375 - 1777 |
3354 (3146 - 3562) |
0.94 (0.91 – 0.98) |
Despite these consistent discrepancies in esophageal body measures exhibited by readers 3 and 4, the intraclass correlation coefficients (ICC) remained quite high. For each measure of interest, ICC values indicated strong agreement between observers, with somewhat stronger agreement for DCI than for CFV. Individual CFV and DCI values per reader for each liquid swallow are represented in Figures 2 and 3.
Figure 2.
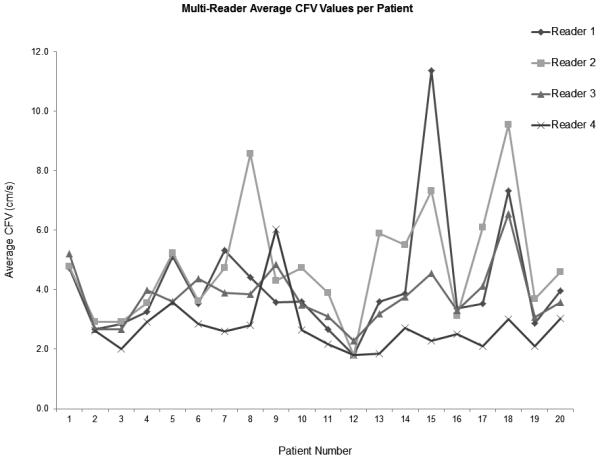
Average CFV values of each patient by reader
Figure 3.
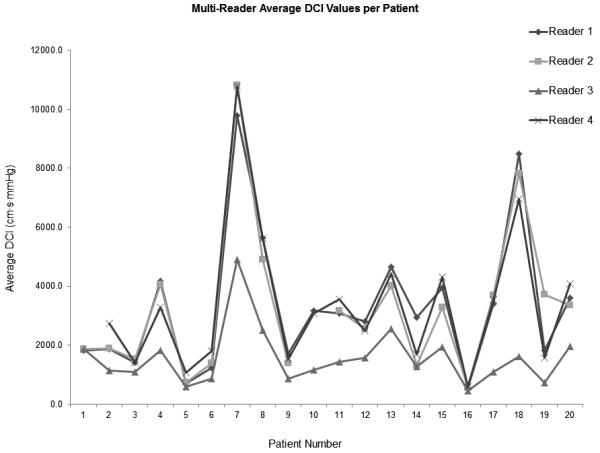
Average DCI values of each patient by reader
To further evaluate inter-observer agreement, results of readers 1 and 2 were selected for linear regression analyses (Figures 4 and 5). These analyses suggest a moderately strong degree of linear association between the readers’ CFV measurements (r=0.61, p<0.001). Similar evaluation of DCI values showed excellent correlation between the readers (r=0.95, p<0.001).
Figure 4.
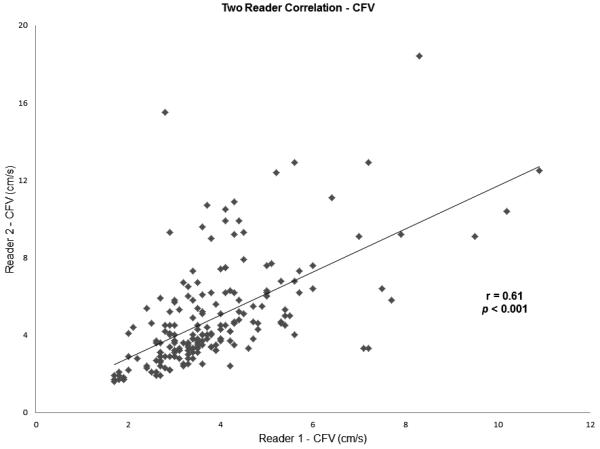
Two reader correlations for CFV
Discussion
High resolution esophageal manometry has been heralded as a technological advancement in the field of esophageal manometry potentially making standard or conventional waveform manometry obsolete. The added number of solid state pressure transducing sensors provides much more information regarding esophageal contractile characteristics as well as obstructive forces encountered near the EGJ area 7. Enthusiasts also feel that the technique provides many other advantages: (i) lending itself to standardized objective measures of interpretation, (ii) easier and quicker performance of studies due to less need for repositioning of the catheter, (iii) and more intuitive and easily learned interpretation by trainees and practitioners naïve to manometric formats8.
Kahrilas, Pandolfino, and et al. have devised an elegant classification scheme for the analysis of esophageal motility abnormalities strictly using pressure topography plots with the assistance of a 30 mmHg isobaric contour tool4. Utilizing new parameters such as DCI, CFV, and IRP, the field of esophageal dysmotilities has grown to include diagnoses such as intermittent peristaltic hypotension, segmental nutcracker esophagus, and rapidly propagated pressurization due to compartmentalized pressurization. Older diagnoses such as distal esophageal spasm (DES) are thought to be better assessed by HRM as evaluation with a 30 mmHg isobaric contour may help differentiate simultaneous contraction in the distal esophagus from simultaneous pressurization in the setting of impaired EGJ relaxation9. As use of this technology has expanded, many changes have been made upon the initial topographic classifications such as selection of the correct isobaric contour (20 or 30 mmHg), the important length of a hypotensive peristaltic segment, and even the parameter most appropriate to determine rapid propagation or velocity10, 11.
Despite these vast and continuous changes to the emerging classification dogma, little is known regarding inter-observer agreement or variability upon making these novel measurements that are necessary for diagnostic purposes. Our study sought to compare the level of agreement between physicians with familiarity in esophageal motility largely through previous experience with standard manometry when exposed to HRM. The results show that four readers did have good agreement on measures of CFV, and excellent agreement with measures of DCI. Despite such favorable agreement as evidenced by ICC values of 0.79 (CFV) and 0.94 (DCI), closer evaluation of CFV values recorded by reader 4 and DCI values recorded by reader 3 showed constant discrepancies between the values recorded by other readers. At the conclusion of our study, all readers gathered for a discussion of measurement techniques and study results, providing rich qualitative insight into these processes. Reader 3 realized that he had incorrectly positioned the second mark necessary for the calculation of DCI. By improperly placing the point superior to the proximal margin of the esophagogastric junction (EGJ) after liquid swallow, reader 3s’ values of DCI were expectedly uniformly less than the remaining readers. Reader 4 also realized that he had incorrectly selected an isobaric level of 20 mmHg when evaluating liquid swallows for CFV of the topographic plot possibly accounting for his uniformly lower values of the CFV parameter.
Linear regression analyses comparing readers 1 and 2 again reveal moderately strong correlation in reference to CFV (r=0.61, p<0.001) and excellent correlation in reference to DCI (r=0.95, p<0.001). Nayer et al. found good inter-observer agreement between highly and mid-experienced interpreters (kappa = 0.61 and 0.65, respectively) when evaluating esophageal motility disorders with conventional manometry, however, the level of agreement was much less with an inexperienced interpreter group (kappa = 0.27). Our results support the feelings of HRM enthusiasts. The level of agreement expressed by the ICC coefficients calculated from the current study exhibits more conformity than that found via kappa comparison among inexperienced interpreters in the previous study of Nayer’s group. The comparison at least suggests that improvement in novice user agreement may indicate that interpretation us more intuitive or easily learned by naïve trainees and practitioners with HRM. However, it is unclear as to why the agreement in values of a one-dimensional measure such as CFV, which in simplest terms is the slope of a line between two points, is much less than that encountered in the calculation of DCI which represents a conglomeration of three separate parameters (distance, time, and vigor of contraction). This phenomenon may be due to artifact caused by intraesophageal intrabolus pressurization in the distal esophagus which HRM should clarify instead of confuse.
Conclusion
The level of agreement of novice high resolution manometric readers between measures of esophageal smooth muscle contractility proved to be good in reference to CFV and excellent in reference to DCI. However, errors were routinely made by two of four readers provided the same background literature and training experiences. These errors may be similar to those that clinical practitioners experience in this rapidly evolving field. Also, the lesser degree of correlation or agreement encountered in making measurements of CFV may support ongoing changes to the classification scheme of distal esophageal spasm as new measures such as latency time and contractile deceleration point may more accurately represent the phenomena of intrabolus pressurization and esophageal smooth muscle contraction12. Our observations also suggest that variability between interpreters’ measures may be minimized by an extensive and thorough introductory orientation session conducted by HRM experts.
Limitations
Our study was limited to HRM measures of esophageal smooth muscle function as the BioVIEW IRP tool was being optimized at the time of our analysis. Since the time of analysis, newer measures used to assess intrabolus pressurization and contractile propagation, latency time and contractile deceleration point, have also been devised which have yet to be studied with inter-observer variability.
Several systematic errors in HRM measurement technique were encountered by readers 3 and 4 as outlined above in the discussion section. Readers 1 and 2 interpretation points were selected for linear regression analysis instead of those of the other users due to the fact these readers had the most complete set of data points. Readers 3 and 4 omitted several interpretation points in isolated cases in which they did not feel that CFV and DCI measures were able to made in certain patient HRM studies.
Figure 5.
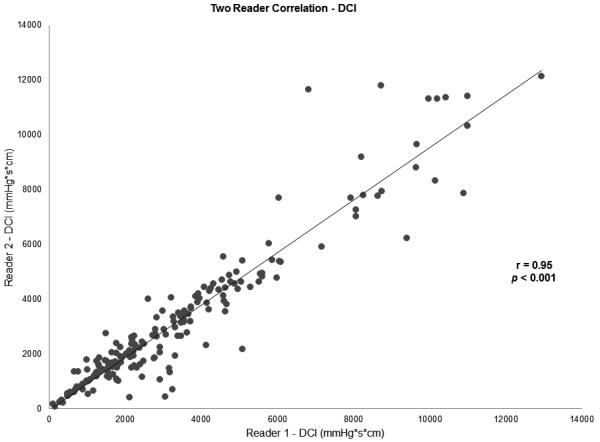
Two reader correlations for DCI
Acknowledgement
This publication was supported by the South Carolina Clinical & Translational Research Institute, Medical University of South Carolina’s CTSA, NIH/NCRR Grant Number UL1RR029882. The contents are solely the responsibility of the authors and do not necessarily represent the official views of the NIH or NCRR.
Grant Support: This publication was supported by the South Carolina Clinical & Translational Research Institute, Medical University of South Carolina’s CTSA, NIH/NCRR Grant Number UL1RR029882.
Abbreviations
- CFV
contractile front velocity
- DCI
distal contractile front
- HRM
high resolution manometry
- ICC
intraclass correlation coefficient
Footnotes
Disclosures: Dr. Donald Castell is a speaker for Sandhill Scientific and Takeda Pharmaceuticals and a consultant for Sandhill Scientific, Takeda Pharmaceuticals, and Xenoport Inc.
This is a PDF file of an unedited manuscript that has been accepted for publication. As a service to our customers we are providing this early version of the manuscript. The manuscript will undergo copyediting, typesetting, and review of the resulting proof before it is published in its final citable form. Please note that during the production process errors may be discovered which could affect the content, and all legal disclaimers that apply to the journal pertain.
References
- 1.Clouse RE, Satiano A. Topography of the esophageal peristaltic pressure wave. Am J Physiol. 1991;261:G677–684. doi: 10.1152/ajpgi.1991.261.4.G677. [DOI] [PubMed] [Google Scholar]
- 2.Nayar DS, Khandwala F, Achkar E, et al. Esophageal manometry: assessment of interpreter consistency. Clin Gastroenterol Hepatol. 2005;3:218–24. doi: 10.1016/s1542-3565(04)00617-2. [DOI] [PubMed] [Google Scholar]
- 3.Sweis R, Anggiansah A, Wong, et al. Normative values and inter-observer agreement for liquid and solid bolus swallows in upright and supine positions as assessed by esophageal high-resolution manometry. Neurogastroenterol Motil. 2011 Feb 22; doi: 10.1111/j.1365-2982.2011.01682.x. doi: 10.1111/j.1365-2982.2011.01682.x. [Epub ahead of print] [DOI] [PubMed] [Google Scholar]
- 4.Kahrilis P, Ghosh S, Pandolfino J. Esophogeal Motility Disorders in Terms of Pressure Topography: the Chicago Classification. J Clin Gastroenterol. 2008;42:627–35. doi: 10.1097/MCG.0b013e31815ea291. [DOI] [PMC free article] [PubMed] [Google Scholar]
- 5.Spechler S, Castell DO. Classification of oesophageal motility abnormalities. Gut. 2001;49:145–15. doi: 10.1136/gut.49.1.145. [DOI] [PMC free article] [PubMed] [Google Scholar]
- 6.Shrout P, Fleiss J. Intraclass correlations: uses in assessing rater reliability. Psychological Bulletin. 1979;86:420–428. doi: 10.1037//0033-2909.86.2.420. [DOI] [PubMed] [Google Scholar]
- 7.Kahrilas PJ, Sifrim D. High-resolution manometry and impedance-pH/manometry: valuable tools in clinical and investigational esophagology. Gastroenterology. 2008;135:756–69. doi: 10.1053/j.gastro.2008.05.048. [DOI] [PMC free article] [PubMed] [Google Scholar]
- 8.Grübel C, Hiscock R, Hebbard G. Value of spatiotemporal representation of manometric data. Clin Gastroenterol Hepatol. 2008;6:525–30. doi: 10.1016/j.cgh.2008.02.006. [DOI] [PubMed] [Google Scholar]
- 9.Kahrilas PJ. Esophageal motor disorders in terms of high-resolution esophageal pressure topography: what has changed? Am J Gastroenterol. 2010;105:981–987. doi: 10.1038/ajg.2010.43. [DOI] [PMC free article] [PubMed] [Google Scholar]
- 10.Bulsiewicz WJ, Kahrilas PJ, Kwiatek MA, et al. Esophageal pressure topography criteria indicative of incomplete bolus clearance: a study using high-resolution impedance manometry. Am J Gastroenterol. 2009;104:2721–2728. doi: 10.1038/ajg.2009.467. [DOI] [PMC free article] [PubMed] [Google Scholar]
- 11.Roman S, Lin Z, Pandolfino JE, et al. Distal Contraction Latency: A Measure of Propagation Velocity Optimized for Esophageal Pressure Topography Studies. Am J Gastroenterol. 2008;106:443–451. doi: 10.1038/ajg.2010.414. [DOI] [PMC free article] [PubMed] [Google Scholar]
- 12.Pandolfino JE, Leslie E, Luger D, et al. The contractile deceleration point: an important physiologic landmark on oesophageal pressure topography. Neurogastroenterol Motil. 2010;22:395–400. doi: 10.1111/j.1365-2982.2009.01443.x. [DOI] [PMC free article] [PubMed] [Google Scholar]


