

Abstract
p73, a p53 family tumor suppressor, is expressed as TA and ΔN isoforms. Due to the role of p73 in tumor suppression and neural development, its expression and activity are tightly regulated by multiple mechanisms, including transcription and posttranslational modifications. Here, we found that p73 mRNA stability is regulated by RNPC1, an RNA binding protein and a target of the p53 family. We also showed that a CU-rich element in the 3′ untranslated region of p73 is recognized by and responsive to RNPC1. To explore the physiological significance of RNPC1-regulated p73 expression, we showed that the loss of RNPC1 in p53-null mouse embryonic fibroblasts leads to reduced expression of p73, along with decreased expression of p21, p130, and γ-H2A.X, and consequently a decreased number of senescent cells. Furthermore, we observed that knockdown of TAp73 or p21, another target of RNPC1, attenuates the inhibitory effect of RNPC1 on cell proliferation and premature senescence, whereas combined knockdown of TAp73 and p21 completely abolishes it. Due to the fact that RNPC1 is a target of p73, the mutual regulation between p73 and RNPC1 constitutes a novel feed-forward loop, which might be explored as a target for tumors without a functional p53.
INTRODUCTION
A member of the p53 family transcription factors, p73, is expressed as TA and ΔN isoforms. The TA isoform, TAp73, is expressed via the P1 promoter located immediately upstream of the first exon, whereas the ΔN isoform, ΔNp73, is expressed via the P2 promoter in intron 3. Each isoform consists of at least nine alternatively spliced isoforms (α to η1) (26). The TA isoform contains an N-terminal activation domain which is homologous to the N-terminal activation domain in p53. Thus, TAp73 has an activity similar to that of p53. ΔNp73 lacks an activation domain conserved in p53 but carries a unique activation domain in the N terminus (13, 20). Thus, ΔNp73 possesses not only an activity distinct from TAp73 but also a dominant negative activity toward TAp73 and possibly p53 since the DNA binding domain shared by TAp73 and ΔNp73 is highly similar to the p53 DNA binding domain (18).
Unlike frequent mutations of the p53 gene in human cancer, the p73 gene is rarely mutated (15, 25). In addition, while p53-null mice develop spontaneous tumors, p73-null mice die from developmental defects (40). However, Trp73 haploinsufficiency contributes to an increased incidence of spontaneous tumors, particularly when combined with Trp53 heterozygosity (10). Furthermore, mice deficient in TAp73 are prone to spontaneous tumor development (34) whereas mice deficient in ΔNp73 are prone to neurological defects (34, 35). Thus, the balance between TAp73 and ΔNp73 may be of greater importance. Indeed, an increase in ΔNp73 is associated with tumor progression and poor prognosis in human cancers, including neuroblastoma (3, 6).
Due to the significance of p73 in tumor suppression and neural development, much effort has been focused on the mechanisms by which p73 is regulated. p73 is found to be activated in response to some of the cellular and genotoxic stresses that also activate p53 (4). p73 is also found to be regulated by acetylation via CBP/p300 (8) and phosphorylation via c-abl (1, 11, 41) and p38 mitogen-activated protein kinase (MAPK) (2). Interestingly, Itch, a Nedd4-like HECT-E3 ubiquitin ligase, targets p73 for degradation in a manner similar to that by MDM2 to control the p53 pathway (29). In addition, p73 can be transcriptionally regulated by DNA damage at least in part via p53, E2F1, and p73 itself (4, 16, 17, 33). Furthermore, p73 expression is regulated by DNA methylation (7, 23). In fact, TP73 is hypermethylated in 94% of natural killer cell lymphomas (32). Nevertheless, very little is known about whether p73 is regulated by posttranscriptional mechanisms such as mRNA stability.
Regulation of mRNA decay or translation is controlled mainly by the interaction of a particular sequence in an mRNA with RNA-binding proteins (RBPs). RNA-binding proteins generally contain one or more RNA-binding domains along with auxiliary domains for protein-protein interaction and subcellular targeting (43). Previously, we showed that RNPC1, an RNA-binding protein and a target of the p53 family, is capable of posttranscriptionally regulating members of the p53 family, including p53 and p63 (44, 45). In addition, RNPC1 is able to stabilize p21 transcripts and, consequently, to suppress cell growth (5, 19, 24, 31). Interestingly, RNPC1a is able to inhibit cell proliferation in p53- and p21-null cells, suggesting that as an RNA-binding protein, RNPC1 may exert its function by regulating other genes involved in cell cycle control. Since p73 is known to induce genes involved in cell cycle arrest and apoptosis in response to various stimuli, we explored whether p73 expression is regulated by and mediates the function of RNPC1.
MATERIALS AND METHODS
Plasmids and small interference RNA oligonucleotides.
Vectors expressing RNPC1a, RNPC1b, and various mutated RNPC1 proteins were used as described previously (5, 31, 45). To generate a construct expressing short hairpin RNA (shRNA) against TAp73, one pair of oligonucleotides (sense, 5′-TCG AGG TCC GGC ATG ACT ACA TCT GTC ATT CAA GAG ATG ACA GAT GTA GTC ATG CCT TTT TG-3′, and antisense, 5′-GAT CCA AAA AGG CAT GAC TAC ATC TGT CAT CTC TTG AAT GAC AGA TGT AGT CAT GCC GGA CC-3′; the shRNA targeting region is underlined) was synthesized and cloned into pBabe-U6 at BamHI and XhoI sites. The plasmid is designated pBabe-U6-siTAp73-1. Similarly, pBabe-U6-siTAp73-2, the second construct expressing shRNA against TAp73, was generated with one pair of oligonucleotides (sense, 5′-TCG AGG TCC CCA GAC AGC ACC TAC TTC GTT CAA GAG ACG AAG TAG GTG CTG TCT GGT TTT TG-3′, and antisense, 5′-GAT CCA AAA ACC AGA CAG CAC CTA CTT CGT CTC TTG AAC GAA GTA GGT GCT GTC TGG GGA CC-3′; the siRNA targeting region is underlined). pBabe-U6-sip21-1, which expresses shRNA against p21, was previously described (39). pBabe-U6-sip21-2, the second construct expressing shRNA against p21, was generated with one pair of oligonucleotides (sense, 5′-TCG AGG TCC GAC CAT GTG GAC CTG TCA CTT CAA GAG AGT GAC AGG TCC ACA TGG TCT TTT TG-3′, and antisense, 5′-GAT CCA AAA AGA CCA TGT GGA CCT GTC ACT CTC TTG AAG TGA CAG GTC CAC ATG GTC GGA CC-3′; the siRNA targeting region is underlined).
To generate luciferase reporters in which the p73 3′-end untranslated region (3′UTR) (nucleotides [nt] 2011 to 2140 or nt 2011 to 2140 with deletion of nt 2070 to 2085) was fused downstream of the gene encoding luciferase, the p73 3′UTR from nt 2011 to 2140 was amplified with forward primer P1 (5′-ACT AGT AGA TCC ACT GAG GGC CTC-3′) and reverse primer P2 (5′-GGG CCC TTC CCG GCA AGC CG-3′). The p73 3′UTR from nt 2011 to 2140 with deletion of nt 2070 to 2085 was amplified by a two-step PCR-based method. Subfragment 1 was amplified with forward primer P1 and reverse primer 5′-CAG TTT GAC CAC GCA CTT GGT TCT3′; subfragment 2 was amplified with forward primer 5′-CAG GAC CAA CTG TGT TGT CAA ACT G-3′ and reverse primer P2. Next, subfragments 1 and 2 were mixed together as a template and amplified with primers P1 and P2. The resulting fragment was subcloned into pGEM-T easy vector. Upon confirmation by sequencing, the fragment was cut with SpeI and ApaI and then cloned into pGL3.
To transiently knock down endogenous RNPC1 or p73, two 19-bp small interference RNAs (siRNAs) against RNPC1, 5′-ACC UUG AUC CAG CGG ACU U dTdT-3′ and 5′-GUA CUU CGA GGG CUU CGG C dTdT-3′, two 19-bp siRNAs against p73, 5′-GGC AUG ACU ACA UCU GUC A dTdT-3′ and 5′-GCU GAU GAG GAC CAC UAC C dTdT-3′, and two scrambled siRNAs, 5′-GCA GUG UCU CCA CGU ACU A dTdT-3′ and 5′-GGC CGA UUG UCA AAU AAU U dTdT-3′, were purchased from Dharmacon RNA Technologies.
Cell lines.
SW480 cell lines, which can inducibly express RNPC1a, RNPC1b, RNPC1a-ΔRNP1, or RNPC1a-ΔRNP2, were generated as previously described (37). HCT116 and p53−/− HCT116 cell lines, which can inducibly express hemagglutinin (HA)-tagged RNPC1a, were previously described (31). To generate SW480 cell lines in which p21 and/or TAp73 was stably knocked down and in which RNPC1a was inducibly expressed, pBabe-U6-sip21-1 and/or pBabe-U6-siTAp73-1 was transfected into SW480 cells in which RNPC1a can be inducibly expressed. To generate p53−/− HCT116 cell lines in which p21 and/or TAp73 was stably knocked down and in which RNPC1a was inducibly expressed, pBabe-U6-sip21-2 and/or pBabe-U6-siTAp73-2 was transfected into p53−/− HCT116 cells in which RNPC1a can be inducibly expressed. p73- and/or p21-knockdown cell lines were selected with puromycin and confirmed by Western blot analysis.
Isolation of primary MEFs.
To generate p53−/−; RNPC1+/+ and p53−/−; RNPC1−/− mouse embryonic fibroblasts (MEFs), mice heterozygous for RNPC1 and mice heterozygous for p53 were bred to generate mice heterozygous for RNPC1 and p53. These mice were then bred, and MEFs were isolated from 13.5-day-old embryos as described previously (30). p53−/−; RNPC1+/+ and p53−/−; RNPC1−/− mice were viable at birth and did not show obvious developmental abnormalities. All animals were housed at the University of California at Davis CLAS vivarium facility. All animal and use protocols were approved by the University of California at Davis Institution Animal Care and Use Committee.
Antibodies.
Anti-RNPC1 antibody was purified from rabbit sera against His-tagged RNPC1 protein using glutathione S-transferase (GST)-RNPC1a beads. Other antibodies used were antiactin (Sigma), anti-p21 (C-19) (Santa Cruz Biotechnology), anti-TAp73 (Bethyl), anti-p73β (ab-3) (Calbiochem), anti-HA (Covance), anti-p130 (C-20) (Santa Cruz Biotechnology), anti-p-histone H2A.X(Ser139) (Millipore), anti-poly(ADP-ribose) polymerase (anti-PARP; BD Pharmingen), anti-DEC1(Bethyl), and anti-PML (H-238) (Santa Cruz Biotechnology).
RNA purification, RT-PCR, and qPCR.
Total RNAs were isolated with TRIzol reagent (Invitrogen). cDNAs were synthesized using an Iscript cDNA synthesis kit (Bio-Rad). Quantitative PCR (qPCR) was conducted using a Realplex2 system (Eppendorf). To quantify the levels of p73α and p73β mRNA, qPCR was performed with forward primer 5′-GCA AGT CGG AGC ACA-3′ and reverse primer 5′-ATG ACT TGG CAT AGT CTT-3′ (for p73α) or reverse primer 5′-CCC CAG TCT GAG A-3′ (for p73β). The primers used to amplify ΔNp73 were as follows: forward, 5′-GGA TTC AGC CAG TTG ACA GAA C-3′, and reverse, 5′-CTG CTC ATC TGG TCC ATG G-3′. Glyceraldehyde-3-phosphate dehydrogenase (GAPDH) was amplified as described previously (36). To measure the level of mouse TAp73 mRNA, reverse transcription (RT)-PCR was performed with forward primer 5′-AGC AGA ATG AGC GGC AGC GT-3′ and reverse primer 5′-ACT GCT GAG CAA ATT GAA CTG-3′. The primers used to amplify mouse actin mRNA were forward primer 5′-TCC ATC ATG AAG TGT GAC GT-3′ and reverse primer 5′-TGA TCC ACA TCT GCT GGA AG-3′.
REMSA.
Various regions in p73 3′UTR were PCR amplified using primers containing the T7 promoter sequence (5′-GGA TCC TAA TAC GAC TCA CTA TAG GGA G-3′). An RNA electrophoretic mobility shift assay (REMSA) was performed as previously described (5).
RNA-protein immunoprecipitation assay.
The RNA-protein immunoprecipitation assay was carried out as previously described (27). The primers to detect p73 were forward primer 5′-TCA GGA GGC AGG ACC TTC G-3′ and reverse primer 5′-TCC TGC AGA ATA CAG CGT GC-3′. The primers to detect p21 and GAPDH were used as previously described (5, 31).
Luciferase assay.
A dual-luciferase assay was performed in triplicate as previously described (38). The fold increase in relative luciferase activity is a ratio of the luciferase activity induced by RNPC1a or RNPC1a-ΔRNP2 protein to that induced by empty pcDNA3 vector.
Colony formation assay.
SW480 or p53−/− HCT116 cells (1,000 per well) in a six-well plate were cultured for 15 to 20 days in the absence or presence of tetracycline (1.0 μg/ml) and then fixed and stained.
Senescence assay.
Cells seeded on a six-well plate were uninduced or induced to express RNPC1a for 6 days. The senescence assay was performed as described previously (28).
DNA histogram assay.
For the cell cycle assay, cells were seeded at 5 × 10⁵ per 10-cm plate in triplicate and then induced with or without tetracycline for 3 days. Both floating dead cells in the medium and live cells on the plate were collected and fixed with 70% ethanol for 24 h. The fixed cells were centrifuged and resuspended in 0.3 ml of phosphate-buffered saline solution containing 50 μg/ml each of RNase A and propidium iodide (PI). The stained cells were analyzed in a fluorescence-activated cell sorter within 4 h. The percentages of cells in the sub-G1, G1, S, and G2-M phases were determined using the CELLQuest program (BD Biosciences). BrdU/PI staining was performed as previously described (28). Briefly, cells were seeded at 5 × 10⁵ per 100-mm plate in triplicate for 24 h with or without treatment with 100 nM camptothecin (CPT) for 24 h. Cells were incubated with 20 μM BrdU for 45 min, fixed in ethanol (70%) overnight, and then subjected to BrdU/PI staining. Samples were analyzed by fluorescence-activated cell sorting (BD Biosciences).
Statistics.
All experiments were performed at least in triplicate. Numerical data were expressed as means ± standard deviations (SDs). Two group comparisons were analyzed by a two-sided Student t test. P values were calculated, and a P of <0.05 was considered significant.
RESULTS
The levels of p73 proteins and transcripts were increased by ectopic expression of RNPC1a.
While p73 transcription and protein stability have been extensively investigated, little is known about whether p73 is regulated by posttranscriptional mechanisms, such as mRNA stability. Previously, we showed that RNPC1 is a target of members of the p53 family, including p73 (31, 44, 45). In this study, we further found that ectopic expression of TAp73α or TAp73β increased the expression of RNPC1 in SW480 and p53−/− HCT116 cells (Fig. 1A and B), whereas knockdown of p73 decreased the expression of RNPC1 regardless of camptothecin treatment (Fig. 1C and D). We then sought to investigate whether p73 is posttranscriptionally regulated by RNA-binding protein RNPC1. Given that p73 is a target of wild-type p53 and that p53 translation is inhibited by RNPC1 (4, 44), p53-deficient cells were used to study whether p73 is regulated by RNPC1 independently of p53. Specifically, SW480 cells, containing a mutant p53 (R273H/P309S), were utilized to generate stable cell lines in which RNPC1a can be inducibly expressed under the control of a tetracycline-regulated promoter. Two representative cell lines are shown in Fig. 2A. We showed that the levels of TAp73α and TAp73β proteins were obviously increased by RNPC1 under normal and DNA damage-inducing conditions (Fig. 2B, compare lanes 1 and 3 with 2 and 4, respectively). In contrast, tetracycline alone had no effect on the levels of p73 protein and mRNA in SW480 cells (data not shown). Likewise, ectopic expression of RNPC1a increased the level of p73 proteins in p53−/− HCT116 cells regardless of camptothecin treatment (Fig. 2C). In addition, we showed that p73 proteins were accumulated in SW480 and p53−/− HCT116 cells treated with camptothecin (Fig. 2B and C, compare lanes 1 and 3), consistent with previous reports (4, 17). We also note that the level of p21 was not significantly increased by camptothecin treatment, since SW480 cells carry a defective mutant p53 (R273H/P309S), which may antagonize potential upregulation of p21 due to increased levels of p73 (Fig. 2B, p21 panel, compare lanes 1 and 3). Nevertheless, the level of p21 protein was markedly increased by RNPC1a regardless of camptothecin treatment (Fig. 2B and C, compare lanes 1 and 3 with 2 and 4, respectively), consistent with previous reports that RNPC1 directly binds to and stabilizes p21 mRNA (5, 19, 24, 31).
Fig 1.

Expression of RNPC1a is regulated by p73. (A and B) The level of RNPC1a protein is induced by overexpression of TAp73α or TAp73β in SW480 (A) or p53−/− HCT116 (B) cells. Western blots were prepared with extracts from SW480 or p53−/− HCT116 cells transfected with pcDNA3, pcDNA3-HA-TAp73α, or pcDNA3-HA-TAp73β for 1 day and then probed with antibodies against HA, RNPC1, and actin. The basal levels of RNPC1a were arbitrarily set at 1.0, and the fold change is shown below each lane. (C and D) The level of RNPC1a protein is decreased by knockdown of TAp73 in SW480 (C) or p53−/− HCT116 (D) cells under both the basal and stress conditions. Western blots were prepared with extracts from SW480 or p53−/− HCT116 cells transfected with scrambled siRNA or siRNA to knock down TAp73 for 3 days, with or without treatment with 250 nM camptothecin (CPT) for 24 h, and then probed with antibodies against TAp73α, RNPC1, and actin. The basal levels of RNPC1a were arbitrarily set at 1.0, and the fold change is shown below each lane.
Fig 2.

The levels of p73 proteins and transcripts are increased by ectopically expressed RNPC1. (A) Generation of SW480 cell lines in which RNPC1a can be inducibly expressed. Western blots were prepared with extracts from SW480 cells uninduced (—) or induced (+) to express RNPC1a for 1 day and then probed with antibodies against RNPC1 and actin. (B) The levels of TAp73α, TAp73β, and p21 proteins are increased by ectopic expression of RNPC1a regardless of treatment with camptothecin (CPT). Western blots were prepared with extracts from SW480 cells, which were uninduced (—) or induced (+) to express RNPC1a for 3 days, with or without treatment with CPT for 1 day, and then probed with antibodies against TAp73α, TAp73β, p21, RNPC1, and actin. The basal levels of p21 and p73 were arbitrarily set at 1.0, and the fold change is shown below each lane. (C) The experiment shown in panel B was performed as described except that p53−/− HCT116 cells were used. (D and E) The levels of p73α (D) and p73β (E) transcripts are increased by ectopic expression of RNPC1a regardless of treatment with CPT. qPCR was performed with total RNAs isolated from SW480 cells treated as described for panel B. The relative levels of p73 mRNA were normalized to levels of GAPDH mRNA from three independent experiments. An asterisk indicates a significant difference (P < 0.05). (F and G) The experiment shown in panels D and E was performed as described except that p53−/− HCT116 cells were used. (H and I) The half-lives of p73α (H) and p73β (I) transcripts are enhanced by RNPC1a. SW480 cells were uninduced (—) or were induced (+) to express RNPC1a for 3 days, followed by treatment with 5 μg/ml of actinomycin D (Act D) for 0, 2, 4, or 6 h. The relative half-lives of p73 transcripts were calculated from triplicate samples and are presented as means ± SDs.
As an RNA-binding protein, RNPC1 may directly bind to and stabilize p73 mRNA and consequently increase its levels. Thus, quantitative PCR (qPCR) was performed and showed that under normal and DNA damage-inducing conditions, the levels of p73α and p73β transcripts were increased by RNPC1a in SW480 cells (Fig. 2D and E) and p53−/− HCT116 cells (Fig. 2F and G). In addition, the level of p73 transcripts was increased upon DNA damage (Fig. 2D to G, compare the control columns with and without camptothecin treatment), consistent with previous reports that p73 transcripts can be upregulated by DNA damage (4, 16). We note that because the extent of induction for p73α transcripts by DNA damage was much higher than that for p73β, the fold change in induction by RNPC1 in the presence of DNA damage for p73α was less than that for p73β in SW480 and p53−/− HCT116 cells (Fig. 2D to G).
To further explore how RNPC1 regulates p73 transcripts, we examined whether RNPC1a has an effect on p73 mRNA stability. To test this, SW480 cells were uninduced or induced to express RNPC1a and then treated with actinomycin D to inhibit nascent RNA synthesis. qPCR analysis showed that the relative half-life for p73α mRNA was increased from 3.4 to 5.7 h (Fig. 2H) and the relative half-life for p73β mRNA increased from 2.3 to 3.8 h (Fig. 2I). This suggests that RNPC1a increases p73 expression by prolonging p73 mRNA half-life.
Knockdown or knockout of RNPC1 decreases p73 expression.
To examine whether endogenous RNPC1 has an effect on p73 expression, the levels of p73 proteins and transcripts were measured in SW480 cells with RNPC1a knockdown. We showed that the level of endogenous RNPC1a was decreased by RNPC1, but not scrambled, siRNA (Fig. 3A). Importantly, RNPC1a knockdown resulted in a marked reduction of p73 proteins (Fig. 3A, compare lanes 1 and 3 with 2 and 4, respectively) and transcripts (Fig. 3B and C) under normal and DNA damage-inducing conditions. Consistently, the levels of p73 proteins in SW480 cells were also decreased by the second siRNA against RNPC1a (data not shown). Similarly, knockdown of RNPC1a in p53−/− HCT116 cells significantly decreased the levels of p73 proteins and transcripts (Fig. 3D to F). Moreover, the levels of p73 protein and transcripts were measured in primary MEFs isolated from p53−/−; RNPC1+/+ and p53−/−; RNPC1−/− embryos. We found that loss of RNPC1 in p53-null MEFs led to a decreased level of TAp73α proteins (Fig. 3G, compare lanes 1 and 3 with 2 and 4, respectively) and transcripts (Fig. 3H, compare lanes 1 and 3 with 2 and 4, respectively) regardless of camptothecin treatment. Furthermore, we showed that the relative half-lives of p73α and p73β transcripts were decreased by RNPC1 knockdown in SW480 cells (Fig. 3I and J), consistent with the above observations that the half-life of p73 mRNA was increased by ectopic expression of RNPC1a (Fig. 2H and I).
Fig 3.

Knockdown or knockout of RNPC1 decreases p73 expression. (A) The levels of TAp73α and TAp73β proteins are decreased by knockdown of RNPC1a under both basal and stress conditions. Western blots were prepared with extracts from SW480 cells transfected with scrambled siRNA or siRNA to knock down RNPC1a for 3 days, with or without treatment with CPT, and then probed with antibodies against TAp73α, TAp73β, RNPC1, and actin. The basal levels of p73 were arbitrarily set at 1.0, and the fold change is shown below each lane. exp., exposure. (B and C) The levels of p73α (B) and p73β (C) transcripts are decreased by knockdown of RNPC1a under both basal and stress conditions. qPCR was performed with total RNAs isolated from SW480 cells treated as described for panel A. The relative levels of p73 mRNAs from three independent experiments were normalized to levels of GAPDH mRNA. An asterisk indicates a significant difference (P < 0.05). (D) The experiment shown in panel A was performed as described except that p53−/− HCT116 cells were used. (E and F) The experiment shown in panels B and C was performed as described except that p53−/− HCT116 cells were used. (G) Knockout of RNPC1 in p53-null MEFs decreases the level of TAp73α protein. Primary MEFs isolated from p53−/−; RNPC1+/+ and p53−/−; RNPC1−/− embryos at passage 9 were treated with or without 200 nM CPT for 12 h, and the levels of RNPC1, TAp73α, and actin were measured. (H) Knockout of RNPC1 in p53-null MEFs decreases the level of TAp73 transcript. RT-PCR was performed with total RNAs isolated from MEFs treated as described for panel G. (I and J) The stability of p73α (I) and p73β (J) transcripts was decreased by knockdown of RNPC1a. The experiment shown in panels B and C was performed as described except that RNAs were purified from SW480 cells transfected with scrambled siRNA or siRNA against RNPC1a for 3 days, followed by treatment with 5 μg/ml of actinomycin D (Act D) for 0, 2, or 4 h.
The above observations indicate that an increase in p73α and p73β transcripts is correlated with an increase in TAp73α and TAp73β proteins. Due to low levels of ΔNp73 compared to TAp73 expressed in SW480 cells, ΔNp73 proteins were undetectable. Thus, to determine whether ΔNp73 is similarly regulated by RNPC1, RT-PCR was performed with a pair of primers that specifically amplify ΔNp73 transcripts. We showed that upon expression of RNPC1a, the basal and DNA damage-inducing levels of ΔNp73 transcripts were significantly increased in HCT116 cells (Fig. 4A). Conversely, knockdown of RNPC1a led to decreased levels of ΔNp73 transcripts in HCT116, p53−/− HCT116, and SW480 cells regardless of treatment with camptothecin (Fig. 4B to D).
Fig 4.

ΔNp73 expression is regulated by RNPC1a. (A) The levels of ΔNp73 transcripts are increased by ectopic expression of RNPC1. RT-PCR was performed with total RNAs isolated from HCT116 cells uninduced (—) or induced (+) to express HA-tagged RNPC1a for 3 days with or without CPT treatment for 16 h. (B to D) The levels of ΔNp73 transcripts are decreased by knockdown of RNPC1a. RT-PCR was performed with total RNAs isolated from HCT116 (B), p53−/− HCT116 (C), and SW480 (D) cells in which RNPC1a was transiently knocked down for 3 days with or without CPT treatment for 24 h. GAPDH mRNA was used as a loading control.
The RNA-binding domain and the C-terminal region in RNPC1a are necessary for maintaining p73 mRNA stability.
The RNA-binding domain in RNPC1 contains one highly conserved RNA recognition motif (RRM) which consists of two submotifs, RNP1 and RNP2 (Fig. 5A) (31). Thus, to determine whether RNA-binding activity of RNPC1 is required for regulating p73 expression, we generated multiple SW480 cell lines that can inducibly express RNPC1a with deletion of RNP1 (RNPC1a-ΔRNP1) or RNP2 (RNPC1a-ΔRNP2) (Fig. 5B and F). We showed that both RNPC1a-ΔRNP1 and RNPC1a-ΔRNP2 were unable to alter the levels of p73 protein (Fig. 5C and G) and mRNA (Fig. 5D and E and Fig. 5H and I) regardless of treatment with camptothecin.
Fig 5.

The RNA binding domain and the C-terminal region in RNPC1 are necessary for maintaining p73 mRNA stability. (A) Schematic presentation of the RNA recognition motif (RRM) in RNPC1a, two deletion mutants of RNPC1a (RNPC1a-ΔRNP2 and RNPC1a-ΔRNP1), and RNPC1b. (B, F, and J) Generation of SW480 cell lines in which RNPC1a-ΔRNP1 (B), RNPC1a-ΔRNP2 (F), or RNPC1b (J) can be inducibly expressed. Western blots were prepared with extracts from SW480 cells uninduced (—) or induced (+) to express RNPC1a-ΔRNP1 (B), RNPC1a-ΔRNP2 (F), or RNPC1b (J) for 1 day and then probed with antibodies against RNPC1 and actin. (C, G, and K) The levels of TAp73α and TAp73β proteins are not increased by ectopic expression of RNPC1a-ΔRNP1 (C), RNPC1a-ΔRNP2 (G), or RNPC1b (K) regardless of treatment with CPT. Western blots were prepared with extracts from SW480 cells, which were uninduced (—) or induced (+) to express RNPC1a-ΔRNP1 (C), RNPC1a-ΔRNP2 (G), or RNPC1b (K), with or without treatment with CPT, and then probed with antibodies against TAp73α, TAp73β, RNPC1, and actin. (D, E, H, I, L, and M) The levels of p73α (D, H, and L) and p73β (E, I, and M) transcripts are not increased by ectopic expression of RNPC1a-ΔRNP1 (D and E), RNPC1a-ΔRNP2 (H and I), or RNPC1b (L and M) regardless of treatment with CPT. qPCR was performed with total RNAs isolated from SW480 cells treated as described for panels C, G, and K. The relative levels of p73 mRNA were normalized to levels of GAPDH mRNA from three independent experiments.
Next, we determined whether p73 is regulated by RNPC1b, another isoform of RNPC1, which contains the RRM (amino acids 36 to 107) and is identical to the N-terminal region in RNPC1a (Fig. 5A). For this purpose, multiple SW480 cell lines that can inducibly express RNPC1b were generated (Fig. 5J). We showed that unlike RNPC1a, RNPC1b was unable to increase the levels of p73 proteins (Fig. 5K) and transcripts (Fig. 5L and M) in the presence or absence of camptothecin. Together, these results suggest that the integrity of the RNA-binding domain and the C-terminal 118 residues in RNPC1a are required for regulating p73 mRNA stability.
A CU-rich element in the p73 3′UTR is bound by and responsive to RNPC1a.
To explore the underlying mechanism by which RNPC1a stabilizes p73 transcripts, we sought to determine whether RNPC1a associates with p73 transcripts in vivo by performing an RNA immunoprecipitation assay. We showed that p73 transcripts were detected in anti-RNPC1 but not in control IgG immunoprecipitates (Fig. 6A). As a positive control, p21 transcripts were also detected in anti-RNPC1 immunoprecipitate (Fig. 6A), consistent with previous reports (5, 31).
Fig 6.

A CU-rich element in the p73 3′UTR is bound by and responsive to RNPC1. (A) RNPC1 binds to p73 mRNAs in vivo. HCT116 cells uninduced (—) or induced (+) to express HA-tagged RNPC1a for 24 h were used for an RNA immunoprecipitation assay. Anti-HA was used to precipitate HA-tagged RNPC1-RNA complexes along with IgG as a control. The binding of RNPC1 to p73, p21, and GAPDH transcripts was measured by RT-PCR as described in Materials and Methods. (B) Schematic presentation of the p73 3′UTR and probes used for REMSA. (C) REMSA was performed by mixing 32P-labeled RNA probe a with recombinant GST or GST-fused HA-RNPC1a. The binding of RNPC1a to p21 3′UTR was used as a positive control. For a competition assay, an excess amount of unlabeled p21 cold probe was added to a reaction mixture containing RNPC1 and probe a. The bracket indicates RNA-protein complexes. (D) For the supershift assay, 3 μg of control IgG or anti-HA was added to a reaction mixture containing probe a with or without GST-HA-RNPC1. (E) RNPC1a binds to probes b (nt 2011 to 2440), c (nt 2011 to 2299), and d (nt 2011 to 2140), but not probe e (nt 2011 to 2070), f (nt 2441 to 2820), or g (nt 2011 to 2140 with nt 2070 to 2085 deleted). REMSA was performed as described for panel C. (F) Unlabeled cold probe d, but not g, inhibits the formation of the RNPC1-probe a complex in a competition assay. (G) The region of nt 2011 to 2140 in the p73 3′UTR is responsive to RNPC1a but not RNPC1a-ΔRNP2. The luciferase assay was carried out as described in Materials and Methods.
Next, to identify a potential binding region of RNPC1a in p73 transcripts in vitro, an RNA electrophoretic mobility shift assay (REMSA) was performed by mixing recombinant GST or GST-fused HA-RNPC1a with 32P-labeled probe a, which contained the 3′UTR of the p73 transcript (Fig. 6B). The p21 3′UTR, known to contain an RNPC1-binding site, was used as a positive control (Fig. 6C, lane 5) (5, 31). We showed that recombinant GST-fused HA-RNPC1a, but not GST protein, formed a complex with probe a (Fig. 6C, lane 2). Furthermore, this RNA-protein complex was inhibited by an excess amount of cold p21 probe (Fig. 6C, lane 3) or supershifted with anti-HA, which recognizes HA-tagged RNPC1a (Fig. 6D, lane 4), but not control IgG (Fig. 6D, lane 3). In addition, anti-HA alone was unable to form a complex with probe a in the absence of RNPC1a (Fig. 6D, lane 5). Next, to further delineate the binding site of RNPC1a in the p73 3′UTR, probes b to f were generated for the REMSA (Fig. 6B). We found that GST-HA-RNPC1a fusion protein directly bound to probes b, c, and d but not to probes e and f (Fig. 6E, compare lanes 1, 3, 5, 7, and 9 with lanes 2, 4, 6, 8, and 10, respectively). These data suggest that the region comprising nt 2070 to 2140 is required for RNPC1a to bind to the p73 3′UTR. When searching this region, we found a potential RNPC1-binding site, a CU-rich element from nt 2070 to nt 2085. To test this, probe g was made with an internal deletion of the CU-rich element (Fig. 6B). We found that probe g was unable to associate with RNPC1a in vitro (Fig. 6E, lane 12). Furthermore, cold probes d and g were used to confirm the binding specificity of RNPC1a to the CU-rich element in a competition assay. We found that unlabeled cold probe d, but not g, was able to inhibit the formation of the RNPC1-probe a complex (Fig. 6F). To functionally confirm that the CU-rich element is required for RNPC1a binding to the p73 transcript, we made a luciferase reporter in which the p73 3′UTR was fused downstream of the luciferase gene (Fig. 6G, left panel). We showed that the reporter with an intact p73 3′UTR but not the one without the CU-rich element exhibited a strong luciferase activity in the presence of RNPC1a (Fig. 6G, right panel). In addition, we showed that RRM-deficient RNPC1a (RNPC1a-ΔRNP2) was incapable of increasing the luciferase activity (Fig. 6G, right panel). These data suggest that the CU-rich element located within nt 2070 to 2085 in the p73 3′UTR is required for RNPC1 to regulate p73 mRNA stability.
TAp73 along with p21 mediates RNPC1a-dependent growth suppression.
Current and previous studies (5, 19, 24, 31) showed that both p21 and p73 transcripts are regulated by RNPC1a. In addition, overexpression of RNPC1a leads to growth suppression (31). Moreover, p73, a transcription factor and a member of the p53 family, can transactivate an array of target genes, including p21, to induce cell cycle arrest (12). Thus, it is likely that p73, p21, or both may mediate RNPC1a-dependent growth suppression. To address this, we showed that cell proliferation was significantly inhibited by RNPC1a (Fig. 7A) but not RNPC1b (Fig. 7B), RNPC1a-ΔRNP1 (Fig. 7C), or RNPC1a-ΔRNP2 (Fig. 7D). The results are consistent with our previous finding that RNPC1a but not RNPC1b suppresses cell proliferation in MCF7 and HCT116 cells (31). Moreover, we showed that overexpression of RNPC1a led to cell cycle arrest in G1 phase in SW480 (Fig. 7E) and p53−/− HCT116 (Fig. 7F) cells. Consistent with this, cleavage of poly(ADP-ribose) polymerase (PARP), a hallmark of apoptosis, was not induced by RNPC1a in SW480 and p53−/− HCT116 cells (Fig. 7G). Together, these data suggest that RNPC1a inhibits cell proliferation by inducing cell cycle arrest in G1 phase in the absence of p53.
Fig 7.

Overexpression of RNPC1a, but not RNPC1b, RNPC1a-ΔRNP1, or RNPC1a-ΔRNP2, inhibits cell proliferation via cell cycle arrest. (A to D) SW480 cells uninduced or induced to express RNPC1a (A), RNPC1b (B), RNPC1a-ΔRNP1 (C), or RNPC1a-ΔRNP2 (D) were cultured for a period of 18 to 20 days and then fixed and stained. (E) SW480 cells were uninduced or were induced to express RNPC1a for 3 days. Both floating and live cells were collected and then stained with propidium iodide for DNA histogram analysis as described in Materials and Methods. (F) The experiments shown in panel E were performed as described except that p53−/− HCT116 cells were used. (G) Overexpression of RNPC1a does not induce PARP cleavage. Western blots were prepared with extracts from SW480 and p53−/− HCT116 cells, which were treated as described for panel E and then probed with antibodies against RNPC1, PARP, and actin.
Next, to determine the role of p73 along with p21 in RNPC1a-dependent growth suppression, we generated multiple SW480 cell lines in which RNPC1a can be inducibly expressed but in which p21 and/or TAp73 was stably knocked down (Fig. 8A to C). As shown in Fig. 8A, p21 was knocked down in clones 10 and 15 whereas RNPC1a can be inducibly expressed. It should be noted that TAp73 was still expressed and induced by RNPC1a regardless of p21 knockdown (Fig. 8A, compare lanes 1, 3, and 5 with lanes 2, 4, and 6, respectively). As shown in Fig. 8B, TAp73 was knocked down in clones 38 and 46. Interestingly, despite the decreased expression of p21 by p73 knockdown, p21 was still increased by RNPC1a (Fig. 8B, compare lanes 1, 3, and 5 with lanes 2, 4, and 6, respectively). As shown in Fig. 8C, both TAp73 and p21 were knocked down in clones 30 and 64 but RNPC1a can be inducibly expressed. Furthermore, a colony formation assay was performed to measure the effects of p21, TAp73, or both on RNPC1a-mediated growth suppression. We showed that the number of colonies formed by SW480 cells was markedly suppressed by RNPC1a (Fig. 8D), which was obviously attenuated by knockdown of p21 (Fig. 8E) or TAp73 (Fig. 8F). Furthermore, knockdown of both p21 and TAp73 nearly abolished RNPC1a-dependent growth suppression (Fig. 8G). Similarly, we found that knockdown of p21 or TAp73 attenuated the growth suppression by RNPC1a in p53−/− HCT116 cells, whereas combined knockdown of p21 and TAp73 completely impaired this process (Fig. 8H to N).
Fig 8.

TAp73 along with p21 mediates RNPC1a-dependent growth suppression. (A to C) Western blots were prepared with extracts from SW480 cells in which p21, TAp73, or both were stably knocked down and RNPC1a was uninduced (—) or induced (+) for 3 days. The blots were then probed with antibodies against TAp73α, TAp73β, p21, RNPC1, and actin. (D to G) Left panels, a colony formation assay was performed with SW480 cells uninduced or induced to express RNPC1a (D), with SW480 cells in which p21 was stably knocked down and in which RNPC1a was uninduced or induced (E), with SW480 cells in which TAp73 was stably knocked down and in which RNPC1a was uninduced or induced (F), and with SW480 cells in which both p21 and TAp73 were stably knocked down and in which RNPC1a was uninduced or induced (G). Right panels, quantification of colonies shown in the left panels from three separate experiments. An asterisk indicates a significant difference (P < 0.05). (H to J) Western blots were prepared with extracts from p53−/− HCT116 cells in which p21 (H), TAp73 (I), or both (J) were stably knocked down and in which RNPC1a was uninduced (—) or induced (+) for 3 days. The blots were then probed with antibodies against TAp73α, p21, p130, RNPC1, and actin. (K to N) Left panels, a colony formation assay was performed with p53−/− HCT116 cells uninduced or induced to express RNPC1a (K), with p53−/− HCT116 cells in which p21 was stably knocked down and in which RNPC1a was uninduced or induced (L), with p53−/− HCT116 cells in which TAp73 was stably knocked down and in which RNPC1a was uninduced or induced (M), and with p53−/− HCT116 cells in which both p21 and TAp73 were stably knocked down and in which RNPC1a was uninduced or induced (N). Right panels, quantification of colonies shown in the left panels from three separate experiments. An asterisk indicates a significant difference (P < 0.05).
TAp73 along with p21 might mediate RNPC1a-induced premature senescence.
As shown above, TAp73, along with p21, mediates RNPC1a-dependent growth suppression by inducing cell cycle arrest (Fig. 7 and 8). Thus, we investigated whether the regulation of p73 by RNPC1a might play a role in premature cellular senescence, a state of permanent cell cycle arrest. We showed that ectopic expression of RNPC1a markedly increased the number of cells that stained positive with senescence-associated β-galactosidase (SA-β-Gal) (Fig. 9B) concomitantly with increased expression of senescence markers p130 and DEC1 (14) (Fig. 9A, compare lanes 1 and 3 with 2 and 4, respectively). However, the level of γ-H2A.X and promyelocytic leukemia protein (PML) was not altered by RNPC1 (data not shown). In addition, we showed that turning off RNPC1 expression for 2 days after 6 days of induction did not significantly reduce the number of senescent cells (Fig. 9C and D) or expression of p130 (Fig. 9E), suggesting that RNPC1a-induced premature senescence is irreversible. Next, to further confirm that RNPC1a induces senescence in the absence of p53, primary MEFs isolated from p53−/−; RNPC1+/+ and p53−/−; RNPC1−/− embryos were used for a senescence assay. We found that the loss of RNPC1 resulted in reduced expression of p130, p21, and γ-H2A.X (Fig. 9F, compare lanes 1 and 3 with 2 and 4, respectively) and consequently decreased numbers of SA-β-Gal-positive cells regardless of camptothecin treatment (Fig. 9G). In line with this, BrdU/PI staining indicated that RNPC1 deficiency led to increased numbers of cells in S phase in p53−/−; RNPC1−/− MEFs compared to those in p53−/−; RNPC1+/+ MEFs (Fig. 9H).
Fig 9.

RNPC1a induces premature senescence in the absence of p53. (A) The levels of RNPC1a, p130, DEC1, and actin were determined in SW480 cells uninduced (—) or induced (+) to express RNPC1a for 6 days. (B) Left panels, an SA-β-galactosidase (SA-β-Gal) staining assay was performed using cells treated as described for panel A. Right panels, quantification of the percentage of SA-β-Gal-positive cells as shown in the left panels. An asterisk indicates a significant difference (P < 0.05). (C) An SA-β-Gal staining assay was performed using SW480 cells without RNPC1 expression (left panel), with RNPC1 expression for 8 days (middle panel), or with RNPC1 expression for 6 days, followed by tetracycline withdrawal for 2 days (right panel). (D) Quantification of the percentage of SA-β-Gal-positive cells as shown in panel C. An asterisk indicates a significant difference (P < 0.05). (E) Western blots were prepared with extracts from SW480 cells treated as described for panel C and then probed with antibodies against RNPC1, TAp73α, TAp73β, p130, and actin. (F) Primary MEFs isolated from p53−/−; RNPC1+/+ and p53−/−; RNPC1−/− embryos at passage 9 were treated, or not treated, with 200 nM CPT for 12 h, and the levels of RNPC1, p21, p130, γ-H2A.X, and actin were measured. (G) Left panels, an SA-β-Gal staining assay was performed using primary MEFs treated as described for panel F. Right panels, quantification of the percentage of SA-β-Gal-positive cells as shown in the left panels. An asterisk indicates a significant difference (P < 0.05). (H) Loss of RNPC1 leads to increased cell numbers in S phase in p53−/−; RNPC1−/− MEFs compared to those in p53−/−; RNPC1+/+ MEFs. Primary MEFs isolated from p53−/−; RNPC1+/+ and p53−/−; RNPC1−/− embryos at passage 9 were treated, or not treated, with 100 nM CPT for 24 h and then used for BrdU/propidium iodide dual-parameter analysis as described in Materials and Methods.
Next, to determine the role of p73 in RNPC1a-induced senescence, an SA-β-Gal staining assay was performed by using SW480 cells in which RNPC1a can be inducibly expressed but in which TAp73 and/or p21 was stably knocked down. We found that knockdown of TAp73 greatly attenuated RNPC1a-induced premature senescence (Fig. 10C and D), whereas knockdown of p21 did so mildly (Fig. 10A and B). Importantly, knockdown of both TAp73 and p21 completely abolished RNPC1a-mediated premature senescence (Fig. 10E and F). Likewise, knockdown of p21 or TAp73 attenuated RNPC1a-induced premature senescence in p53−/− HCT116 cells, whereas combined knockdown of p21 and TAp73 nearly abrogated it (Fig. 10G to K).
Fig 10.

TAp73 along with p21 mediates RNPC1a-induced premature senescence. (A) The levels of RNPC1a, p130, DEC1, and actin were determined in SW480 cells in which p21 was stably knocked down and in which RNPC1a was uninduced or induced for 6 days. (B) Left panels, an SA-β-galactosidase (SA-β-Gal) staining assay was performed using cells treated as described for panel A. Right panels, quantification of the percentage of SA-β-Gal-positive cells as shown in the left panels. An asterisk indicates a significant difference (P < 0.05). (C) The experiment shown in panel A was performed as described except that SW480 cells in which TAp73 was stably knocked down and in which RNPC1a was inducibly expressed were used. (D) Left panels, an SA-β-Gal staining assay was performed using cells treated as described for panel C. Right panels, quantification of the percentage of SA-β-Gal-positive cells as shown in the left panels. An asterisk indicates a significant difference (P < 0.05). (E) The experiment shown in panel A was performed as described except that SW480 cells in which TAp73 and p21 were stably knocked down and in which RNPC1a was inducibly expressed were used. (F) Left panels, an SA-β-Gal staining assay was performed using cells treated as described for panel E. Right panels, quantification of the percentage of SA-β-Gal-positive cells as shown in the left panels. (G to J) An SA-β-Gal staining assay was performed with p53−/− HCT116 cells with inducible RNPC1a expression (G), with p53−/− HCT116 cells in which p21 was stably knocked down and in which RNPC1a was inducibly expressed (H), with p53−/− HCT116 cells in which TAp73 was stably knocked down and in which RNPC1a was inducibly expressed (I), and with p53−/− HCT116 cells in which p21 and TAp73 were stably knocked down and in which RNPC1a was inducibly expressed (J). (K) Quantification of the percentage of SA-β-Gal-positive cells shown in panels G to J. An asterisk indicates a significant difference (P < 0.05).
Since TAp73 could mediate RNPC1a-induced premature senescence, here we further explored whether overexpression of TAp73 alone could induce premature senescence. For this purpose, an SA-β-Gal staining assay was performed by using p53−/−; RNPC1−/− MEFs in which TAp73β was transiently overexpressed for 4 days. We found that overexpression of TAp73β was able to increase the number of SA-β-Gal-positive cells (Fig. 11A and B) and the expression of senescence markers, such as p130, p21, and γ-H2A.X (Fig. 11C), a result which is consistent with a previous report (9). Similarly, overexpression of RNPC1 was capable of inducing the senescence in p53−/−; RNPC1−/− MEFs; however, the capability of RNPC1 to induce senescence was weaker than that of TAp73β (Fig. 11A to C).
Fig 11.
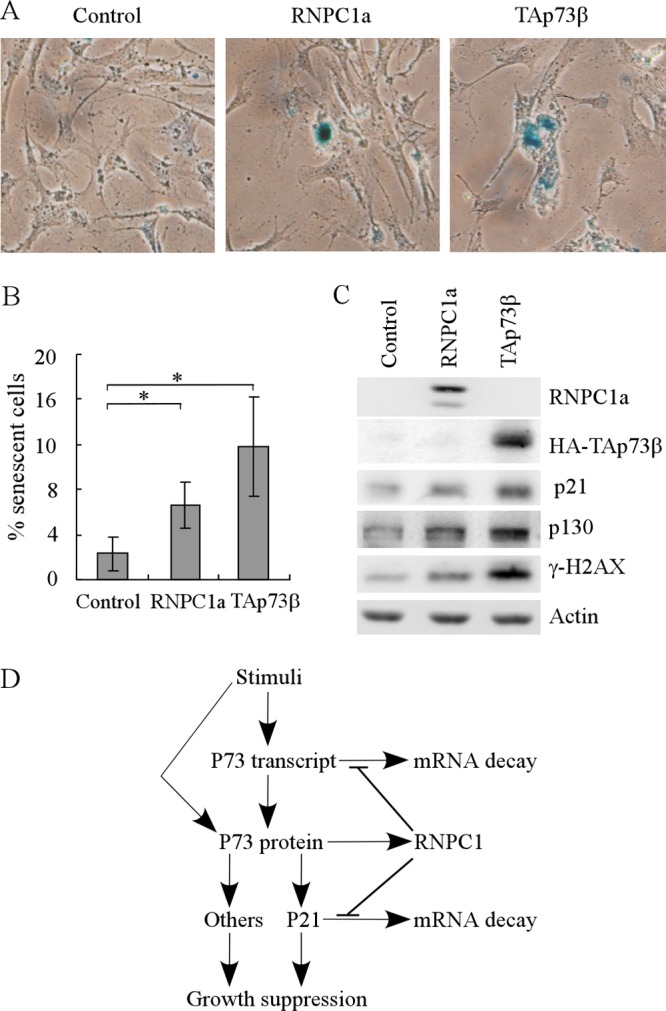
Overexpression of RNPC1a or TAp73β induces premature senescence in p53−/−; RNPC1−/− MEFs. (A) An SA-β-galactosidase (SA-β-Gal) staining assay was performed by using p53−/−; RNPC1−/− MEFs transfected with pcDNA3 (left panel), pcDNA3-RNPC1a (middle panel), or pcDNA3-HA-TAp73 β (right panel) for 4 days. (B) Quantification of the percentage of SA-β-Gal-positive cells as shown in panel A. An asterisk indicates a significant difference (P < 0.05). (C) Western blots were prepared with extracts from p53−/−; RNPC1−/− MEFs treated as described for panel A and then probed with antibodies against RNPC1, HA, p21, p130, γ-H2A.X, and actin. (D) Model of the RNPC1-p73 feed-forward loop.
DISCUSSION
Previously, we showed that RNPC1 is a target of the p53 family, including p73, and in turn, RNPC1 posttranscriptionally regulates the p53 family, including p53 and p63 (31, 44, 45). Here we further found that ectopic expression of p73 increases RNPC1 expression whereas knockdown of p73 decreases it (Fig. 1). Interestingly, we also found that knockdown of RNPC1 inhibits, but overexpression of RNPC1 increases, p73 expression by binding to and modulating p73 mRNA stability under both basal and stress conditions. In addition, RNPC1 directly binds to p21 mRNA and is required for maintaining both the basal and stress-induced levels of p21 transcripts (5, 19, 24, 31). Thus, our study reveals that the mutual regulation between p73 and RNPC1 represents a novel feed-forward loop (Fig. 11D). We postulate that in response to certain stress signals, p73 transcription is induced, which then activates expression of p73 target genes, including the p21 and RNPC1 genes. In turn, RNPC1 binds to and stabilizes p73 and p21 transcripts. As a result, the signaling cascade is amplified, which is required for proper induction of growth suppression and premature senescence in response to stimuli. Consistent with this, knockdown of TAp73 alone or in combination with knockdown of p21 inhibits the ability of RNPC1 to induce growth suppression and premature senescence (Fig. 8 and 10). Due to differential expression patterns for TAp73 and ΔNp73 in both normal and tumor cells, especially the overexpression of ΔNp73 observed in some tumor cells (17, 42), we postulate that overexpression of RNPC1 in some tumor cells promotes, rather than inhibits, tumor progression. Furthermore, since many genes are regulated by p73 and required for p73 activity in tumor suppression and neural development, it is likely that other p73 targets can be regulated by RNPC1. Thus, future studies are warranted to address these issues in order to fully understand the p73-RNPC1 loop, which might be explored as a target for tumors defective in the p53 pathway.
RNPC1 belongs to the RRM family of RNA-binding proteins, which includes musashi, HuR, U2AF65, and nucleolin. This family contains one or more canonical RRMs, which are each composed of 80 to 90 amino acids and form a highly conserved modular structure (RNP1 and RNP2) and several conserved aromatic residues (21, 46). RNPC1 contains one RRM. Here, we showed that RNPC1a without RNP1 or RNP2 has little, if any, effect on p73 expression regardless of treatment with camptothecin. This is consistent with the previous observations that RRM integrity is necessary for RNPC1 to regulate p53 translation and the stability of p21 and p63 transcripts (5, 31, 44, 45).
The RRM family of RNA-binding proteins is known to recognize a transcript with AU-rich elements (AREs) (22, 47). These elements are composed of various copies of the AUUUA pentamer or UUAUUUAUU nonamer (46). Indeed, an AU-rich element in p21 and p63 transcripts is found to be recognized by RRM-containing RNPC1 (5, 45). However, p73 transcripts do not contain an AU-rich element. Instead, RNPC1 directly binds to a CU-rich element and such an element is responsive to RNPC1 in vivo, as evidenced by increased luciferase activity when the p73 3′UTR is fused downstream of the luciferase mRNA (Fig. 6). This suggests that the RRM family of RNA-binding proteins may modulate its targets via a novel CU-rich element. However, we note that other sequences adjacent to the CU-rich element may be required for RNPC1 to bind to the p73 transcript. Nevertheless, we hypothesized that RNA transcripts with a CU-rich element, an ARE, or both, may be differentially regulated by RRM-containing RNA-binding proteins.
The RNPC1 gene is expressed as RNPC1a with 239 amino acids and as RNPC1b with 121 amino acids. RNPC1a and RNPC1b are identical in their N termini and share the same RRM except that RNPC1a contains extra 118 amino acids in its C terminus. Interestingly, we showed that RNPC1a, but not RNPC1b, is capable of increasing p73 expression. This indicates that the C-terminal 118 residues in RNPC1a are required for maintaining p73 mRNA stability, consistent with the previous observation that p21 mRNA stability is found to be regulated by RNPC1a but not RNPC1b (31). In contrast, the stability of p63 transcripts is found to be inhibited by both RNPC1a and RNPC1b (45). In addition, knockdown of RNPC1 leads to increased expression of ΔNp63 expression and subsequently the formation of cornified cell envelopes in HaCaT cells (45). These data suggest that RNPC1 is capable of stabilizing and destabilizing a transcript, most likely because of the presence of one or more RNPC1-responsive elements, i.e., CU-rich elements in p73 transcripts (this study), AU-rich elements in p21 transcripts (5), and AU- or U-rich elements in p63 transcripts (45), and the binding of other RNPC1-interacting proteins to the transcript, such as HuR (5).
ACKNOWLEDGMENTS
We thank S.-J. Cho for providing recombinant RNPC1 protein.
This work was supported in part by NIH grant RO1 CA081237.
Footnotes
Published ahead of print 16 April 2012
REFERENCES
- 1. Agami R, Blandino G, Oren M, Shaul Y. 1999. Interaction of c-Abl and p73alpha and their collaboration to induce apoptosis. Nature 399: 809–813 [DOI] [PubMed] [Google Scholar]
- 2. Bernassola F, et al. 2004. Ubiquitin-dependent degradation of p73 is inhibited by PML. J. Exp. Med. 199: 1545–1557 [DOI] [PMC free article] [PubMed] [Google Scholar]
- 3. Casciano I, et al. 2002. Expression of DeltaNp73 is a molecular marker for adverse outcome in neuroblastoma patients. Cell Death Differ. 9: 246–251 [DOI] [PubMed] [Google Scholar]
- 4. Chen X, Zheng Y, Zhu J, Jiang J, Wang J. 2001. p73 is transcriptionally regulated by DNA damage, p53, and p73. Oncogene 20: 769–774 [DOI] [PubMed] [Google Scholar]
- 5. Cho SJ, Zhang J, Chen X. 2010. RNPC1 modulates the RNA-binding activity of, and cooperates with, HuR to regulate p21 mRNA stability. Nucleic Acids Res. 38: 2256–2267 [DOI] [PMC free article] [PubMed] [Google Scholar]
- 6. Concin N, et al. 2004. Transdominant DeltaTAp73 isoforms are frequently up-regulated in ovarian cancer. Evidence for their role as epigenetic p53 inhibitors in vivo. Cancer Res. 64: 2449–2460 [DOI] [PubMed] [Google Scholar]
- 7. Corn PG, et al. 1999. Transcriptional silencing of the p73 gene in acute lymphoblastic leukemia and Burkitt's lymphoma is associated with 5′ CpG island methylation. Cancer Res. 59: 3352–3356 [PubMed] [Google Scholar]
- 8. Costanzo A, et al. 2002. DNA damage-dependent acetylation of p73 dictates the selective activation of apoptotic target genes. Mol. Cell 9: 175–186 [DOI] [PubMed] [Google Scholar]
- 9. Fang L, Lee SW, Aaronson SA. 1999. Comparative analysis of p73 and p53 regulation and effector functions. J. Cell Biol. 147: 823–830 [DOI] [PMC free article] [PubMed] [Google Scholar]
- 10. Flores ER, et al. 2005. Tumor predisposition in mice mutant for p63 and p73: evidence for broader tumor suppressor functions for the p53 family. Cancer Cell 7: 363–373 [DOI] [PubMed] [Google Scholar]
- 11. Gong JG, et al. 1999. The tyrosine kinase c-Abl regulates p73 in apoptotic response to cisplatin-induced DNA damage. Nature 399: 806–809 [DOI] [PubMed] [Google Scholar]
- 12. Harms K, Nozell S, Chen X. 2004. The common and distinct target genes of the p53 family transcription factors. Cell. Mol. Life Sci. 61: 822–842 [DOI] [PMC free article] [PubMed] [Google Scholar]
- 13. Harms KL, Chen X. 2006. The functional domains in p53 family proteins exhibit both common and distinct properties. Cell Death Differ. 13: 890–897 [DOI] [PubMed] [Google Scholar]
- 14. Helmbold H, Deppert W, Bohn W. 2006. Regulation of cellular senescence by Rb2/p130. Oncogene 25: 5257–5262 [DOI] [PubMed] [Google Scholar]
- 15. Ichimiya S, et al. 1999. p73 at chromosome 1p36.3 is lost in advanced stage neuroblastoma but its mutation is infrequent. Oncogene 18: 1061–1066 [DOI] [PubMed] [Google Scholar]
- 16. Irwin M, et al. 2000. Role for the p53 homologue p73 in E2F-1-induced apoptosis. Nature 407: 645–648 [DOI] [PubMed] [Google Scholar]
- 17. Irwin MS, et al. 2003. Chemosensitivity linked to p73 function. Cancer Cell 3: 403–410 [DOI] [PubMed] [Google Scholar]
- 18. Kaghad M, et al. 1997. Monoallelically expressed gene related to p53 at 1p36, a region frequently deleted in neuroblastoma and other human cancers. Cell 90: 809–819 [DOI] [PubMed] [Google Scholar]
- 19. Leveille N, et al. 2011. Selective inhibition of microRNA accessibility by RBM38 is required for p53 activity. Nat. Commun. 2: 513. [DOI] [PMC free article] [PubMed] [Google Scholar]
- 20. Liu G, Nozell S, Xiao H, Chen X. 2004. DeltaNp73beta is active in transactivation and growth suppression. Mol. Cell. Biol. 24: 487–501 [DOI] [PMC free article] [PubMed] [Google Scholar]
- 21. Lukong KE, Chang KW, Khandjian EW, Richard S. 2008. RNA-binding proteins in human genetic disease. Trends Genet. 24: 416–425 [DOI] [PubMed] [Google Scholar]
- 22. Mazan-Mamczarz K, et al. 2003. RNA-binding protein HuR enhances p53 translation in response to ultraviolet light irradiation. Proc. Natl. Acad. Sci. U. S. A. 100: 8354–8359 [DOI] [PMC free article] [PubMed] [Google Scholar]
- 23. Meyers S. 1999. Clostridium difficile colitis. Am. J. Gastroenterol. 94: 1115–1116 [DOI] [PubMed] [Google Scholar]
- 24. Miyamoto S, Hidaka K, Jin D, Morisaki T. 2009. RNA-binding proteins Rbm38 and Rbm24 regulate myogenic differentiation via p21-dependent and -independent regulatory pathways. Genes Cells 14: 1241–1252 [DOI] [PubMed] [Google Scholar]
- 25. Moll UM, Slade N. 2004. p63 and p73: roles in development and tumor formation. Mol. Cancer Res. 2: 371–386 [PubMed] [Google Scholar]
- 26. Murray-Zmijewski F, Lane DP, Bourdon JC. 2006. p53/p63/p73 isoforms: an orchestra of isoforms to harmonise cell differentiation and response to stress. Cell Death Differ. 13: 962–972 [DOI] [PubMed] [Google Scholar]
- 27. Peritz T, et al. 2006. Immunoprecipitation of mRNA-protein complexes. Nat. Protoc. 1: 577–580 [DOI] [PubMed] [Google Scholar]
- 28. Qian Y, Zhang J, Yan B, Chen X. 2008. DEC1, a basic helix-loop-helix transcription factor and a novel target gene of the p53 family, mediates p53-dependent premature senescence. J. Biol. Chem. 283: 2896–2905 [DOI] [PMC free article] [PubMed] [Google Scholar]
- 29. Rossi M, et al. 2005. The ubiquitin-protein ligase Itch regulates p73 stability. EMBO J. 24: 836–848 [DOI] [PMC free article] [PubMed] [Google Scholar]
- 30. Scoumanne A, Cho SJ, Zhang J, Chen X. 2011. The cyclin-dependent kinase inhibitor p21 is regulated by RNA-binding protein PCBP4 via mRNA stability. Nucleic Acids Res. 39: 213–224 [DOI] [PMC free article] [PubMed] [Google Scholar]
- 31. Shu L, Yan W, Chen X. 2006. RNPC1, an RNA-binding protein and a target of the p53 family, is required for maintaining the stability of the basal and stress-induced p21 transcript. Genes Dev. 20: 2961–2972 [DOI] [PMC free article] [PubMed] [Google Scholar]
- 32. Siu LL, Chan JK, Wong KF, Kwong YL. 2002. Specific patterns of gene methylation in natural killer cell lymphomas: p73 is consistently involved. Am. J. Pathol. 160: 59–66 [DOI] [PMC free article] [PubMed] [Google Scholar]
- 33. Stiewe T, Theseling CC, Putzer BM. 2002. Transactivation-deficient Delta TA-p73 inhibits p53 by direct competition for DNA binding: implications for tumorigenesis. J. Biol. Chem. 277: 14177–14185 [DOI] [PubMed] [Google Scholar]
- 34. Tomasini R, et al. 2008. TAp73 knockout shows genomic instability with infertility and tumor suppressor functions. Genes Dev. 22: 2677–2691 [DOI] [PMC free article] [PubMed] [Google Scholar]
- 35. Wilhelm MT, et al. 2010. Isoform-specific p73 knockout mice reveal a novel role for delta Np73 in the DNA damage response pathway. Genes Dev. 24: 549–560 [DOI] [PMC free article] [PubMed] [Google Scholar]
- 36. Yan W, Chen X. 2010. Characterization of functional domains necessary for mutant p53 gain of function. J. Biol. Chem. 285: 14229–14238 [DOI] [PMC free article] [PubMed] [Google Scholar]
- 37. Yan W, Chen X. 2006. GPX2, a direct target of p63, inhibits oxidative stress-induced apoptosis in a p53-dependent manner. J. Biol. Chem. 281: 7856–7862 [DOI] [PubMed] [Google Scholar]
- 38. Yan W, Chen X. 2009. Identification of GRO1 as a critical determinant for mutant p53 gain of function. J. Biol. Chem. 284: 12178–12187 [DOI] [PMC free article] [PubMed] [Google Scholar]
- 39. Yan W, Chen X. 2007. Targeted repression of bone morphogenetic protein 7, a novel target of the p53 family, triggers proliferative defect in p53-deficient breast cancer cells. Cancer Res. 67: 9117–9124 [DOI] [PubMed] [Google Scholar]
- 40. Yang A, et al. 2000. p73-deficient mice have neurological, pheromonal and inflammatory defects but lack spontaneous tumours. Nature 404: 99–103 [DOI] [PubMed] [Google Scholar]
- 41. Yuan ZM, et al. 1999. p73 is regulated by tyrosine kinase c-Abl in the apoptotic response to DNA damage. Nature 399: 814–817 [DOI] [PubMed] [Google Scholar]
- 42. Zaika AI, et al. 2002. DeltaNp73, a dominant-negative inhibitor of wild-type p53 and TAp73, is up-regulated in human tumors. J. Exp. Med. 196: 765–780 [DOI] [PMC free article] [PubMed] [Google Scholar]
- 43. Zhang J, Chen X. 2008. Posttranscriptional regulation of p53 and its targets by RNA-binding proteins. Curr. Mol. Med. 8: 845–849 [DOI] [PMC free article] [PubMed] [Google Scholar]
- 44. Zhang J, et al. 2011. Translational repression of p53 by RNPC1, a p53 target overexpressed in lymphomas. Genes Dev. 25: 1528–1543 [DOI] [PMC free article] [PubMed] [Google Scholar]
- 45. Zhang J, Jun Cho S, Chen X. 2010. RNPC1, an RNA-binding protein and a target of the p53 family, regulates p63 expression through mRNA stability. Proc. Natl. Acad. Sci. U. S. A. 107: 9614–9619 [DOI] [PMC free article] [PubMed] [Google Scholar]
- 46. Zhang T, Kruys V, Huez G, Gueydan C. 2002. AU-rich element-mediated translational control: complexity and multiple activities of trans-activating factors. Biochem. Soc. Trans. 30: 952–958 [DOI] [PubMed] [Google Scholar]
- 47. Zou T, et al. 2006. Polyamine depletion increases cytoplasmic levels of RNA-binding protein HuR leading to stabilization of nucleophosmin and p53 mRNAs. J. Biol. Chem. 281: 19387–19394 [DOI] [PubMed] [Google Scholar]