

Abstract
Shiga toxin-producing Escherichia coli (STEC) is a food-borne pathogen with a low infectious dose that colonizes the colon in humans and can cause severe clinical manifestations such as hemolytic-uremic syndrome. The urease enzyme, encoded in the STEC chromosome, has been demonstrated to act as a virulence factor in other bacterial pathogens. The NH3 produced as urease hydrolyzes urea can aid in buffering bacteria in acidic environments as well as provide an easily assimilated source of nitrogen that bacteria can use to gain a metabolic advantage over intact microflora. Here, we explore the role of urease in STEC pathogenicity. The STEC urease enzyme exhibited maximum activity near neutral pH and during the stationary-growth phase. Experiments altering growth conditions performed with three phylogenetically distinct urease-positive strains demonstrated that the STEC ure gene cluster is inducible by neither urea nor pH but does respond to nitrogen availability. Quantitative reverse transcription-PCR (qRT-PCR) data indicate that nitrogen inhibits the transcriptional response. The deletion of the ure gene locus was constructed in STEC strain 88-0643, and the ure mutant was used with the wild-type strain in competition experiments in mouse models to examine the contribution of urease. The wild-type strain was twice as likely to survive passage through the acidic stomach and demonstrated an enhanced ability to colonize the intestinal tract compared to the ure mutant strain. These in vivo experiments reveal that, although the benefit STEC gains from urease expression is modest and not absolutely required for colonization, urease can contribute to the pathogenicity of STEC.
INTRODUCTION
Shiga toxin-producing Escherichia coli (STEC) is an enteric pathogen that colonizes the colon in humans and causes a variety of symptoms ranging from mild diarrhea to bloody diarrhea or the more severe renal pathology of hemolytic uremic syndrome, sometimes followed by death (17). In the first two STEC genomes sequenced, those of the O157:H7 EDL933 strain and O157:H7 Sakai strain, a genomic island containing, among other genes, ureDABCEFG, a cluster of genes coding for the enzyme urease and its accessory proteins, was identified (12, 39). Subsequently, many other STEC strains, including a wide variety of serotypes, have been found to carry the ure gene cluster (9, 35, 36, 46). Urease, which hydrolyzes the substrate urea to form CO2 and two molecules of NH3 (29), has been demonstrated to contribute to virulence in several other bacterial species (1, 5–8, 25, 43). The NH3 produced raises the pH of the cytoplasm, thereby buffering the bacteria under acidic environmental conditions. In addition, the NH3 provides the bacterial cell with an easily assimilated source of nitrogen. Despite the fact that STEC has been recognized as an emergent pathogen since 1982 (42), virtually no information about the regulation of the ure genes and how they contribute to pathogenicity in this important pathogen is available.
Neither STEC strain EDL933 nor the Sakai strain exhibits a urease-positive phenotype in vitro. Various environmental conditions were tested for induction of urease activity for both strains, but none were successful in conferring urease activity (13). Most STEC strains exhibit a urease-negative phenotype in vitro, and it was later discovered that the STEC Sakai strain carries a single nucleotide substitution in ureD that results in early truncation of the UreD chaperone protein due to replacement of a glutamine codon with an amber codon (34). The UreD protein has been demonstrated to be essential for activation of the urease apoprotein (29), and we have previously demonstrated that the single nucleotide polymorphism (SNP) in ureD abrogates urease activity (46). An identical SNP was found in other STEC O157:H7 isolates and was believed to be the basis for the urease-negative phenotype in all phenotypically urease-negative STEC strains (34). However, our previous work in which a more phylogenetically diverse set of STEC strains was examined has demonstrated that this SNP is not as widespread as was thought and appears to be restricted to a branch of the STEC O157:H7 phylogenetic cluster, along with a subset of STEC O111 isolates. Furthermore, an additional SNP that we identified in the Sakai strain, resulting in the substitution of a leucine for a proline at position 38 in the UreD protein and contributing to the lack of urease activity, was determined to be phylogenetically restricted to a branch of the STEC O157:H7 isolates (46). These results indicate that many STEC strains carry genes encoding a urease enzyme that should function appropriately under inducing conditions, possibly in vivo in the human or animal host, and may provide a significant survival advantage.
Although it could be advantageous for STEC to express higher levels of urease under certain environmental circumstances, constitutive high-level expression could be damaging in some situations due to elevated cytoplasmic pH and would most certainly be an unnecessary metabolic burden. Urease expression is constitutive for some bacterial species; however, most species have a method of regulating expression of the ure genes based on an environmental stimulus (29). In our previous work, we have demonstrated that SNPs in ureD affect the urease activity but that there must also be some trans-acting factor yet to be identified that is affecting the level of urease activity (46). Elucidation of the method of regulation of urease expression in STEC could help in determining the role urease plays in STEC pathogenesis.
Cattle are the natural reservoir for STEC, where the bacteria asymptomatically colonize the rectoanal-junction mucosa of the intestinal tract (44), but other farm animals have also been found to harbor STEC in the intestinal tract (11). STEC is primarily a food-borne pathogen passed from the farm environment to humans via insufficiently cooked beef products (2, 18, 38, 49) or leafy greens contaminated with animal fecal matter (15, 20, 28). Interestingly, compared to other pathogenic E. coli strains, STEC has an extremely low infectious dose that has been determined to be less than 10 to 100 bacterial cells in some cases (22, 38, 48–50). This low infectious dose poses a major public health concern, since large outbreaks of STEC disease can occur from small amounts of contamination. The presence of the ure locus in the STEC genome but not in most other E. coli pathotypes raises the possibility that expression of the urease enzyme contributes to the low infectious dose.
Food-borne enteric pathogens must survive passage through the stomach and have the ability to adhere and colonize the gastrointestinal tract. Factors expressed by the bacteria that aid in this process contribute to the pathogenicity of the bacteria. Previous studies involving transit of bacteria through the mouse stomach have experimentally demonstrated the relation between gastric acid, infectious dose, and susceptibility to infection by bacteria that gain access to the host via the oral route (47). The low infectious dose displayed by STEC cannot be explained by the known acid resistance systems in E. coli, since they are present even in other E. coli pathotypes, for example, enteropathogenic E. coli, which has an infectious dose over 8 orders of magnitude greater than that of STEC (21, 22). In fact, it has been reported that the ability of STEC to resist acid challenge is not superior to that of other E. coli, but those reports were from in vitro experiments and did not utilize urea in the growth medium, as urease-expressing strains were not commonly described previously (19, 21). The possibility arises that STEC, like some other bacteria, may exploit urease as an additional factor to aid in surviving the low pH conditions of the stomach. The urease enzyme has been demonstrated to aid bacteria in surviving the low pH in the stomach and is considered a virulence factor for several bacteria, including Helicobacter pylori (6, 8), Yersinia enterocolitica (7), and Brucella abortus (1, 43). In addition to enhancing survival during stomach passage, expression of urease may aid enteric bacteria in colonization of the intestines, where they encounter short-chain fatty acids and microbes are competing for nitrogen. Previous work involving the enteric pathogen Klebsiella pneumoniae has demonstrated in a mouse model that a ΔureA mutant was attenuated in its ability to colonize the mouse intestine relative to the wild-type strain (25).
In this work, we determine the pH optimum of the STEC urease enzyme and demonstrate that STEC regulates transcription of the ure gene cluster in response to environmental nitrogen levels. We also demonstrate by utilizing STEC in mouse models that urease expression can play a role in STEC pathogenesis by both enhancing survival during stomach transit and enhancing colonization of the gastrointestinal tract.
MATERIALS AND METHODS
Bacterial strains and growth conditions.
The bacterial strains and plasmids used in this study are listed in Table 1. E. coli was cultured in Luria-Bertani (LB) broth or on LB agar plates for construction of mutants and extraction of genomic DNA (gDNA). For urease expression experiments, the STEC was cultured at 37°C in low-glucose Dulbecco's modified Eagle medium (DMEM) supplemented with 10 μM NiCl2. Antibiotics were used at the following concentrations where appropriate: ampicillin (Ap) at 100 μg/ml, chloramphenicol (Cm) at 20 μg/ml, and kanamycin (Km) at 50 μg/ml. For determination of urease activity when STEC was cultured under different environmental conditions, additions were made to the NiCl2-supplemented DMEM. Addition of 50 mM HEPES was used for growth at pH 7.5, and 100 mM MES (morpholineethanesulfonic acid) was added for growth at pH 5.5. NH4Cl was added at a concentration of 50, 100, or 200 mM, and NaCl or (NH4)2SO4 was added at a concentration of 100 mM.
Table 1.
Bacterial strains and plasmids used in this study
| Strain or plasmid | Relevant characteristic(s) | Reference or source |
|---|---|---|
| E. coli strains | ||
| SM10λpir | λpir lysogen of SM10, recA RP4-2-Tc::Mu Km | 45 |
| TOP10 | F− mcrA recA1 araD139 Δ(ara leu) endA1 | Invitrogen |
| STEC strains | ||
| 88-0643 | Clinical isolate with serotype O5:NM, Kmr | Kaper laboratory collection |
| 88-0643 Δure | Kmr, Cmr, urease locus deletion mutant of 88-0643 | This study |
| Mo28 | Serotype O157:H7 | 13 |
| 537/89 | Bovine isolate with serotype O84:NM | Kaper laboratory collection |
| Plasmids | ||
| pKD3 | Cmr cassette flanked by FRT sites | 4 |
| pKD46 | Apr, RepA101(Ts), λ, γ, β, and exo expressed from an araBAD promoter | 4 |
| pENTR/SD/D-TOPO | Cloning vector | Invitrogen |
| pGRG37 | For insertion of genes at attTn7 site on chromosome | 27 |
| pGRGure | pGRG37 with cloned wild-type ure locus | This study |
Construction of STEC 88-0643 ure deletion mutant and complemented strains.
The primer sequences for all PCR experiments are reported in Table 2. A ure gene locus deletion strain, STEC 88-0643 Δure, in which the ureDABCEFG genes were replaced with a Cm resistance cassette, was constructed using Lambda Red-mediated recombination (4, 32). The mutant was constructed such that the entire ure locus was deleted except for the 5′-most 222 bp of ureD in order to preserve the promoter region for the gene transcribed in the opposite direction just upstream of the ure locus. Primers UREP1B and UREP2, each of which included a 40-bp flanking region, were used on a pKD3 template for this procedure. Plasmid pKD46 was used for expression of the Red recombinase system (4, 32). The ure gene cluster deletion was verified by sequencing. A complemented strain, STEC 88-0643 Δure attTn7::ure, was constructed by insertion of the entire STEC 88-0643 wild-type ure locus with the native promoter into the attTn7 site on the chromosome of the STEC 88-0643 Δure mutant strain by making use of the transposition method developed by McKenzie and Craig (27). The ure locus, along with 274 bp upstream, was PCR amplified from STEC 88-0643 gDNA with primer set 88CF and 88CR and ligated into pENTR/SD/D-TOPO. The resulting plasmid was used in a reaction with pGRG37 to flip the ure locus sequence into pGRG37, yielding plasmid pGRGure. Attempts to electroporate pGRGure into the STEC 88-0643 Δure mutant strain were unsuccessful, necessitating the use of conjugation. For this, pGRGure was transferred into chemically competent E. coli strain SM10λpir, which was then used in matings at 30°C with the STEC 88-0643 Δure mutant strain. The procedure outlined by McKenzie and Craig (27) was followed on the exconjugates carrying pGRGure to insert the ure locus into the chromosmal attTn7 site of the STEC 88-0643 Δure strain. Insertion of the ure locus was confirmed by PCR using the primer set 88Tn7F and 88Tn7R, which anneal to the 5′ and 3′ sides of the attTn7 site of the STEC 88-0643 strain, along with PCR of the ure locus insertion by the use of primers 88CF and 88CR.
Table 2.
Oligonucleotide sequences used in this study
| Primer | Sequence (5′–3′) |
|---|---|
| UREP1B | GGTGGTATCGTCGGCGGTGACGAACTCATCATCAA |
| CGCAAGTGTAGGCTGGAGCTGCTTC | |
| UREP2 | AAGGGGCCGCCTGCCGGCCCTGATACAGAGGATGTTGTGAATATGAATATCCTCCTTAG |
| 88CF | CACCTTGCAGACCAGTCAGTGACTC |
| 88CR | TTACTTACCAGCATGCCC |
| 88Tn7F | ATATGCCGGTTATCGTCGTTG |
| 88Tn7R | AGGAATAGTACACCAAAGAGACGG |
| ureDRTF | GTCATCATGTCGGTCTGCTCAC |
| ureDRTR | TCAGCGTATGGCAATCAGAGTC |
| FRTrpoA | GCGCTCATCTTCTTCCGAAT |
| RRTrpoA | CGCGGTCGTGGTTATGTG |
Quantitative urease assay.
Urease activity was quantified using a previously described colorimetric assay based on reaction of phenol-hypochlorite with ammonia released during urea hydrolysis (52). Overnight cultures were concentrated by centrifugation, washed twice with 50 mM HEPES buffer (pH 7.5), resuspended in the same buffer, and lysed using a French press. The total protein concentration in the lysates was determined using a Bio-Rad DC protein assay, per manufacturer specifications, with bovine serum albumin as the standard. A lysate volume containing 50 μg of protein was combined with an assay buffer consisting of 50 mM HEPES (pH 7.5) and 25 mM urea. Ammonium chloride standards were also prepared in the assay buffer. After incubation of the lysates and NH4Cl standards in the assay buffer at 37°C, ammonia released upon urea hydrolysis (or contained in the NH4Cl standards) was measured by addition of an aliquot to a tube containing solution A (1% [wt/vol] phenol, 170 μM sodium nitroprusside) followed by solution B (125 mM NaOH, 0.05% [wt/vol] NaOCl). Tubes were incubated at 37°C for 30 min, and absorbances were measured at a wavelength of 625 nm. Ammonia concentrations for the lysates were determined by comparison to a standard curve based on absorbances of the standards, and the urease activity was calculated as nanomoles of NH3 per minute per milligram of protein, where the minute values refer to the incubation time of the lysate in the assay buffer. Urease activities reported are from three or more independent cultures, with each measurement for a culture consisting of an average of the values determined at two time points during urea hydrolysis. To determine the optimal pH for the STEC urease enzyme, the quantitative urease assay was performed using phosphate assay buffers with a range of pH values. The buffers were adjusted to have final concentrations of 20 mM phosphate and 25 mM urea. Aliquots of overnight cultures were washed with sterile H2O and resuspended for the French press using sterile H2O rather than HEPES buffer to avoid addition of the HEPES (pH 7.5) buffer into the assay buffers as the lysate was added during the urease assay. Except for the use of the different assay buffers, the urease assay was performed as described above.
qRT-PCR.
Cultures for quantitative reverse transcription-PCR (qRT-PCR) were incubated for 18 h in low-glucose DMEM supplemented with 10 μM NiCl2. RNAprotect (Qiagen) was added to the cultures followed by concentration by centrifugation at 3,700 × g for 10 min. RNA was extracted using an RNeasy minikit (Qiagen) and treated at least twice with DNase I. The absence of contaminating DNA was confirmed by PCR analysis using primers specific for ureD, ureDRTF and ureDRTR (Table 2). RNA concentrations were measured using an ND-1000 Spectrophotometer (NanoDrop). One-step qRT-PCR was performed using a QTaq One-Step qRT-PCR SYBR kit (Clontech) and a Chromo 4TM real-time detector (MJ Research/Bio-Rad). The 25-μl qRT-PCR mixtures contained 50 ng of RNA and were prepared as described by the manufacturer. All qRT-PCRs were carried out in triplicate on RNA extracted from at least three independent cultures. The following conditions for cDNA synthesis and amplification were used: 1 cycle at 48°C for 20 min, 1 cycle at 95°C for 3 min, and 40 cycles at 95°C for 15 s and 60°C for 60 s. Fluorescence was monitored as products were heated from 50°C to 90°C to verify template specificity by melting curve analysis. Transcripts encoding the target gene, ureD, and the reference gene, rpoA, were detected using primer pair ureDRTF and ureDRTR and primer pair FRTrpoA and RRTrpoA (51), respectively (Table 2). MJ Opticon Monitor analysis software version 3.1 (Bio-Rad) was used for data collection. The relative expression levels of the ureD gene for cultures grown in medium with added NH4Cl compared to those with no added NH4Cl were calculated using the Pfaffl method (40).
In vitro acid challenge.
Medium for the acid challenge experiments was prepared by using HCl to adjust the pH of low-glucose DMEM supplemented with 10 μM NiCl2 to a value of 2, 3, or 4. This challenge medium was prepared both with and without 10 mM urea. An aliquot of 10 μl of an overnight culture grown in NiCl2-supplemented low-glucose DMEM was added to 10 ml of prewarmed acid challenge medium and shaken at 37°C for 30 min. Serial dilutions of this culture were plated on LB plates. Enumeration of colonies on these plates compared to those growing on plates of serial dilutions of the overnight culture yielded percent survival rates.
Mouse stomach passage experiments.
The STEC 88-0643 wild-type, STEC 88-0643 Δure mutant, and STEC 88-0643 Δure attTn7::ure complemented strains were cultured for 18 h in low-glucose DMEM supplemented with 10 μM NiCl2. For the inoculum dose of 109 CFU, 10 ml of the overnight culture was concentrated by centrifugation, resuspended in 10 ml of sterile H2O, concentrated again, and then resuspended in 1 ml of H2O. Sterile H2O was used to avoid any buffering effect from the medium used to prepare the inoculum. The optical density at 600 nanometers (OD600) of the suspensions was measured, and concentrations of the two strains to be subjected to competition were equalized by addition of H2O to the more concentrated suspension. The two suspensions were then mixed in a 1:1 ratio and loaded into syringes for the inoculation. Serial dilutions of the mixed inoculum were plated on both LB Km and LB Cm agar plates for determination of the specific inoculum concentrations used in each experiment. The mouse stomach passage experiments paralleled those described previously for evaluating the contribution of the enzyme urease to survival during transit through the mouse stomach (7, 43, 47). Groups of 4-week-old female BALB/c mice (Charles River Laboratories) were fasted overnight and then inoculated intragastrically by oral gavage with 200 μl of inoculum prepared as described above. After inoculation, the mice were returned to their cage for 90 min to allow the bacteria to pass through the stomach. The mice were then euthanized by CO2 asphyxiation followed by cervical dislocation. The entire small intestine, including lumen contents, was removed aseptically and homogenized in 5 ml of phosphate-buffered saline (PBS). The homogenate was serially diluted and plated on both LB Km and LB Cm to determine the number of viable STEC 88-0642, Δure mutant, or Δure attTn7::ure bacteria complemented. The STEC 88-0643 wild-type strain is Km resistant, and both the Δure and Δure attTn7::ure strains were made Cm resistant as described above; therefore, numbers of viable Δure mutant and Δure attTn7::ure complemented bacteria were determined from the colony counts on LB Cm plates and viable wild-type bacteria were determined by subtracting colony counts on LB Cm plates from those obtained on LB Km plates after adjusting for plate dilution.
Mouse colonization experiments.
These experiments closely follow those described previously for STEC colonization experiments in mice (30). Six-week-old female BALB/c mice (Charles River Laboratories) were housed in cages of three mice each. Food was removed from the cages the evening before inoculation, and water was removed approximately 2 h prior to inoculation. For final inoculum doses of 108 CFU and 109 CFU, 10 ml of the overnight culture was concentrated by centrifugation, resuspended in 10 ml of sterile H2O, and concentrated again. Pellets were resuspended in 10 ml of H2O or 1 ml of H2O for inocula of 108 or 109 CFU, respectively. For a final inoculum dose of 1010 CFU, 150 ml of culture was concentrated, washed with 100 ml of H2O, and resuspended in 1.5 ml of H2O. The inoculum was administered by intragastric oral gavage in a volume of 200 μl. Access to food and water was restored immediately following bacterial challenge. For each day after bacterial infection, mice were weighed and fresh feces samples were collected from each mouse individually. Feces samples were diluted 1:10 by weight into PBS and homogenized using a sterile wooden stick, followed by centrifugation for 1 s to pellet large debris. Undiluted and/or serially diluted suspensions were plated on both LB Km and LB Cm plates to determine CFU per g of feces for both the 88-0643 wild-type and Δure strains. This same procedure for feces collection and processing was performed the day before inoculation in order to confirm that each mouse was free of Kmr and Cmr bacteria prior to use in the experiment. On day 7, after feces collection, mice were euthanized by CO2 asphyxiation followed by cervical dislocation. The small intestine, cecum, and colon were aseptically removed and homogenized in 5, 2, and 2 ml of PBS, respectively. The homogenates were serially diluted and plated to determine the numbers of viable 88-0643 wild-type and Δure bacteria separately colonizing these organs. After the initial experiments to determine optimal inoculum dose, only the cecum and colon were removed. The competitive index was calculated as either CFU per gram of feces or CFU per gram of tissue for wild-type and Δure mutant STEC strains for experiments in which both the wild-type and Δure mutant STEC strains were detected.
RESULTS
STEC urease enzyme has optimal activity near neutral pH.
Since other bacterial ureases have been found to exhibit optimal enzyme activity at low pH (55), we examined whether this is a mechanism of regulation for the STEC urease enzyme by determining the pH for optimal STEC enzyme activity. Cultures of two different phylogenetically distinct urease-positive STEC strains, STEC Mo28 and STEC 88-0643, were used for these experiments (46). Lysates of these cultures were used to quantify the urease activity at pH values 3 through 9. The STEC urease enzyme was observed to exhibit maximum urease activity at pH 8 for both strains tested (Fig. 1).
Fig 1.
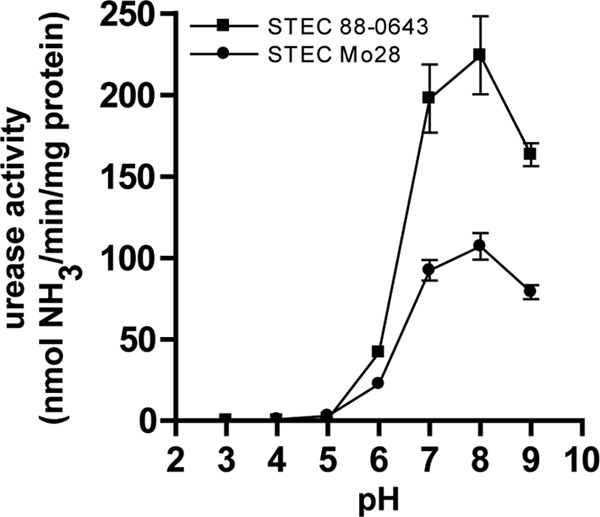
Determination of optimal pH for the STEC urease enzyme. Cultures were incubated overnight in DMEM supplemented with NiCl2, washed with sterile water, and used in quantitative urease assays with PBS buffers adjusted to the various pH values. The results are plotted as means of the results of three biological replicate experiments performed for each strain.
Urease activity increases throughout the exponential-growth phase.
Growth-phase induction of acid resistance has been reported for the urease-producing bacteria Yersinia enterocolitica, where survival to acid challenge increased during late exponential growth and was maximal during the stationary phase (7). This result suggests that urease activity increases with growth phase in Y. enterocolitica. We were interested in determining the growth-phase dependence of urease activity for STEC. During growth of the STEC 88-0643 strain, the OD600 was recorded at defined time points and aliquots were retained for performing the quantitative urease assay. The resulting measured urease activities overlaid on the growth curve demonstrate that the urease activity increased throughout the exponential phase (Fig. 2). The urease activity remained high in the stationary phase, as demonstrated at the final time point of 24 h. This result validates the use of the 18-h cultures used for many of the experiments in this work.
Fig 2.
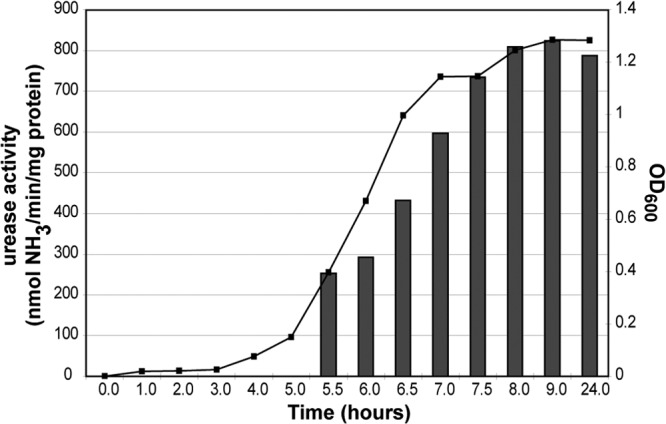
Correlation between growth and urease activity. Cultures of STEC 88-0643 were incubated overnight and then diluted 1,000-fold in DMEM supplemented with NiCl2. Growth was monitored periodically by measuring the OD600 (curve), and aliquots were removed from the culture and used in the quantitative urease assay (bars). A representative graph from one of three biological replicates is depicted.
Urease activity is affected by nitrogen availability in growth medium.
Since urease production in a number of bacterial species is controlled through the nitrogen regulation system, we sought to determine whether the STEC ure gene locus is also nitrogen regulated. For these experiments, NH4Cl was added to the medium and the medium was buffered at pH 7.5 to prevent the possible contribution of pH change to the urease activity. Addition of NH4Cl to the nitrogen-poor DMEM increases the concentration of nitrogen in the medium and provides a source of nitrogen that can be more easily assimilated by the bacteria. The urease activity was measured for STEC 88-0643 cultures containing 0, 50, 100, and 200 mM NH4Cl. The results, depicted in Fig. 3A, clearly demonstrate the dose-dependent decrease in urease activity upon addition of NH4Cl to the medium. To conclusively demonstrate that the decrease in urease activity was due to the addition of ammonium ion rather than a response to chloride ion or changing osmolarity of the growth medium, cultures containing either NaCl or (NH4)2SO4 at 100 mM were also tested. The resulting urease activities, demonstrating no change upon addition of NaCl and decreased activity for added (NH4)2SO4 compared to no addition, are consistent with what would be expected for a response to ammonium ion (Fig. 3A). Although a response to nitrogen availability was observed, testing for change in urease activity with changes in other environmental conditions was undertaken, since some bacterial species have been observed to respond to more than one environmental stimulus. Buffered cultures of STEC 88-0643 were grown in the presence of 10 mM urea, and the urease activity was quantified. No statistical difference in urease activity compared to cultures grown without added urea was observed (Fig. 3A), indicating that expression of the ure gene locus in STEC is not induced by urea. The urease activity was also quantified for buffered cultures of STEC 88-0643 grown in medium at pH 5.5. Again, no difference was observed when cultures grown at pH 7.5 were compared to these (Fig. 3A); thus, a decrease in pH did not induce higher urease activity. The response of the STEC ure gene locus to nitrogen is not strain specific. Along with STEC O5:NM strain 88-0643, strains STEC O84:NM 537/89 and STEC O157:H7 Mo28 were tested for urease activity after growth in medium supplemented with 100 mM NH4Cl, and these other strains also exhibited a decrease in urease activity with addition of NH4Cl (Fig. 3B). Furthermore, as was observed for the response of the STEC ure gene locus to nitrogen, the lack of response to pH was not strain specific (Fig. 3B).
Fig 3.

Response of STEC ure gene cluster to different environmental conditions. (A) Cultures were incubated in buffered NiCl2-supplemented DMEM for 18 h. The medium was also supplemented with NH4Cl, NaCl, (NH4)2SO4, or urea or adjusted to pH 5.5 as indicated, and the quantitative urease assay was performed for STEC 88-0643. (B) Comparison between STEC strains 88-0643, 537/89, and Mo28. (C) Aliquots of the STEC 88-0643 cultures grown for use in the quantitative urease assay were taken for RNA extraction followed by qRT-PCR using ureD as the target gene. Relative mRNA expressions were calculated for cultures containing NH4Cl compared to no added NH4Cl. For all experiments, the results include means and standard errors based on at least three biological replicates. The results for each of the different sets of growth conditions were compared to the result for growth in medium buffered at pH 7.5 and containing no added chemicals, and P values were calculated using the Student t test and are indicated as follows: *, P < 0.01; **, P < 0.001; ***; P < 0.0001; and ****, P > 0.2.
Response to nitrogen availability is transcriptionally regulated.
Given that the STEC ure gene locus is responsive to nitrogen concentration, quantitative reverse transcription-PCR (qTR-PCR) experiments were performed to determine if this regulation is transcriptional in nature. Aliquots of the same STEC 88-0643 cultures that were used for quantifying the urease activity were used for RNA extraction for this purpose. The qRT-PCR was performed using ureD as the target gene, since it is the first gene in the locus, and the housekeeping gene, rpoA, was used as a reference gene. Normalizing to the culture with no added NH4Cl, it can be seen that there was an approximately 5-fold reduction in transcript upon addition of ammonium ion to the culture medium (Fig. 3C).
Wild-type STEC does not have a greater survival rate than the Δure mutant during in vitro acid challenge.
It has been reported that other urease-expressing bacteria exhibit enhanced survival during in vitro acid challenge in medium containing urea compared to their isogenic ure deletion mutants (1, 7, 43, 55). Of the urease-positive strains in our collection, the STEC 88-0643 strain exhibits the greatest urease activity in vitro, and we were interested in determining whether this strain would exhibit superior survival compared to its isogenic ure locus deletion mutant in acid challenge tests. Cultures of STEC 88-0643 wild-type and Δure strains were incubated overnight in DMEM supplemented with NiCl2 and then used for survival challenge experiments performed with DMEM supplemented with NiCl2, either with or without 3.4 mM urea, and adjusted to pH 2, 3, or 4. The wild-type strain did not display enhanced survival under acidic conditions compared to the ure deletion mutant (data not shown). In these experiments, bacteria were in the challenge medium for 30 min; thus, we sought to discover whether a longer challenge time would impact the results. The experiment was repeated with medium containing urea and adjusted to pH 3, but with a challenge time of 120 min, and still no difference between the survival rates of the wild-type and ure deletion mutant was observed. In addition, increasing the concentration of urea to 10 mM in the pH 3 challenge medium did not lead to enhanced survival of the wild-type strain (data not shown).
Wild-type STEC 88-0643 exhibits enhanced survival in comparison to the Δure mutant during passage through the mouse stomach.
To investigate the role urease plays in survival of STEC as it passes through the stomach, a wild-type STEC strain and its isogenic ure gene cluster deletion mutant were compared in a stomach transit mouse model. It has not been shown whether urease expression is induced in vivo in STEC strains that have a urease-negative phenotype in vitro. The STEC O5:NM 88-0643 strain was chosen for these experiments, because it displays a urease-positive phenotype in vitro. The STEC 88-0643 wild-type strain and isogenic Δure mutant were used in competition experiments after growth overnight separately in DMEM supplemented with NiCl2. Since initial experiments revealed considerable mouse-to-mouse variation, rather than using different mice for the individual STEC strains tested, inoculation with a mixed culture was used to reduce the contribution to the results due to individual differences among mice. Percent survival of each of the two strains competed was calculated for individual mice, and the competitive index was calculated by dividing the wild-type strain percent survival by that of the Δure mutant. The wild-type bacteria outcompeted the Δure mutant bacteria, with an mean competitive index calculated to be 2.1 and a P value of 0.0002, indicating that the competitive index is statistically different from a value of 1 (Fig. 4). A complemented strain was constructed by inserting the ure locus with the native promoter in the Tn7 site on the chromosome of the Δure mutant strain. This method of complementation was chosen to obtain a stable single-copy-number expression-complemented strain to mimic wild-type expression conditions as closely as possible. The quantitative urease assay was performed on the 88-0643 Δure attTn7::ure complemented strain, yielding 919 ± 32 nmol of NH3/min/mg of protein, which is similar to the value found for the wild-type strain (Fig. 3A). The STEC 88-0643 Δure attTn7::ure complemented strain was used in competition with wild-type 88-0643 in mouse stomach passage experiments as described above for the wild-type strain/Δure mutant strain competitions. The wild-type and complemented strains survived at similar rates, with a mean competitive index calculated to be 0.89 and a P value of 0.42, indicating that the calculated competitive index is not significantly different from a value of 1 (Fig. 4); thus, the wild-type and complemented strains survived transit through the mouse stomach equally well.
Fig 4.
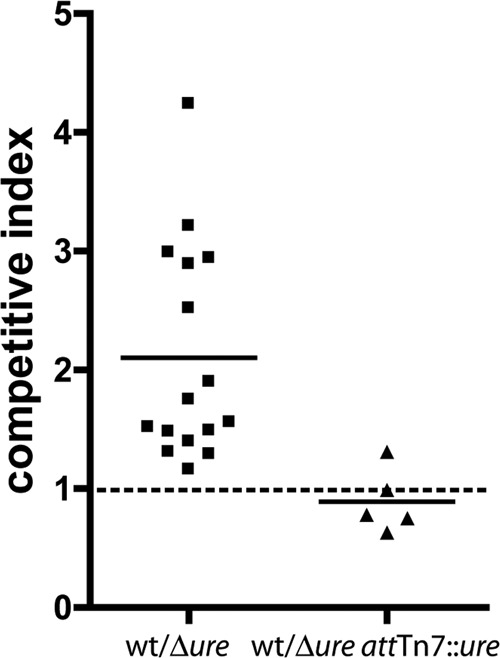
Mouse stomach transit competition experiments using STEC 88-0643 wild-type, Δure mutant, and Δure attTn7::ure complemented strains. Cultures of the strains to be tested were incubated separately overnight and administered to mice in a 1:1 ratio by oral gavage. The number of viable bacteria in the small intestine after 90 min was determined by selective plating. Percent survival rates were calculated and used to determine the competitive index. The competitive index for the wild-type/Δure mutant challenge was calculated to have a mean of 2.1 (horizontal bar), which was determined using the Student t test to be significantly different from a value of 1 (horizontal dashed line), with P = 0.0002. For the wild-type/Δure attTn7::ure challenge, the mean was 0.89 (horizontal bar), with P = 0.42, indicating that the mean is not significantly different from a value of 1.
Determination of STEC 88-0643 optimal inoculum dose for mouse colonization experiments.
To assess the contribution of urease expression to colonization of the gastrointestinal tract, the wild-type STEC 88-0643 strain and its isogenic Δure mutant were used in colonization experiments using a mouse model. These experiments were performed as competition studies between the strains, thereby minimizing the contribution of individual mouse variation to the results. Since the strains were tested in the mouse model in competition, competitive growth experiments were first executed in vitro. The wild-type and Δure mutant strains grew equally well together in DMEM (data not shown), verifying that the Δure mutant does not have a growth deficiency when cultured in the presence of the wild-type strain. Some strains of STEC are better able to colonize a particular type of mouse than others, and there is also variation in the ability to colonize different types of mice by the same STEC strain (31). Therefore, an important first step in our experiments was to determine the optimal STEC 88-0643 inoculum dose to use for the 6-week-old female BALB/c mice we used for our studies.
In determining the optimal inoculum dose, both percent mouse survival and duration of colonization need to be considered. We sought to use the lowest inoculum dose that would still confer colonization for most mice for the 7-day duration of the experiment. Initially, 3 mice were each administered one of three different mixed inocula; one group of 3 was inoculated with a dose of 108 CFU, another group with 109 CFU, and a control group was administered sterile H2O. We monitored both survival and colonization of these mice. Percent mouse survival is depicted in Fig. 5A, where it can be observed that the control mice and the mice inoculated with 108 CFU all survived for 7 days; however, one of the mice given 109 CFU did not survive past the first day. For the duration of the experiment, no STEC bacteria were detected in the feces of the control mice, and STEC was detected only in the feces of the mice administered 108 CFU for 2 days. One of the surviving mice inoculated with 109 CFU did not display detectable STEC in its feces past day 2, and by day 5 the level of STEC in the feces of the other mouse was also below the level of detection.
Fig 5.
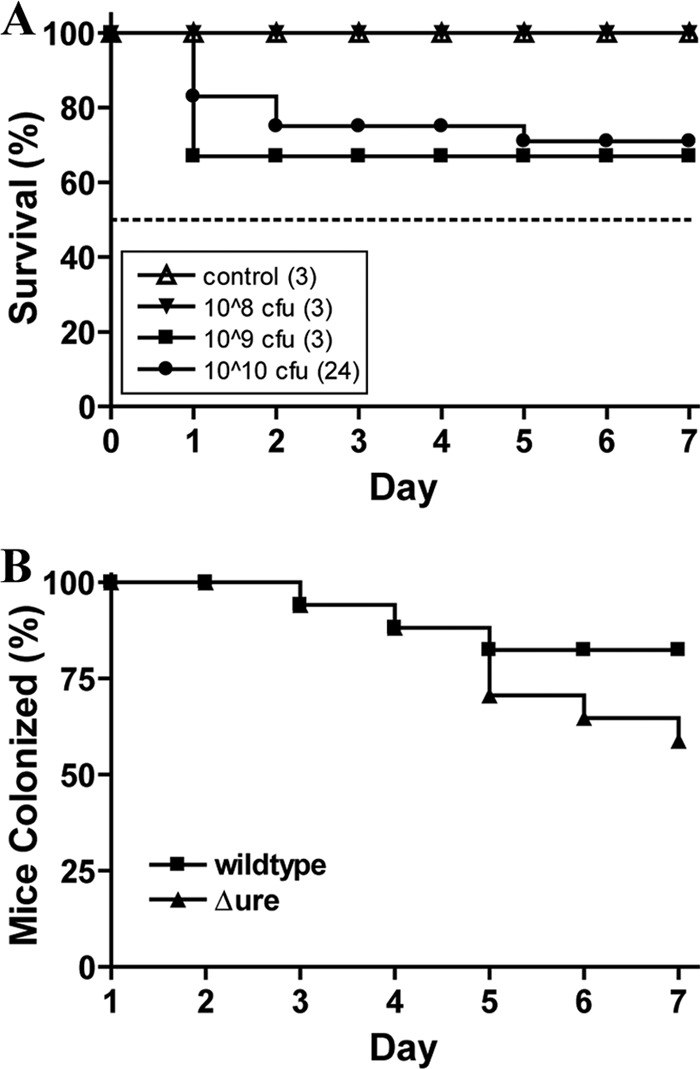
Determination of the optimal dose for STEC 88-0643 in BALB/c mice with intact intestinal flora. A mixture of wild-type STEC 88-0643 and Δure mutant in a 1:1 ratio was administered intragastrically to 6-week-old female BALB/c mice. (A) The number of surviving mice was recorded for 7 days postinfection and plotted as percent survival for groups of 3 mice each that were inoculated with H2O, 108 CFU, or 109 CFU bacteria and for the total of 24 mice receiving 1010 CFU bacteria. (B) For the groups of mice inoculated with 1010 CFU, the numbers of mice that remained colonized with wild-type STEC 88-0643 and the Δure mutant were recorded for 7 days after the inoculation. The results are depicted as percent mice colonized, where 100% corresponds to the 17 mice that survived from the total of 24 administered the 1010 CFU dose.
Since the mice that received a dose of 109 CFU STEC 88-0643 did not appear to be colonized, or at least appeared not to have been colonized for the 7-day postinfection period for which we sought to compare the colonization abilities, we increased the mixed inoculum dose to 1010 CFU. Initial experiments performed with 6 mice appeared promising, so a total of 24 mice were used for the experiments at this dose. As depicted in Fig. 5A, 17 of the 24 mice (71%) survived for the duration of the experiment. The percentages of mice colonized with each of the wild-type strains and Δure mutant strains are shown in Fig. 5B for each day. By 7 days postinfection, 14 of the 17 surviving mice (82%) remained colonized with the wild-type strain compared to colonization in 10 of the 17 mice (59%) by the Δure mutant strain.
Wild-type STEC 88-0643 more highly colonizes the mouse gastrointestinal tract than the Δure mutant.
Since the optimal inoculum dose was determined to be 1010 CFU for STEC strain 88-0643 in BALB/c mice, for consistency the analysis is reported with only the results from the mice administered the 1010 CFU dose. Mice were monitored each day for weight, and fresh feces samples were collected from the mice individually. The number of CFU per gram of feces was determined for both the wild-type and Δure mutant strains for each mouse, and these values were averaged for each day and are plotted in Fig. 6A, where day 1 represents 24 h after inoculation. It is clear from these results that after day 3 the STEC had colonized the gastrointestinal tract of the mice and that the wild-type strain colonized to a greater extent than the isogenic Δure mutant strain.
Fig 6.

Colonization of BALB/c mice by wild-type STEC O5:NM strain 88-0643 and its isogenic Δure gene cluster deletion mutant in competition experiments. Mice were inoculated intragastrically with 1010 CFU of a 1:1 mixture of the wild-type and Δure mutant strains, and feces samples were collected daily for 7 days postinfection. The colonization levels of the wild-type strain and Δure mutant were determined by selective plating of the feces. (A) The results are plotted as means and standard errors of the mean for 17 mice. The level of colonization by the wild-type strain was significantly higher than that by the Δure mutant strain for each of the 7 days following inoculation, as determined using the Wilcoxon signed-rank test (P = 0.015 for day 2 and P < 0.0006 for all other days). (B) The competitive index was calculated as the level of colonization of the wild-type strain divided by the level of colonization of the Δure mutant strain for each mouse. Mice for which colonization by the Δure mutant could no longer be detected are not included in this analysis. The competitive index is plotted for each of the 7 days following inoculation on day zero, and the horizontal bars represent the median values. For each day postinfection, the median was significantly different from a value of 1, with P values calculated using the Wilcoxon signed-rank test and reported in Table 3.
Comparing the levels of colonization of the wild-type and Δure mutant strains in terms of the competitive index reveals further information. These results are depicted in Fig. 6B, where the competitive index calculated as the number of CFU per gram of feces for the wild type divided by the number of CFU per gram of feces for the Δure mutant strains for each mouse is shown for each of the 7 days after inoculation. The competitive index was calculated only for those mice still colonized with both strains. Except for day 2, for each individual mouse the competitive index was found to be >1 for all days. Upon inspection of these graphs in Fig. 6B, it can be clearly seen that, for each day after the large number of STEC cells passed through the gastrointestinal tract of the mouse, leaving behind the colonizing bacterial cells, the spread in the data becomes much greater. Calculating the mean of the competitive index gives a skewed result because of the few extremely large values for the competitive index compared to the more closely clustered values of the majority of the data points. Therefore, it is more instructive to consider the median values for the competitive index in comparing day-to-day results and to determine if the median value (rather than the mean) is statistically significantly different from a value of 1 in calculating P values. Table 3 lists the mean and median competitive index values along with the P value calculated using the Wilcoxon signed-rank test.
Table 3.
Competitive index for mice inoculated with a 1:1 mixture of wild-type STEC 88-0643 and Δure mutant
| Day | No. of mice colonized with wild type | No. of mice colonized with Δure | CIa |
P valueb | |
|---|---|---|---|---|---|
| Mean | Median | ||||
| 1 | 17 | 17 | 2.28 | 2.23 | 0.0002 |
| 2 | 17 | 17 | 3.38 | 2.33 | 0.0014 |
| 3 | 16 | 16 | 9.44 | 5.33 | <0.0001 |
| 4 | 15 | 15 | 99.52 | 7.25 | 0.0006 |
| 5 | 14 | 12 | 54.46 | 13.51 | 0.0005 |
| 6 | 14 | 11 | 389.1 | 11.70 | 0.002 |
| 7 | 14 | 10 | 139.9 | 12.98 | 0.0078 |
CI (competitive index) calculated as CFU per gram of feces for wild-type strain/Δure mutant. Mice for which colonization by the Δure mutant could no longer be detected are not included in this analysis.
P values were calculated using the Wilcoxon signed-rank test.
Wild-type STEC 88-0643 outcompetes the Δure mutant in both the cecum and colon.
Since we were interested in determining whether urease expression results in enhanced colonization by STEC, we sought to evaluate the ability of the STEC 88-0643 wild-type and Δure mutant strains to colonize the gastrointestinal organs directly rather than relying solely on numbers of bacteria shed in the feces. After collection of feces on day 7, the small intestine, cecum, and colon (tissues with contents) were harvested and the number of bacteria associated with each of the tissues was determined. STEC was recovered from the small intestine of only the most highly colonized mouse, and in an almost undetectable quantity (less than 100 CFU/g of tissue) for the first few mice tested; thus, for the remainder of the mice, only the cecum and colon were removed and tested. The competitive index based on CFU recovered per gram of tissue for the wild-type strain divided by the number determined for the Δure mutant indicates that both the cecum and colon harbored more of the wild-type urease-expressing strain than the Δure mutant strain (Fig. 7). In all of the mice, the wild-type strain demonstrated enhanced colonization over the Δure strain. The mean competitive index values were calculated to be 13 for the cecum and 16 for the colon. These values are generally consistent with the median values found in the feces after STEC colonization had been established in the mice in the later time periods (days 5, 6, and 7). It was noted that the colon was just slightly more highly colonized than the cecum, with a mean value of colonization by the wild-type bacteria determined to be 3.0 × 10⁴ CFU/g of tissue for the colon compared to 1.3 × 10⁴ CFU/g of tissue for the cecum.
Fig 7.
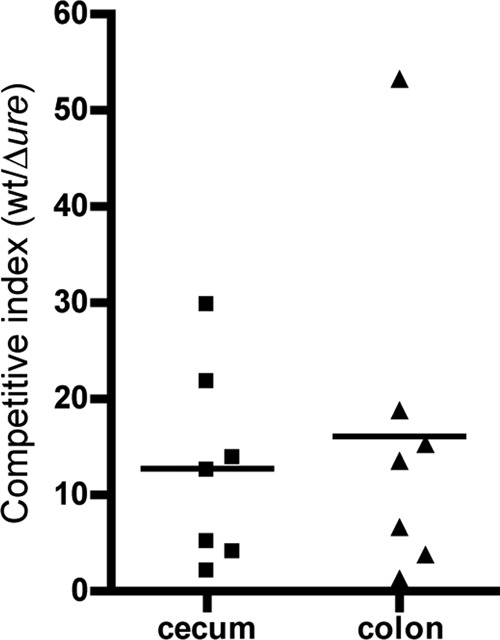
Levels of colonization of the cecum and colon by the wild-type EHEC 88-0643 and Δure mutant strains 7 days postinfection. BALB/c mice were inoculated with a 1:1 mixture of wild-type STEC 88-0643 and its isogenic Δure mutant. Seven days after inoculation, the cecums and colons were removed from the mice and the viable bacteria of each of the two strains associated with the tissues enumerated. The competitive index (CI) was calculated for both tissues, and the results of a Student two-tailed t test demonstrate that the mean CI is significantly different from 1, with P = 0.022 for the cecum. The P value for the colon was calculated to be 0.063; however, the CI was >1 for all mice in both the cecum and colon.
DISCUSSION
There are a variety of methods by which urease-producing bacteria regulate the breakdown of urea, and in this work we sought to determine the method STEC uses to regulate urease enzyme activity. This was accomplished mainly by altering the growth environment with conditions found to activate higher ure gene locus expression in other bacteria. These conditions include reduced pH, the presence of urea, and adjusted nitrogen concentration. In addition, the growth phase itself was found to have an effect on STEC urease activity, with activity increasing throughout exponential growth, becoming maximum at the beginning of the stationary phase, and remaining high in the stationary phase (Fig. 2).
Proteus mirabilis and Vibrio parahaemolyticus carry urea-inducible ure gene clusters (5, 37). These bacteria possess a gene that is upstream of the locus but transcribed in the opposite direction that codes for a transcriptional activator, UreR, that binds the ure gene locus promoter region in the presence of urea in the environment. Although there is a gene transcribed in the opposite direction upstream of the ure gene cluster in STEC, it does not have protein sequence homology to the known urea-inducible activators. In fact, a homolog to this activator has not been identified anywhere in the STEC genome; thus, our finding that growth in medium containing urea does not result in increased urease activity compared to growth in medium without urea is not surprising.
Although some bacteria exhibit higher urease activity resulting from a transcriptional response to acidic conditions, our results demonstrate that STEC urease activity does not change with growth in medium at pH 5.5. In addition, the wild-type STEC 88-0643 strain did not demonstrate superior survival upon acid challenge compared to its isogenic ure gene cluster deletion mutant. Acid shock experiments involving the pathogen Klebsiella pneumonia, which colonizes the human intestinal tract, display results similar to those seen with STEC, where the wild-type and Δure mutant strains demonstrate identical abilities to survive acid challenge at pH 3 (25). This is despite the fact that, like the STEC 88-0643 wild-type strain, K. pneumoniae has a basal level of urease gene transcription. Brucella abortus urease mutants, however, do display a dose-dependent increase of in vitro acid susceptibility compared to the wild-type strain when urea is present in the acid challenge medium (43). This same effect is also seen with Brucella suis (1). It could be that the in vitro level of urease activity in the STEC 88-0643 strain, about 10-fold less than in the Brucella species, is not high enough to result in enhanced acid tolerance.
Three bacterial species, Yersinia enterocolitica, Morganella morganii, and Lactobacillus fermentum, are known to exhibit higher urease activity in acidic pH than neutral pH; however, this increased activity is not due to increased transcription but rather to the fact that the enzyme itself has greater activity at pH values closer to 5.5 (55). Our results demonstrate that the STEC urease enzyme has optimal activity at pH close to 8 (Fig. 1). The three bacterial urease enzymes that displayed greater activity at lower pH have two substitutions in UreC, the structural protein containing the active site, which other bacterial ureases do not possess. These amino acid changes, occurring just one and seven residues from the catalytic histidine (amino acid [aa] 38), are postulated to be the cause of the lower pH optimum (55). We looked for these substitutions, L31F and H39N, in a Ure protein sequence alignment performed previously (46) and found that the STEC UreC does not have either of these substitutions; therefore, our result is consistent with our expectation that the STEC urease would not exhibit optimum activity at low pH.
The experiments involving addition of NH4Cl to the nitrogen-poor DMEM growth medium in this work demonstrate that the STEC ure gene cluster is nitrogen regulated (Fig. 3A). Many bacterial ure gene clusters are nitrogen regulated, and this is not surprising, since the hydrolysis of the substrate urea yields ammonia, the most preferred and easily assimilated source of nitrogen for synthesis of biomolecules. Under nitrogen-starved environmental conditions where urea is available, bacteria that produce a urease enzyme have a metabolic advantage. To further confirm that the STEC ure gene cluster is nitrogen responsive, but not pH inducible, two additional strains were tested for urease activity in response to both addition of NH4Cl to the growth medium and reduction of the growth medium pH to 5.5. These strains, STEC Mo28 and STEC 537/89, are located in different phylogenetic clusters from the STEC 88-0643 strain and from each other in a phylogenetic analysis based on housekeeping genes (46). Although the strains display different levels of urease activity in DMEM at pH 7.5, the urease activity is sensitive to nitrogen availability but not pH inducible, demonstrating that the dependence of urease activity on ammonia concentration is not strain specific. This result was not unexpected, since the 670 bp upstream of the ureD gene share 100% DNA identity in these strains along with several others for which we sequenced this region (46), and we have demonstrated that the response to environmental nitrogen occurs transcriptionally (Fig. 3C).
In enteric bacteria, low intracellular levels of glutamine signal nitrogen deficiency and initiate the coordinated response to nitrogen limitation, the nitrogen-regulated response, during which the nitrogen regulatory protein C (NtrC) is activated (56). Phosphorylated NtrC has been shown to directly bind the ure gene cluster promoter in both Rhodobacter capsulatus (26) and Pseudomonas putida (14), whereas in some bacteria, including E. coli and Klebsiella species, NtrC binds the promoter of the gene nac (24, 41, 56). It has been reported that in Klebsiella pneumoniae, Nac binds the ure gene locus promoter, thereby enhancing activation (10, 23). Two deletion strains, one deleting glnG (ntrC in STEC) and the other deleting nac constructed in the STEC 88-0643 strain, however, exhibit no difference in quantitative urease activity response compared to wild-type STEC 88-0643 during growth in either DMEM or DMEM with NH4Cl added (unpublished data). It is not unusual for bacteria with nitrogen-regulated ure loci to exhibit at least a low level of constitutive urease activity. Although expression of urease activity is induced 10-fold in response to nitrogen starvation, urease activity in Mycobacterium tuberculosis is easily measured in nitrogen-rich medium (3). Along with nitrogen-responsive ure loci, Bacillus subtilis and Pseudomonas putida are reported to exhibit low-level constitutive expression (14, 54). Regulation of urease in Klebsiella pneumoniae has been studied extensively, and it has been demonstrated that there are two promoters upstream of the ure gene cluster (23). The proximal promoter has an absolute requirement for Nac, and transcription from this promoter occurs only in a nitrogen-limiting environment. The distal promoter is Nac independent, and there is low-level constitutive expression, but urease activity increases 2- to 3-fold when bacteria are cultured under nitrogen-limiting conditions. This response by K. pneumoniae to nitrogen availability that is not mediated by either NtrC or Nac is similar to what we have observed for STEC. Furthermore, we have demonstrated that this response in STEC is transcriptional, as was also shown for the K. pneumoniae distal promoter (23).
Stomach acidity acts as a barrier to food-borne enteric pathogens such as STEC. As the capability of a pathogen to survive the acid environment of the stomach increases, the chance of intestinal colonization increases. The level of in vitro urease activation is not as great for STEC as that seen with some other nitrogen-regulated bacterial ureases, but the in vivo urease activity is not known. We demonstrate in this work performed with STEC 88-0643 wild-type and Δure mutant strains that urease does contribute to STEC survival as the pathogen transits the acid environment of the stomach. The competitive index (wild-type strain/Δure mutant) of 2 that was determined for STEC mouse stomach transit is lower than the value of 10 found for Y. enterocolitica (7) and B. abortus (43) pathogens. Although the STEC wild-type strain was only twice as likely on average as the urease mutant to survive stomach transit, the competitive index (Fig. 4) reveals that the wild-type strain had enhanced survival in every mouse tested. To further validate that this result was due only to lack of urease expression, we constructed a complemented strain to use in stomach transit experiments. These experiments involving a competition between the wild-type and ure complemented strains demonstrate that the two strains survive passage through the mouse stomach in equal numbers (Fig. 4). Together with the in vitro acid challenge experiments, our results suggest expression of the STEC ure gene cluster in vivo, even if not to a great extent. Another possibility that cannot be eliminated is that the role of urease in enhancing survival through the stomach is not based on acid resistance.
After surviving the acidic barrier of the stomach, enteric pathogens must compete with microbes already adhering to the intestine to be capable of colonizing. For our STEC colonization experiments, we chose to use the intact commensal flora mouse model even though higher inoculum doses must be used than for germfree or streptomycin-treated mice because we wanted to mimic most closely the intestinal microbiological conditions STEC would encounter in the host. The infectious dose for STEC is much higher in mice than humans; nevertheless, differences in levels of STEC colonization between strains can be determined using mouse models. Since we had observed that the STEC ure gene cluster responds to environmental nitrogen availability (Fig. 3), we hypothesized that STEC may be taking advantage of the ammonia produced upon hydrolysis of urea to enhance its ability to colonize the colon as it competes with the intact commensal flora. Our results demonstrate that, in fact, wild-type STEC 88-0643 is better able to colonize the mouse gastrointestinal tract than the STEC 88-0643 Δure mutant strain (Fig. 6). Despite the mouse-to-mouse variation seen in the data, the competitive index was >1 for all mice each day except day 2. The wild-type strain outcompeted the Δure mutant by a factor of approximately 13 in mice remaining colonized with both strains in our model. However, for some mice the Δure mutant could not be detected after 5 days even though the mice remained colonized with the wild-type strain (Fig. 5B); thus, urease expression enhances colonization ability to an even greater extent in some mice.
Since our results reveal that the wild-type STEC 88-0643 strain is twice as likely to survive passage through the stomach as the Δure mutant, it would not be surprising to find the level of intestinal colonization of the urease-producing wild-type strain to be twice that of the Δure mutant even if the two strains had equal abilities to colonize. The results, therefore, showing that the wild-type strain outcompetes the Δure mutant by a factor of 13 or has an even greater ability to colonize in some mice such that the Δure mutant is no longer detected conclusively demonstrate that urease does play a role in enhanced colonization ability. The results reveal that for the first 2 days postinoculation, the mouse feces contain twice as many viable wild-type as Δure mutant bacteria (Table 3 and Fig. 6). The shedding during these 2 days most likely consists greatly of the inoculum moving through the gastrointestinal tract in a large quantity, and then by around day 3 or 4 shedding is more representative of actual intestinal colonization levels. The competitive index of approximately 2 seen for the first 2 days of the colonization experiments is consistent with our result from the stomach transit experiments.
From the few reported STEC colonization experiments in mice, it is clear that the colonization sites in mice include both the cecum and colon. Different investigations have reported either more or less colonization in the cecum than the colon, but the levels are typically close (31). In our experiments, the colon and cecum were colonized to similar levels, with the mean CFU per gram of tissue just slightly higher in the colon for both the wild-type and Δure mutant strains. Our data also indicate that the competitive advantages that the wild-type strain experiences due to urease expression are similar in the cecum and colon of the mouse.
In summary, STEC appears to gain a survival advantage through urease expression during stomach transit. However, although urease expression contributes to the survival of STEC as it passes through the acidic environment of the stomach, our results clearly reveal that expression of urease alone is not responsible for the extremely low infectious dose noted for STEC strains in comparison to other E. coli pathotypes. Thus, there must be a contribution from some other as-yet-unidentified factor resulting in the low infectious dose. If the only benefit to expression of urease were the fact that STEC bacterial cells are twice as likely to survive stomach transit, one might wonder whether the metabolic burden of maintaining the ure locus is worth the gain. However, we demonstrate that expression of urease also enhances the ability of STEC to colonize the intestinal tract, a situation where STEC is competing with intact microflora and can gain a metabolic advantage by producing an easily assimilated source of nitrogen. Considering the enhanced colonization by the wild-type strain relative to the ure mutant that was observed, our result demonstrating the nitrogen-regulated transcriptional response of the ure locus is not surprising. It is also possible that urease expression contributes to the ability to resist the negative effects of organic acids encountered in the colon. The competitive indices obtained from the mouse experiments reveal that the benefits STEC gains from urease expression in survival during stomach transit and colonization ability in the intestinal tract are modest. However, our results demonstrate that although urease is not absolutely required for pathogenicity, it does contribute to the intestinal colonization of STEC. Also, it is quite likely that urease expression is enhanced in vivo, which would explain why even STEC strains displaying an in vitro urease-negative phenotype maintain the entire ure gene cluster with a high level of sequence conservation.
ACKNOWLEDGMENTS
This research was supported by NIH grants AI21657 and DK58957 to J.B.K. For part of the time this research was conducted, S.R.S. was a trainee under Institutional Training Grant T32AI007540 from NIAID.
The content is solely the responsibility of the authors and does not necessarily represent the official views of NIAID or NIH.
Footnotes
Published ahead of print 4 June 2012
REFERENCES
- 1. Bandara AB, et al. 2007. Brucella suis urease encoded by ure1 but not ure2 is necessary for intestinal infection of BALB/c mice. BMC Microbiol. 7:57 doi:10.1186/1471-2180-7-57 [DOI] [PMC free article] [PubMed] [Google Scholar]
- 2. Bell BP, et al. 1994. A multistate outbreak of Escherichia coli O157:H7-associated bloody diarrhea and hemolytic uremic syndrome from hamburgers. The Washington experience. JAMA 272:1349–1353 [PubMed] [Google Scholar]
- 3. Clemens DL, Lee BY, Horwitz MA. 1995. Purification, characterization, and genetic analysis of Mycobacterium tuberculosis urease, a potentially critical determinant of host-pathogen interaction. J. Bacteriol. 177:5644–5652 [DOI] [PMC free article] [PubMed] [Google Scholar]
- 4. Datsenko KA, Wanner BL. 2000. One-step inactivation of chromosomal genes in Escherichia coli K-12 using PCR products. Proc. Natl. Acad. Sci. U. S. A. 97:6640–6645 [DOI] [PMC free article] [PubMed] [Google Scholar]
- 5. Dattelbaum JD, Lockatell CV, Johnson DE, Mobley HL. 2003. UreR, the transcriptional activator of the Proteus mirabilis urease gene cluster, is required for urease activity and virulence in experimental urinary tract infections. Infect. Immun. 71:1026–1030 [DOI] [PMC free article] [PubMed] [Google Scholar]
- 6. Davis GS, Flannery EL, Mobley HL. 2006. Helicobacter pylori HP1512 is a nickel-responsive NikR-regulated outer membrane protein. Infect. Immun. 74:6811–6820 [DOI] [PMC free article] [PubMed] [Google Scholar]
- 7. De Koning-Ward TF, Robins-Browne RM. 1995. Contribution of urease to acid tolerance in Yersinia enterocolitica. Infect. Immun. 63:3790–3795 [DOI] [PMC free article] [PubMed] [Google Scholar]
- 8. Ernst FD, et al. 2005. The nickel-responsive regulator NikR controls activation and repression of gene transcription in Helicobacter pylori. Infect. Immun. 73:7252–7258 [DOI] [PMC free article] [PubMed] [Google Scholar]
- 9. Friedrich AW, et al. 2006. Urease genes in non-O157 Shiga toxin-producing Escherichia coli: mostly silent but valuable markers for pathogenicity. Clin. Microbiol. Infect. 12:483–486 [DOI] [PubMed] [Google Scholar]
- 10. Frisch RL, Bender RA. 2010. Properties of the NAC (nitrogen assimilation control protein)-binding site within the ureD promoter of Klebsiella pneumoniae. J. Bacteriol. 192:4821–4826 [DOI] [PMC free article] [PubMed] [Google Scholar]
- 11. Grauke LJ, et al. 2002. Gastrointestinal tract location of Escherichia coli O157:H7 in ruminants. Appl. Environ. Microbiol. 68:2269–2277 [DOI] [PMC free article] [PubMed] [Google Scholar]
- 12. Hayashi T, et al. 2001. Complete genome sequence of enterohemorrhagic Escherichia coli O157:H7 and genomic comparison with a laboratory strain K-12. DNA Res. 8:11–22 [DOI] [PubMed] [Google Scholar]
- 13. Heimer SR, et al. 2002. Urease of enterohemorrhagic Escherichia coli: evidence for regulation by Fur and a trans-acting factor. Infect. Immun. 70:1027–1031 [DOI] [PMC free article] [PubMed] [Google Scholar]
- 14. Hervás AB, Canosa I, Little R, Dixon R, Santero E. 2009. NtrC-dependent regulatory network for nitrogen assimilation in Pseudomonas putida. J. Bacteriol. 191:6123–6135 [DOI] [PMC free article] [PubMed] [Google Scholar]
- 15. Hilborn ED, et al. 1999. A multistate outbreak of Escherichia coli O157:H7 infections associated with consumption of mesclun lettuce. Arch. Intern. Med. 159:1758–1764 [DOI] [PubMed] [Google Scholar]
- 16. Reference deleted.
- 17. Kaper JB, Nataro JP, Mobley HL. 2004. Pathogenic Escherichia coli. Nat. Rev. Microbiol. 2:123–140 [DOI] [PubMed] [Google Scholar]
- 18. Karch H, Bielaszewska M, Bitzan M, Schmidt H. 1999. Epidemiology and diagnosis of Shiga toxin-producing Escherichia coli infections. Diagn. Microbiol. Infect. Dis. 34:229–243 [DOI] [PubMed] [Google Scholar]
- 19. King T, Lucchini S, Hinton JC, Gobius K. 2010. Transcriptomic analysis of Escherichia coli O157:H7 and K-12 cultures exposed to inorganic and organic acids in stationary phase reveals acidulant- and strain-specific acid tolerance responses. Appl. Environ. Microbiol. 76:6514–6528 [DOI] [PMC free article] [PubMed] [Google Scholar]
- 20. Kulasekara BR, et al. 2009. Analysis of the genome of the Escherichia coli O157:H7 2006 spinach-associated outbreak isolate indicates candidate genes that may enhance virulence. Infect. Immun. 77:3713–3721 [DOI] [PMC free article] [PubMed] [Google Scholar]
- 21. Large TM, Walk ST, Whittam TS. 2005. Variation in acid resistance among Shiga toxin-producing clones of pathogenic Escherichia coli. Appl. Environ. Microbiol. 71:2493–2500 [DOI] [PMC free article] [PubMed] [Google Scholar]
- 22. Levine MM, et al. 1978. Escherichia coli strains that cause diarrhoea but do not produce heat-labile or heat-stable enterotoxins and are non-invasive. Lancet i:1119–1122 [DOI] [PubMed] [Google Scholar]
- 23. Liu Q, Bender RA. 2007. Complex regulation of urease formation from the two promoters of the ure operon of Klebsiella pneumoniae. J. Bacteriol. 189:7593–7599 [DOI] [PMC free article] [PubMed] [Google Scholar]
- 24. Macaluso A, Best EA, Bender RA. 1990. Role of the nac gene product in the nitrogen regulation of some NTR-regulated operons of Klebsiella aerogenes. J. Bacteriol. 172:7249–7255 [DOI] [PMC free article] [PubMed] [Google Scholar]
- 25. Maroncle N, Rich C, Forestier C. 2006. The role of Klebsiella pneumoniae urease in intestinal colonization and resistance to gastrointestinal stress. Res. Microbiol. 157:184–193 [DOI] [PubMed] [Google Scholar]
- 26. Masepohl B, et al. 2001. Urea utilization in the phototrophic bacterium Rhodobacter capsulatus is regulated by the transcriptional activator NtrC. J. Bacteriol. 183:637–643 [DOI] [PMC free article] [PubMed] [Google Scholar]
- 27. McKenzie GJ, Craig NL. 2006. Fast, easy and efficient: site-specific insertion of transgenes into enterobacterial chromosomes using Tn7 without need for selection of the insertion event. BMC Microbiol. 6:39 doi:10.1186/1471-2180-6-39 [DOI] [PMC free article] [PubMed] [Google Scholar]
- 28. Michino H, et al. 1999. Massive outbreak of Escherichia coli O157:H7 infection in schoolchildren in Sakai City, Japan, associated with consumption of white radish sprouts. Am. J. Epidemiol. 150:787–796 [DOI] [PubMed] [Google Scholar]
- 29. Mobley HL, Island MD, Hausinger RP. 1995. Molecular biology of microbial ureases. Microbiol. Rev. 59:451–480 [DOI] [PMC free article] [PubMed] [Google Scholar]
- 30. Mohawk KL, Melton-Celsa AR, Zangari T, Carroll EE, O'Brien AD. 2010. Pathogenesis of Escherichia coli O157:H7 strain 86-24 following oral infection of BALB/c mice with an intact commensal flora. Microb. Pathog. 48:131–142 [DOI] [PMC free article] [PubMed] [Google Scholar]
- 31. Mohawk KL, O'Brien AD. 2011. Mouse models of Escherichia coli O157:H7 infection and Shiga toxin injection. J. Biomed. Biotechnol. 2011:258185 doi:10.1155/2011/258185 [DOI] [PMC free article] [PubMed] [Google Scholar]
- 32. Murphy KC, Campellone KG. 2003. Lambda Red-mediated recombinogenic engineering of enterohemorrhagic and enteropathogenic E. coli. BMC Mol. Biol. 4:11 doi:10.1186/1471-2199-4-11 [DOI] [PMC free article] [PubMed] [Google Scholar]
- 33. Reference deleted.
- 34. Nakano M, Iida T, Honda T. 2004. Urease activity of enterohaemorrhagic Escherichia coli depends on a specific one-base substitution in ureD. Microbiology 150:3483–3489 [DOI] [PubMed] [Google Scholar]
- 35. Nakano M, et al. 2001. Association of the urease gene with enterohemorrhagic Escherichia coli strains irrespective of their serogroups. J. Clin. Microbiol. 39:4541–4543 [DOI] [PMC free article] [PubMed] [Google Scholar]
- 36. Orth D, Grif K, Dierich MP, Wurzner R. 2006. Prevalence, structure and expression of urease genes in Shiga toxin-producing Escherichia coli from humans and the environment. Int. J. Hyg. Environ. Health 209:513–520 [DOI] [PubMed] [Google Scholar]
- 37. Park KS, et al. 2000. Genetic characterization of DNA region containing the trh and ure genes of Vibrio parahaemolyticus. Infect. Immun. 68:5742–5748 [DOI] [PMC free article] [PubMed] [Google Scholar]
- 38. Paton AW, et al. 1996. Molecular microbiological investigation of an outbreak of hemolytic-uremic syndrome caused by dry fermented sausage contaminated with Shiga-like toxin-producing Escherichia coli. J. Clin. Microbiol. 34:1622–1627 [DOI] [PMC free article] [PubMed] [Google Scholar]
- 39. Perna NT, et al. 2001. Genome sequence of enterohaemorrhagic Escherichia coli O157:H7. Nature 409:529–533 [DOI] [PubMed] [Google Scholar]
- 40. Pfaffl MW. 2001. A new mathematical model for relative quantification in real-time RT-PCR. Nucleic Acids Res. 29:e45 doi:10.1093/nar/29.9.e45 [DOI] [PMC free article] [PubMed] [Google Scholar]
- 41. Reitzer L, Schneider BL. 2001. Metabolic context and possible physiological themes of sigma(54)-dependent genes in Escherichia coli. Microbiol. Mol. Biol. Rev. 65:422–444 [DOI] [PMC free article] [PubMed] [Google Scholar]
- 42. Riley LW, et al. 1983. Hemorrhagic colitis associated with a rare Escherichia coli serotype. N. Engl. J. Med. 308:681–685 [DOI] [PubMed] [Google Scholar]
- 43. Sangari FJ, Seoane A, Rodriguez MC, Aguero J, Garcia Lobo JM. 2007. Characterization of the urease operon of Brucella abortus and assessment of its role in virulence of the bacterium. Infect. Immun. 75:774–780 [DOI] [PMC free article] [PubMed] [Google Scholar]
- 44. Sheng H, Lim JY, Knecht HJ, Li J, Hovde CJ. 2006. Role of Escherichia coli O157:H7 virulence factors in colonization at the bovine terminal rectal mucosa. Infect. Immun. 74:4685–4693 [DOI] [PMC free article] [PubMed] [Google Scholar]
- 45. Simons RW, Houman F, Kleckner N. 1987. Improved single and multicopy lac-based cloning vectors for protein and operon fusions. Gene 53:85–96 [DOI] [PubMed] [Google Scholar]
- 46. Steyert SR, Rasko DA, Kaper JB. 2011. Functional and phylogenetic analysis of ureD in Shiga toxin-producing Escherichia coli. J. Bacteriol. 193:875–886 [DOI] [PMC free article] [PubMed] [Google Scholar]
- 47. Tennant SM, et al. 2008. Influence of gastric acid on susceptibility to infection with ingested bacterial pathogens. Infect. Immun. 76:639–645 [DOI] [PMC free article] [PubMed] [Google Scholar]
- 48. Teunis PF, Ogden ID, Strachan NJ. 2008. Hierarchical dose response of E. coli O157:H7 from human outbreaks incorporating heterogeneity in exposure. Epidemiol. Infect. 136:761–770 [DOI] [PMC free article] [PubMed] [Google Scholar]
- 49. Tilden J, Jr, et al. 1996. A new route of transmission for Escherichia coli: infection from dry fermented salami. Am. J. Public Health 86:1142–1145 [DOI] [PMC free article] [PubMed] [Google Scholar]
- 50. Tuttle J, et al. 1999. Lessons from a large outbreak of Escherichia coli O157:H7 infections: insights into the infectious dose and method of widespread contamination of hamburger patties. Epidemiol. Infect. 122:185–192 [DOI] [PMC free article] [PubMed] [Google Scholar]
- 51. Walters M, Sperandio V. 2006. Autoinducer 3 and epinephrine signaling in the kinetics of locus of enterocyte effacement gene expression in enterohemorrhagic Escherichia coli. Infect. Immun. 74:5445–5455 [DOI] [PMC free article] [PubMed] [Google Scholar]
- 52. Weatherburn MW. 1967. Phenol-hypochlorite reaction for determination of ammonia. Anal. Chem. 39:971–974 [Google Scholar]
- 53. Reference deleted.
- 54. Wray LV, Jr, Ferson AE, Fisher SH. 1997. Expression of the Bacillus subtilis ureABC operon is controlled by multiple regulatory factors including CodY, GlnR, TnrA, and Spo0H. J. Bacteriol. 179:5494–5501 [DOI] [PMC free article] [PubMed] [Google Scholar]
- 55. Young GM, Amid D, Miller VL. 1996. A bifunctional urease enhances survival of pathogenic Yersinia enterocolitica and Morganella morganii at low pH. J. Bacteriol. 178:6487–6495 [DOI] [PMC free article] [PubMed] [Google Scholar]
- 56. Zimmer DP, et al. 2000. Nitrogen regulatory protein C-controlled genes of Escherichia coli: scavenging as a defense against nitrogen limitation. Proc. Natl. Acad. Sci. U. S. A. 97:14674–14679 [DOI] [PMC free article] [PubMed] [Google Scholar]