

Abstract
The brain is highly susceptible to oxidative injury, and the pentose phosphate pathway (PPP) has been shown to be affected by pathological conditions, such as Alzheimer's disease and traumatic brain injury. While this pathway has been investigated in the intact brain and in astrocytes, little is known about the PPP in neurons. The activity of the PPP was quantified in cultured cerebral cortical and cerebellar neurons after incubation in the presence of [2-13C]glucose or [3-13C]glucose. The activity of the PPP was several fold lower than glycolysis in both types of neurons. While metabolism of 13C-labeled glucose via the PPP does not appear to contribute to the production of releasable lactate, it contributes to labeling of tricarboxylic acid (TCA) cycle intermediates and related amino acids. Based on glutamate isotopomers, it was calculated that PPP activity accounts for ∼6% of glucose metabolism in cortical neurons and ∼4% in cerebellar neurons. This is the first demonstration that pyruvate generated from glucose via the PPP contributes to the synthesis of acetyl CoA for oxidation in the TCA cycle. Moreover, the fact that 13C labeling from glucose is incorporated into glutamate proves that both the oxidative and the nonoxidative stages of the PPP are active in neurons.
Keywords: cell culture, energy metabolism, free radicals, MR spectroscopy, neurotransmitters
Introduction
Glucose, the most important energy source in the brain, is metabolized via the pentose phosphate pathway (PPP) in addition to glycolysis and glycogen synthesis (McKenna et al, 2012). Metabolism of glucose via the PPP is particularly important for formation of ribose-5-phosphate used in the synthesis of nucleotides and for production of NADP+/NADPH required for lipid biosynthesis (Vannucci and Simpson, 2003) as well as regeneration of reduced glutathione (White et al, 1988). The activity of the PPP is high in the developing brain, reaching a peak during myelination, but it is believed to be less pronounced in the adult brain (McKenna et al, 2012).
The PPP is divided into two stages, i.e., the oxidative and the nonoxidative stages. After the nonoxidative stage, the metabolites may reenter the glycolysis at the level of fructose-6-phosphate or glyceraldehyde-3-phosphate (G-3-P). Glucose-6-phosphate dehydrogenase, the key enzyme in the PPP, constitutes the first step in the oxidative stage and appears to have a crucial role in the cellular response to oxidative stress (Filosa et al, 2003). Pathological conditions are known to alter the activity of the PPP. Amyloid β peptides, which have one of the key roles in the pathogenesis of Alzheimer's disease, have been shown to augment production of reactive oxygen species and increase the activity of the PPP in brain cells (Allaman et al, 2010). Furthermore, while basal PPP activity in the adult brain appears to be very low (Zubairu et al, 1983), it is upregulated when the brain is subjected to abnormal oxidative stress (Appel and Parrot, 1970; Hothersall et al, 1982). One such condition is traumatic brain injury where oxidative stress is a known mechanism of secondary injury (Dusick et al, 2007). Dusick et al (2007) found that the PPP flux compared with glycolysis was 19.6% in patients with traumatic brain injury compared with 6.9% in controls.
The PPP activity has repeatedly been analyzed using radioactively labeled glucose. In one of the first studies on PPP activity, the contribution of this pathway to glucose metabolism (GM) was quantified by measuring the amounts of [2-14C]glucose incorporated into glycogen as [2-14C]glucose and [1-14C]glucose units generated by direct glycogen synthesis or after PPP metabolism, respectively. The authors concluded that the whole-brain value for PPP is 3% to 5% of glycogen synthesis (Hostetler and Landau, 1967). However, it should be noted that in the brain, glycogen is mainly produced and localized in the astrocytes (Cataldo and Broadwell, 1986) and thus, this value reflects the PPP in astrocytes only. Commonly, activity of the PPP is quantified by analyzing the difference in 14CO2 production from [1-14C]glucose and [6-14C]glucose (Herrero-Mendez et al, 2009; Katz and Wood, 1960; Katz et al, 1966; Wood et al, 1963) a method applicable to all cell types. Using this technique, Bauer and Brand (1982) found that 2% of glucose was metabolized via the PPP in rat cerebral cortical synaptosomes. In contrast, Allaman et al (2010) and Takahashi et al (2012) found that 60% to 70% of the CO2 produced from glucose in astrocytes is generated via PPP. It should, however, be noted that measuring the 14CO2 production from [1-14C]glucose and [6-14C]glucose has limitations since only the first step of the PPP is analyzed, i.e., the oxidative stage, and extensive tricarboxylic acid (TCA) cycle activity after glycolysis can produce large amounts of 14CO2 from both precursors concealing the quantification of PPP activity. Furthermore, two parallel incubations must be performed for each measurement, and thus inter sample variability increases the uncertainty of the results. Some of these restrictions can be overcome by analysis of isotopic composition of triose phosphate derivatives such as lactate rather than CO2 (Katz and Wood, 1960; Katz et al, 1966; Wood et al, 1963).
13C-Labeled glucose can be used in combination with magnetic resonance spectroscopy (MRS) or mass spectrometry (MS) to quantify PPP activity. Thus, it is possible to measure PPP activity by determining the labeling pattern in lactate released from cultured cells after parallel incubations with [1-13C]glucose and [6-13C]glucose (Kingsley-Hickman et al, 1990). Still, two parallel incubations are needed for each measurement. This problem was circumvented by using [1,6-13C2,6,6-2H2]glucose, and it was found that PPP activity contributes 9.4±2.1% to the synthesis of lactate released to the medium in cultured glioma cells (Ross et al, 1994). This same strategy combined with microdialysis was used to show that 3.5±0.4% of glucose was metabolized via PPP in the rat brain (Ben-Yoseph et al, 1995). Furthermore, it has been shown that primary mixed cultures of neurons and glial cells from neocortex exhibit a PPP activity accounting for 0.25±0.3% of the conversion of glucose to lactate, a value that was increased to 22.2±0.6% in the presence of H2O2 (Ben-Yoseph et al, 1996). Another substrate used is [1,2-13C]glucose, leading to double labeling in lactate from glycolysis, and both mono- and double labeling from PPP (Dusick et al, 2007). However, both methods rely on the assumption that the incorporation of label into lactate found in the medium reflects total the PPP activity.
Little is known about the PPP activity in neurons specifically with regard to its role in amino-acid neurotransmitter synthesis as well as its contribution to the formation of acetyl CoA for oxidation in the TCA cycle. The present study was undertaken to measure PPP activity in neurons cultured from cerebral cortex and cerebellum. [3-13C]Glucose was used to selectively investigate the contribution of the PPP to its metabolism via the TCA cycle. The relative contributions of glycolysis and PPP to formation of pyruvate used for production of released lactate and TCA cycle metabolism including generation of amino-acid neurotransmitters were determined using [2-13C]glucose.
Materials and methods
Materials
Pregnant NMRI mice and 7-day-old NMRI mice were bought from Taconic M&B (Ry, Denmark). Fetal calf serum was purchased from Seralab Ltd. (Sussex, UK) and culture dishes and flasks were obtained from Nunc A/S (Roskilde, Denmark). Culture medium (Dulbecco's minimum essential medium; DMEM) was bought from Sigma-Aldrich (St Louis, MO, USA) while [2-13C]glucose (99%) and [3-13C]glucose (99%) were purchased from Cambridge Isotope Laboratories, Inc. (Andover, MA, USA). Deuterated water (D2O; 99%) was bought from C/D/N Isotopes Inc. (Quebec, Canada). All other chemicals were of the purest grade available from regular commercial sources.
Preparation of Neuronal Cultures
All animals were euthanized in accordance with the general ethical guidelines stated by the European Convention 2010/63/EU and the Danish Animal Experiments Inspectorate.
Monotypic cultures of cerebral cortical neurons were prepared as described by Hertz et al (1989). The cerebral cortices were isolated from 15-day-old mice embryos and briefly exposed to mild trypsinization (0.25 mg/mL trypsin, 15 minutes, 37°C) followed by trituration in a DNase solution (75 i.u./mL) containing soybean trypsin inhibitor (0.53 mg/mL). The cells were suspended in a slightly modified Dulbecco's medium (Hertz et al, 1982) containing 31 mmol/L glucose, 24.5 mmol/L KCl, 7 μmol/L p-aminobenzoate, 10% fetal calf serum and cultured in poly-D-lysine-coated 80 cm2 culture flasks (15 mL/flask, 3.33 × 10⁶ cells/mL) or 35 mm Petri dishes (2 mL/dish, 2.75 × 10⁶ cells/mL). Cytosine arabinoside was added to a final concentration of 20 μmol/L after 48 hours in culture to prevent astrocyte proliferation. After 7 days in vitro ∼70% of the cells consist of highly differentiated GABAergic neurons (Belhage et al, 1993; Drejer et al, 1985, 1987).
Cerebellar neurons were isolated and cultured from cerebella of 7-day-old mice essentially as described by Schousboe et al (1989). The tissue was exposed to mild trypsinization (0.25 mg/mL trypsin, 15 minutes, 37°C) followed by trituration in a DNase solution (75 i.u./mL) containing soybean trypsin inhibitor (0.53 mg/mL). The cells were suspended in a slightly modified Dulbecco's medium (Hertz et al, 1982) containing 12 mmol/L glucose, 50 μmol/L kainate, 24.5 mmol/L KCl, 7 μmol/L p-aminobenzoate, 10% fetal calf serum and seeded in poly-D-lysine-coated 80 cm2 culture flasks (15 mL/flask, 3.33 × 10⁶ cells/mL) or 35 mm Petri dishes (2 mL/dish, 2.75 × 10⁶ cells/mL). Cytosine arabinoside was added to a final concentration of 20 μmol/L after 48 hours in culture to prevent astrocyte proliferation. Moreover, the culture medium was supplemented twice, on days 2 and 5, with an aliquot of glucose (1,200 mmol/L) to reach a final concentration of minimum 12 mmol/L. The phenotypic characteristic of GABAergic neurons, i.e., neurotransmitter release, was eliminated from these cultures by treatment with kainic acid (Drejer and Schousboe, 1989). The cells were cultured for 7 to 8 days, at which time the neurons are predominantly glutamatergic granule cells (Drejer et al, 1985; Drejer and Schousboe, 1989; Schousboe et al, 1985).
Incubation Experiments
The culture medium was removed from cell cultures in the 80-cm2 flasks and the cells were washed once with 37°C warm phosphate-buffered saline containing 137 mmol/L NaCl, 2.7 mmol/L KCl, 7.3 mmol/L Na2HPO4, 1.5 mmol/L KH2PO4, 0.9 mmol/L CaCl2, and 0.5 mmol/L MgCl2, pH 7.4. Next, the cells were incubated with serum-free DMEM containing 6 mmol/L [2-13C]glucose for 4 hours. After incubation, the incubation medium was collected and lyophilized before analysis by gas chromatography-mass spectrometry (GC-MS). The cultures were washed once with ice-cold phosphate-buffered saline to halt metabolism. Subsequently, ice-cold ethanol was used to extract the intracellular contents and the soluble components were separated from the insoluble material by centrifugation at 20,000 g for 10 minutes. The cell extracts were lyophilized before analysis by MRS and high-performance liquid chromatography (HPLC). The pellets were left to dry at room temperature overnight and subsequently dissolved in 1 mol/L KOH and used for protein determination.
The cells cultured in the 35-mm Petri dishes were treated as described above; however, these cells were incubated in serum-free DMEM containing 6 mmol/L [3-13C]glucose for 4 hours and the lyophilized cell extracts were thereafter analyzed by GC-MS.
Protein Analysis
The pellets dissolved in 1 mol/L KOH were used for determination of the cellular protein content using the Lowry protein assay and bovine serum albumin as standard (Lowry et al, 1951).
Magnetic Resonance Spectroscopy
The lyophilized extracts of cells incubated in the presence of [2-13C]glucose were dissolved in 0.2 mL 99% D2O containing 0.01% ethylene glycol as internal standard. The pH was adjusted to be between 6.5 and 7.5. Proton decoupled carbon spectra were obtained on a BRUKER DRX500 spectrometer (BRUKER analytic GmbH, Rheinstetten, Germany). Spectra were accumulated using a 30° pulse angle, 25 kHz spectral width with 64 K data points. The acquisition time was 1.3 seconds, and a 0.5-second relaxation delay was used. The number of scans was in average 60,000.
High-Performance Liquid Chromatography
Amino acids in cell extracts were quantified by HPLC on a Hewlett Packard 100 system (Agilent Technologies, Palo Alto, CA, USA). The amino acids were precolumn derivatized with o-phthaldialdehyde (Geddes and Wood, 1984) and subsequently separated on a ZORBAX SB-C18 (4.6 × 150 mm, 3.5 μm) column from Agilent using a phosphate buffer (50 mmol/L, pH=5.9) and a solution of methanol (98.75%) and tetrahydrofurane (1.25%) as eluents. α-Amino butyric acid was used as internal standard. The separated amino acids were detected with fluorescence and compared with a standard curve derived from standard solutions of amino acids.
Gas Chromatography-Mass Spectrometry
The medium samples from neurons incubated in the presence of [2-13C]glucose and cell extracts from neurons incubated in the presence of [3-13C]glucose were lyophilized and later redissolved in HCl. The pH was adjusted to <2 and the samples were dried under atmospheric air. The amino acids were in multiple steps extracted into an organic phase of ethanol and benzene and dried again under atmospheric air before derivatization with N-Methyl-N-(t-Butyldimethylsilyl) trifluoroacetamide in the presence of 1% t-butyldimethylchlorosilane (Mawhinney et al, 1986). The samples were analyzed on an Agilent 6890 gas chromatograph connected to an Agilent 5975B mass spectrometer.
Data Analysis
Relevant peaks in the magnetic resonance spectra from glutamate and γ-amino butyric acid (GABA) were integrated using XWINNMR software (BRUKER BioSpin GmbH, Rheinstetten, Germany), and the amounts of 13C in the different positions of the molecules were quantified by comparison with the known amount of ethylene glycol. Correction factors for incomplete relaxation and nuclear Overhauser effects adapted from Melø et al (2006) and Badar-Goffer et al (1990) were applied. The MRS data were corrected for naturally abundant 13C by subtracting 1.1% of the total cellular contents obtained from HPLC analyses. GABA was only quantifiable in the cortical neurons.
The atom percent excess 13C values for glutamate, GABA, citrate, alanine, aspartate, α-ketoglutarate, and malate from GC-MS were calculated correcting for the natural abundance of 13C using nonenriched standards. It was not possible to measure the percent enrichment in oxaloacetate or pyruvate due to the low intracellular levels as well as the instability of these substances. All isotopomers of lactate in the medium could be determined reliably but it was not possible to quantify the labeling of intracellular lactate due to interfering components. Moreover, intracellular alanine M+2 was not quantifiable due to its low concentration as well as an overlapping peak in the spectrum.
All statistical analyses were performed using SPSS (IBM, Oslo, Norway). The cerebellar and cortical neurons were compared using unpaired Student's t-test. Levene's test for equality of variances was used to identify significantly different variances. The cutoff was set below 0.05. In the case of significantly different variances, the P value was calculated not assuming equal variances. Within the same group, the metabolic ratios and the different metabolites were compared using a paired Student's t-test.
Glucose Metabolism and 13C Labeling of Products
Glucose-6-phosphate represents a branch point in GM because it is a common substrate for enzymes involved in glycolysis, PPP, glycogenesis, and glycogenolysis. Of these, only glycolysis and PPP are active in neurons. Thus, in the following, the term GM will be used to refer to the concerted action of PPP and glycolysis.
[2-13C]Glucose
When metabolized via glycolysis, [2-13C]glucose yields equal amounts of unlabeled pyruvate and [2-13C]pyruvate. The labeled pyruvate can be converted to [2-13C]lactate or [2-13C]alanine which may be released to the medium. Alternatively, the label from [2-13C]pyruvate can be incorporated into TCA cycle intermediates after conversion to [1-13C]acetyl CoA (Figure 1).
Figure 1.

Simplified presentation of 13C-labeling patterns of metabolites from incubation of cells with [2-13C]glucose representing the pentose phosphate pathway (PPP), glycolysis, and tricarboxylic acid (TCA) cycle activity. The circles symbolize the carbon backbone of the molecules. Dark grey circles mark the position of the label resulting from the PPP. Filled circles indicate that all the molecules are labeled in the position indicated. Half-filled circles indicate that 50% of the molecules formed are labeled in that position. Grey crosses mark the position of the label resulting from glycolysis. Complete crosses indicate that all the molecules are labeled in the position indicated. Demi-crosses indicate that half of the molecules are labeled in that position. Panel A displays glycolysis (right) and the PPP (left). Panel B displays labeling from acetyl CoA derived from either PPP or glycolysis in TCA cycle metabolites and glutamate and γ-amino butyric acid (GABA). Small circles indicate the molecules that are formed from the second turn of the TCA cycle. For simplicity, glyco-phosphates are not included, and only condensation of oxaloacetate with unlabeled acetyl CoA is shown for the second turn. α-KG, α-ketoglutarate; G-3-P, glyceraldehyde-3-phosphate.
[1-13C]Acetyl CoA enters the TCA cycle by condensing with oxaloacetate to form [1-13C]citrate. [1-13C]Citrate is converted to [1-13C]aconitate, [1-13C]isocitrate and then α-[5-13C]ketoglutarate which can be converted to [5-13C]glutamate. In GABAergic neurons, [5-13C]glutamate can thereafter be converted to [1-13C]GABA. If α-ketoglutarate remains in the TCA cycle, then it is metabolized to succinate. Because of the symmetric nature of the latter molecule, the label is scrambled, resulting in equal amounts of 13C labeling in the C1 and the C4 positions of succinate, and thereafter in fumarate, malate, and oxaloacetate.
Having completed one cycle, labeled oxaloacetate merges with acetyl CoA (unlabeled, or labeled after glycolysis or PPP) for a second turn. Second turn metabolites are illustrated by smaller models in Figure 1 (for simplicity, only the second turn metabolites derived from condensation with unlabeled acetyl CoA are shown). Hence, the second turn of the TCA cycle contains [5-13C]citrate or [6-13C]citrate if the label from glucose is converted to pyruvate via glycolysis. The 13C label in the C6 position of citrate is lost when [6-13C]isocitrate is transformed to α-ketoglutarate. The 13C label in the C5 position of citrate gives rise to α-[1-13C]ketoglutarate, [1-13C]glutamate and subsequently unlabeled GABA. Decarboxylation of α-[1-13C]ketoglutarate gives rise to unlabeled succinyl CoA and thereafter succinate formation. Consequently, glycolysis will lead to 13C labeling of glutamate in the C5 position from the first turn of the TCA cycle. In the second turn, half of the 13C label is lost as 13CO2, and half of the label is in the C1 position of glutamate, while in the third turn, all 13C label is lost as 13CO2 by decarboxylation. GABA is only 13C labeled in the C1 position from the first turn of the TCA cycle.
When [2-13C]glucose is metabolized via the PPP, the result will be more complex. The first step, constituting the oxidative stage of the PPP, produces [1-13C]ribulose-5-phosphate, CO2, and NADPH from [2-13C]glucose-6-phosphate and NADP+ (Katz and Wood, 1960; Wood et al, 1963). If the pentose sugars are not used for synthesis of nucleotides, then they will be further metabolized via the nonoxidative stage of the PPP to fructose-6-phosphate and the glycolytic intermediate G-3-P. Per three molecules of [2-13C]glucose metabolized via the PPP, one molecule of [1-13C]fructose, one [1,3-13C]fructose, and one unlabeled molecule of the glycolytic intermediate G-3-P are formed. These metabolites can then be converted to pyruvate by glycolytic enzymes. Alternatively, fructose-6-phosphate can recycle through the PPP. Not taking this cycling into account, PPP metabolism of three molecules of [2-13C]glucose will generate five molecules of pyruvate: one [3-13C], one [1,3-13C], and three unlabeled. Thereafter, the pyruvate molecules may be converted to lactate or alanine displaying the same labeling pattern as pyruvate or the five pyruvate molecules may be converted into two molecules of [2-13C]acetyl CoA plus three molecules of unlabeled acetyl CoA.
The TCA cycle metabolism of [2-13C]acetyl CoA gives rise to formation of [4-13C]glutamate, [2-13C]GABA and equal amounts of [2-13C]- and [3-13C]oxaloacetate in the first turn of the TCA cycle. When 13C-labeled oxaloacetate condenses with (unlabeled) acetyl CoA the label in glutamate will be equally divided between the C2 and C3 positions in the second turn of the TCA cycle. In the third and subsequent turns, the 13C label of glutamate will be equally divided between the C1, C2, and C3 positions as well as ¼ of the label being lost. GABA will be labeled in the C3 and C4 positions from the second and subsequent turns of the TCA cycle. Consequently, when [2-13C]glucose is converted to [2-13C]acetyl CoA after metabolism via the PPP, the 13C label in TCA cycle intermediates is not lost as rapidly as it is when [1-13C]acetyl CoA is generated via glycolysis. Moreover, it should be noticed that [1-13C]glutamate can be generated from [1-13C]acetyl CoA in the second turn of TCA cycle metabolism or from [2-13C]acetyl CoA in the third turn. Hence, although 13C-labeled pyruvate derived from both glycolysis and PPP activity is metabolized in the TCA cycle beyond the first turn, the isotopomers generated from each of the two metabolic pathways can no longer be distinguished after subsequent turns of TCA cycle metabolism. Therefore, only first turn metabolites were used for the calculations.
Calculation of the PPP/GM ratio from [2-13C]glucose
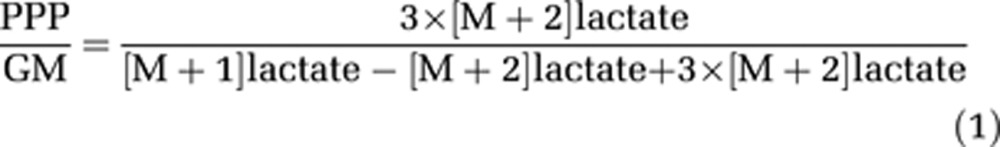
Taking advantage of the different isotopomers generated after glycolytic and PPP metabolism of [2-13C]glucose, PPP/GM ratios can be calculated by dividing the amount of isotopomer generated after PPP activity by the sum of isotopomers produced from the combined activities of glycolysis and PPP. For the extracellular compartment, the PPP/GM ratio is calculated by using the percent 13C enrichment, i.e., dividing the double labeling by the combined mono- and double labeling of lactate or alanine generated from metabolism of [2-13C]glucose. Mono-labeled lactate and alanine originate from both glycolysis and PPP while double labeled lactate and alanine reflect PPP activity. However, it is necessary to adjust for the redistribution of 13C-labeled carbon atoms in the nonoxidative stage of the PPP. One molecule of double-labeled lactate or alanine corresponds to the utilization of three molecules of 13C-labeled glucose via PPP.
Thus, the relation can be expressed as follows:
 |
This can be simplified to equation (2):
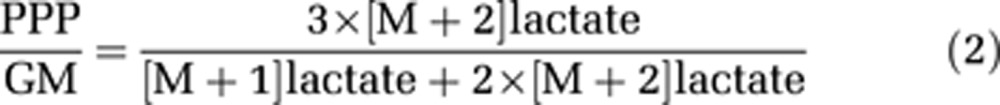 |
If all [2-13C]glucose metabolized via the PPP were labeled, then it would give rise to equal amounts of mono-labeled and double-labeled lactate and alanine. Thus, the contribution from PPP to mono labeling would be equal to the amount of double labeling. However, the labeled glucose may be mixed with unlabeled metabolites downstream of the oxidative stage of the PPP, which may lead to a dilution of the label, and thus an underestimation of the PPP/GM ratio based on lactate and alanine. The same equation is valid for calculation of the PPP/GM ratios using results obtained from experiments employed [3-13C]glucose.
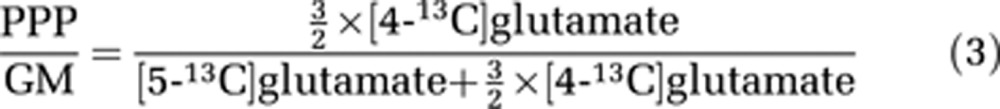
For the intracellular compartment, PPP/GM ratios are calculated based on the amount of isotopic 13C labeling from [2-13C]glucose incorporated into glutamate and/or GABA obtained from MRS in combination with HPLC analyses. Metabolism of three molecules of [2-13C]glucose via the PPP leads to formation of two molecules of [4-13C]glutamate. The amount of 13C label in the C5 position of glutamate from glycolytic activity, however, corresponds directly to the amount of glucose consumed by glycolysis. Therefore, the amount of 13C label in glutamate and GABA generated by way of PPP metabolism must be divided by two and multiplied by three to calculate the amount of [2-13C]glucose metabolized via the PPP. Thus, the PPP/GM ratio can be expressed as follows:
 |
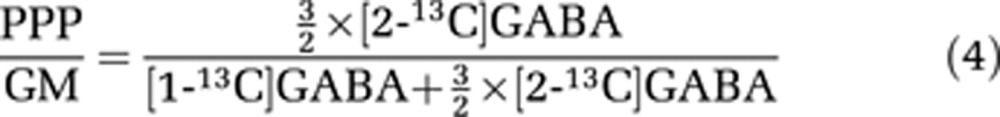
In GABAergic neurons, glutamate can be converted to GABA, and therefore a similar calculation based on the 13C-labeling pattern in GABA can be applied:
 |
[3-13C]Glucose
If [3-13C]glucose is metabolized via the PPP, then the result after the nonoxidative stage is one molecule of [2-13C]fructose, one [2,3-13C]fructose as well as one unlabeled G-3-P per three molecules of [3-13C]glucose entering the PPP. Subsequent glycolytic activity leads to formation of five molecules of pyruvate, i.e., three unlabeled, one [2-13C] and one [1,2-13C] labeled, which can be converted to lactate or alanine exhibiting similar labeling patterns. Alternatively, the pyruvate molecules can be decarboxylated by pyruvate dehydrogenase resulting in unlabeled acetyl CoA as well as two molecules of [1-13C]acetyl CoA. Condensation of [1-13C]acetyl CoA with oxaloacetate will give 13C labeling in TCA cycle metabolites. These labeling patterns are identical to the ones derived from [2-13C]glucose metabolized solely via glycolysis (see above and Figure 1). Consequently, in the first turn of the TCA cycle, all the TCA cycle intermediates as well as glutamate, GABA, and aspartate will be labeled in one carbon atom (M+1) (Figure 2).
Figure 2.

Labeling patterns from [3-13C]glucose resulting from the pentose phosphate pathway (PPP), glycolysis, and tricarboxylic acid (TCA) cycle activity. The circles symbolize the carbon backbone of the molecules. Dark grey circles mark the position of the label resulting from the PPP. Filled circles indicate that all the molecules are labeled in the position indicated. Half-filled circles indicate that 50% of the molecules formed are labeled in that position. Grey crosses mark the position of the label resulting from glycolysis. Panel A displays glycolysis (right) and the PPP (left). Panel B displays labeling from acetyl CoA derived from either PPP or glycolysis in TCA cycle metabolites and glutamate and γ-amino butyric acid (GABA). Small circles indicate the molecules that are formed from the second turn of the TCA cycle. For simplicity, glyco-phosphates are not included, and only condensation of oxaloacetate with unlabeled acetyl CoA is shown for the second turn. α-KG, α-ketoglutarate; G-3-P, glyceraldehydes-3-phosphate.
Metabolism of [3-13C]glucose via glycolysis also yields two molecules of pyruvate; i.e., one unlabeled and [1-13C] labeled. The latter can be converted to [1-13C]lactate or [1-13C]alanine; however, the 13C label is lost when pyruvate is converted to acetyl CoA. Consequently, TCA cycle metabolism of pyruvate generated from [3-13C]glucose via glycolysis does not lead to labeling of any intermediates or their derivatives such as glutamate and GABA. Therefore, all 13C label observed in TCA cycle intermediates and their derivatives is the result of PPP activity.
Results
The intracellular content of glutathione (oxidized plus reduced), glutamate, GABA, alanine, and aspartate is shown in Figure 3. The neocortical and cerebellar neurons displayed similar amounts of glutathione, and the levels were in accordance with amounts previously reported by Dringen et al (1999). The neocortical neurons have been characterized as mainly GABAergic, while the cerebellar neurons in culture have been shown to be mainly glutamatergic (Schousboe et al, 1985). This is reaffirmed here as observed by the significant differences in glutamate and GABA levels between the two preparations of cultured neurons; the glutamate content was highest in cerebellar neurons while GABA was highest in neocortical neurons. In addition, the amount of aspartate was significantly higher in the neocortical compared with cerebellar neurons.
Figure 3.

Cortical (open bars) and cerebellar (filled bars) neurons were incubated for 4 hours. Cell extracts were analyzed by high-performance liquid chromatography (HPLC). For more details, see Materials and methods. Results are presented as mean±95% confidence interval (CI) (n=6). Unpaired Student's t-test was used to compare cerebellar and cortical neurons. Asterisks indicate statistical difference from the same metabolite in cortex. P values: *=<0.05, **=<0.001. GABA, γ-amino butyric acid.
Figure 4 shows typical spectra of cell extracts from cerebellar and neocortical neurons incubated with [2-13C]glucose. In both cell types, 13C labeling was present in each of the five carbon positions of glutamate. In the neocortical cultures also 13C labeling of GABA could be detected, in line with the GABAergic nature of the cells. It is notable that the C5 peak of glutamate was considerably higher than the other glutamate peaks consistent with a high glycolytic compared with PPP activity.
Figure 4.

13C Magnetic resonance (MR) spectra of the cell culture extracts from incubation with [2-13C]glucose. (A) Neocortical neurons and (B) cerebellar neurons. The horizontal axis has been truncated. The detectable peaks of glutamate and γ-amino butyric acid (GABA) are marked. GLU, glutamate; p.p.m., parts per million.
The percent enrichment in intracellular alanine, citrate, glutamate, GABA, α-ketoglutarate, malate, and aspartate resulting from incubation with [3-13C]glucose is presented in Table 1. The only way to get enrichment from [3-13C]glucose in TCA cycle-related metabolites and their derivatives in neurons is via the PPP. Thus, PPP/GM ratios could not be calculated based on 13C labeling from [3-13C]glucose incorporated into the TCA cycle intermediates. However, the cerebellar neurons had significantly higher percent 13C enrichment in many of the TCA cycle intermediates as well as in glutamate and aspartate compared with neocortical neurons, indicating a higher PPP activity in cerebellar than in cortical neurons.
Table 1. Percent 13C enrichment (%) in metabolites in cortical and cerebellar neurons incubated in medium containing [3-13C]glucose.
| Cortical | Cerebellar | |
|---|---|---|
| Percent enrichment (%) | ||
| Alanine (M+1) | 31.51±0.62 | 26.21±1.27* |
| Alanine (M+2) | NQ | NQ |
| Citrate (M+1) | 2.13±0.06 | 5.32±0.13** |
| Glutamate (M+1) | 1.94±0.08 | 2.92±0.04** |
| GABA (M+1) | 0.53±0.05 | — |
| α-KG (M+1) | 1.80±0.67 | 2.22±0.88 |
| Malate (M+1) | 1.89±0.07 | 4.62±0.20** |
| Aspartate (M+1) | 1.55±0.06 | 3.23±0.12** |
MS, mass spectrometry; NQ, not quantifiable.
Cerebellar and cortical neurons were incubated in medium containing [3-13C]glucose for 4 hours. Cell extracts were analyzed by MS. For more details, see Materials and methods. Results (mean±s.e.m.; n=4) are presented as % 13C enrichment of relevant metabolites. Unpaired Student's t-test was used to compare cerebellar and cortical neurons. Asterisks indicate statistical difference from the same metabolite in cortex. P values: *=<0.01, **=<0.001.
It should be noted that the 13C labeling of the metabolites could be increased by the presence of an active pyruvate carboxylation process in the small population of astrocytes in the neuronal cultures. The astrocytic population in cerebellar granule cells is between 5% and 10% (Drejer et al, 1985; Schousboe et al, 1985). An analogous labeling experiment in cultured cerebellar and cortical astrocytes has been conducted to calculate pyruvate carboxylation activity and related metabolism (Brekke et al, 2012). Applying labeling data obtained using [2-13C]glucose, it was calculated that the pyruvate carboxylase activity of the above-mentioned astrocyte population could contribute to 1% to 4% of the labeling in the relevant positions in glutamate (i.e., the amount of labeling in the C2 position would be 1.98 nmol/mg protein instead of 2.08 nmol/mg protein). This would again maximally lead to a 4.5% overestimation of the labeling from PPP when applying [3-13C]glucose (i.e., the percent enrichment for glutamate would be 2.79% instead of 2.92%). In neocortical cultures, the percentage of astrocytes is only 5% (Larsson et al, 1985), and would maximally lead to a 3% overestimation (i.e., the percent enrichment in glutamate would be 1.88% instead of 1.94%). Thus, it was concluded that the contribution of pyruvate carboxylase activity was negligible.
The percent enrichment in lactate and alanine in the medium resulting from incubation with [2-13C]glucose is presented in Table 2. The levels of double-labeled lactate were very low, and consequently the PPP/GM ratios for lactate were low, indicating a negligible PPP activity associated with extracellular lactate. Double-labeled alanine was not quantifiable due to low quantities and an overlapping peak. Thus, the PPP/GM ratio could not be calculated for alanine.
Table 2. Percent 13C enrichment (%) in metabolites in the incubation medium and PPP/GM ratios (%) comparing label in the incubation medium from the pentose phosphate pathway and glycolysis in cortical and cerebellar neurons incubated in medium containing [2-13C].
| Cortical | Cerebellar | |
|---|---|---|
| Percent enrichment (%) | ||
| Lactate (M+1) | 35.39±2.12 | 38.41±0.36 |
| Lactate (M+2) | (0.02±0.02) | (0.00±0.00) |
| Alanine (M+1) | 15.01±1.34 | 16.05±1.11 |
| Alanine (M+2)# | NQ | NQ |
| PPP/GM ratio (%) | ||
| Lactate (equation (2)) | (0.12±0.12) | (0.00±0.00) |
GM, glucose metabolism; MS, mass spectrometry; NQ, not quantifiable; PPP, pentose phosphate pathway.
Cerebellar and cortical neurons were incubated in medium containing [2-13C]glucose for 4 hours, the incubation medium was analyzed by MS. For more details, see Materials and methods. Results (mean±s.e.m.; n=5) are presented as % 13C enrichment of relevant metabolites. When calculating the ratios, a correction factor of 1.5 is used to adjust for the loss of carbon atoms in the PPP. Unpaired Student's t-test was used to compare cerebellar and cortical neurons. No statistical differences were found. Numbers in parenthesis indicate that labeling was not detectable. #, alanine M+2 could not be quantified due to peak overlap.
Table 3 presents the amount of different isotopomers of glutamate generated after metabolism of [2-13C]glucose. The amounts of different isotopomers of GABA in neocortical neurons are also listed. To obtain information about the relative contribution from PPP and glycolytic activity to the production of pyruvate which is subsequently metabolized in the TCA cycle, the amount of [4-13C]glutamate originating from PPP activity was compared with that of [5-13C]glutamate generated after glycolysis. Moreover, there was significantly higher 13C labeling in the C1 compared with the C2 position of GABA. These results confirm that glycolysis is significantly more active than the PPP. The values for PPP from the second turn of the TCA cycle, i.e., the amounts of [3-13C]glutamate and [2-13C]glutamate, were slightly higher in cerebellar compared with cortical neurons. Based on the amounts of labeling, PPP/GM ratios for glutamate and GABA could be calculated. The ratio for glutamate was higher for cortical neurons (6%) compared with cerebellar neurons (4%).
Table 3. Amounts of 13C label (nmol/mg protein) in glutamate and GABA and PPP/GM ratios (%) comparing label from the pentose phosphate pathway and glycolysis in cortical and cerebellar neurons incubated in medium containing [2-13C]glucose.
| Cortical | Cerebellar | |
|---|---|---|
| Amounts (nmol/mg protein) | ||
| Glutamate | ||
| [1-13C]glutamate | 4.02±0.53 | 5.01±0.63 |
| [2-13C]glutamate | 0.96±0.12 | 2.08±0.25* |
| [3-13C]glutamate | 1.38±0.11 | 2.64±0.18** |
| [4-13C]glutamate | 0.71±0.14# | 0.58±0.12# |
| [5-13C]glutamate | 16.91±2.60 | 21.27±2.23 |
| PPP/GM ratio (equation (3)) | 5.8±0.8 | 3.7±1.1* |
| GABA | ||
| [1-13C]GABA | 4.93±0.83 | — |
| [2-13C]GABA | 0.10±0.04# | — |
| [3-13C]GABA | 0.26±0.13 | — |
| [4-13C]GABA | 0.02±0.01 | — |
| PPP/GM ratio (equation (4)) | 2.5±2.1 | — |
GABA, γ-amino butyric acid; GM, glucose metabolism; HPLC, high-performance liquid chromatography; MRS, magnetic resonance spectroscopy; MS, mass spectrometry; NQ, not quantifiable; PPP, pentose phosphate pathway.
Cerebellar and cortical neurons were incubated in medium containing [2-13C]glucose for 4 hours. Cell extracts were analyzed by HPLC and 13C MRS. For more details, see Materials and methods. Ratios are presented in %, and amounts are presented as mean±s.e.m. (n=6).
*Unpaired Student's t-test was used to compare cerebellar and cortical neurons.
#Paired Student's t-test was used to compare the amount of label in different positions within the cortical and cerebellar neurons: [4-13C]glutamate (PPP first turn) was compared with [5-13C]glutamate (glycolysis first turn). Moreover, [2-13C]GABA was (PPP first turn) compared with [1-13C]GABA (glycolysis first turn).
P values: #P<0.01, *P<0.01, **P<0.001.
Discussion
Several previous studies have been aimed at elucidating the quantitative importance of the PPP for GM in the brain. However, due to methodological limitations, it has been difficult to obtain a reliable quantification of this pathway for GM (Ben-Yoseph et al, 1995; Herrero-Mendez et al, 2009; Katz et al, 1966). The use of [3-13C]glucose allows a conclusion regarding significant presence of PPP associated with the TCA cycle, while applying [2-13C]glucose allows a reliable calculation of the PPP/GM ratio. In the present study, these principles have been combined to unequivocally show a significant contribution of PPP activity to GM. This is, to our knowledge, the first demonstration that carbon atoms in pyruvate formed via the PPP are incorporated into TCA cycle intermediates and neurotransmitters.
Pentose Phosphate Pathway Activity in Relation to Tricarboxylic Acid Cycle Metabolites and Neurotransmitters
The presence of mono labeling in TCA cycle intermediates and related amino acids (see Figure 2) constitutes an independent proof of PPP activity using [3-13C]glucose in combination with MS analyses. Moreover, this is reinforced by the finding of label in the C4 position of glutamate in both types of neuronal cultures, and the C2 position of GABA in the cerebral cortical cultures when [2-13C]glucose was used as substrate. The only other metabolic pathway that could theoretically produce 13C label in these positions is pyruvate carboxylation followed by backflux and thereafter pyruvate recycling. This is unlikely since pyruvate carboxylation is only operative in astrocytes (Patel, 1974; Yu et al, 1983). Thus, the only way to get 13C label into glutamate C4 and GABA C2 in neurons is via the PPP. Due to a fourfold to fivefold higher total glucose consumption in cerebellar granule cells compared with cortical neurons (Hertz et al, 1988), it is necessary to compare PPP activity relative to GM. The PPP/GM ratio calculated based on 13C labeling in glutamate (Table 3) was significantly lower in cerebellum compared with cortex. It should be noted, however, that the two types of neuronal cultures were maintained under slightly different glucose concentrations. It has recently been shown that glucose availability during culturing influences the expression of enzymes relevant for metabolism of glucose via the PPP (Takahashi et al, 2012).
Pentose Phosphate Pathway Activity in Production of Extracellular Lactate
We found that pyruvate derived from [2-13C]glucose via the PPP did not contribute detectably to the production of lactate in the medium. This is in accordance with the findings of Ben-Yoseph et al (1996), who used the incorporation of label from [1,6-13C2,6,6-2H2]glucose into lactate released to the medium to study the PPP in mixed cultures consisting mainly of neurons but also of glia from neocortex. They reported basal levels of the PPP to be 0.25±0.3% of GM. However, this ratio could be increased to 22.2±0.6% during oxidative stress. Thus, it is probable that also the PPP activity of neurons can be increased (Appel and Parrot, 1970; Hothersall et al, 1982). In glial cultures, the basal activity was 6.9±1.8%, and could be increased to 66.7±0.8% of GM when subjected to oxidative stress (Ben-Yoseph et al, 1996). Since both our result and the findings of Ben-Yoseph et al (1996) point to negligible labeling of extracellular lactate from neurons, this indicates that the 3.5±0.4% labeling detected in lactate using in-vivo microdialysis in rat brain (Ben-Yoseph et al, 1995) mostly reflects glial metabolism.
Compartmentation of Metabolism
To explain the difference in the results obtained for extracellular lactate and for TCA cycle-related metabolites, it is necessary to consider compartmentation of pyruvate metabolism. Extensive compartmentation of the intracellular pyruvate and lactate pools has previously been observed in astrocytes (Bakken et al, 1997; Obel et al, 2012; Sickmann et al, 2005; Sonnewald et al, 2004). A similar compartmentation of the pyruvate pool is likely to exist in neurons. We suggest that there is one pool of pyruvate in association with the production of releasable lactate, which is almost exclusively derived from glycolysis, while there is another pool of pyruvate that is converted to acetyl CoA and associated with the TCA cycle to which the PPP contributes considerably. This compartmentation is likely to involve also glycolytic enzymes and intermediates and suggests that the glycolytic enzymes catalyzing the conversion of fructose-6-phosphate and G-3-P generated after PPP activity are located in an intracellular microenvironment distinct from that of the glycolytic enzymes metabolizing glucose not entering the PPP. During oxidative stress neurons do label extracellular lactate via the PPP, but it is unknown whether the metabolic compartments are affected differently. Hence, analysis of lactate in the extracellular milieu provides an incomplete picture of the importance of the PPP in cellular metabolism, especially with regard to neuronal metabolism.
Quantitative Comparison of Glycolysis and Pentose Phosphate Pathway in Neuronal Cell Cultures
To compare glycolysis and PPP activity quantitatively, we used [2-13C]glucose that gives rise to different labeling patterns in glutamate depending on the pathway (Figure 1). Our results point to very active glycolysis relative to PPP as observed by several fold higher 13C label in glutamate C5 compared with C4. In addition, the PPP/GM ratios calculated on the basis of glutamate isotopomers show that the PPP accounts for only 4% to 6% of the GM. It should be noted that to observe 13C labeling in glutamate from [2-13C]glucose, the glucose must in fact have passed through both the oxidative and the nonoxidative stages of the PPP and reentered the glycolysis at the level of fructose-6-phosphate or G-3-P. Thus, the presence of label in TCA cycle intermediates is proof of activity of the nonoxidative stage as well as the oxidative stage of PPP. This is in contrast to previous assumptions, that the nonoxidative stage of the PPP is absent in neurons (Banki et al, 1994; Bolanos and Almeida, 2010; Herrero-Mendez et al, 2009). However, analysis of TCA cycle intermediates cannot be used to quantify the amount of glucose that only passes through the oxidative stage. In comparison, a very high PPP activity was found in neurons in suspension using a method measuring only the oxidative stage (Herrero-Mendez et al, 2009). However, this preparation does not represent intact cells but possibly a mixture of cell bodies and nerve endings, a condition that is likely to influence the PPP. The high PPP activity found in cell suspensions (0.74 nmol/h for 106 cells) compared with the low rate of glycolysis (0.33 nmol/h for 106 cells) is equivalent to a PPP/GM ratio of almost 70%. In the present study, we used monolayers of cerebral cortical and cerebellar neurons in culture representing functionally intact neurons (Ehrhart-Bornstein et al, 1991). To compare the results of the study by Herrero-Mendez et al (2009) with our findings in cortical neurons, we used the amount of different isotopomers of glutamate to calculate the amount of glucose metabolized via glycolysis and the PPP before TCA cycle metabolism. We found that incorporation of 13C label from glucose into glutamate via the two metabolic pathways occurred at a rate corresponding to 6 nmol glucose/mg protein/h via glycolysis and 1 nmol glucose/mg protein/h via the PPP. Using the data published by Herrero-Mendez et al (2009), it could be calculated that glycolysis consumed ∼0.5 nmol glucose/mg protein/h, and the PPP consumed ∼1 nmol glucose/mg protein/h in neurons in suspension (calculated using: flux/0.7 mg protein, which is a factor given in the mentioned paper to calculate from ‘per cells' to ‘per mg protein'). Thus, the values for PPP activity were similar in the two studies, indicating that most of the glucose metabolized in the oxidative stage actually proceeds through the nonoxidative stage. In contrast, the values for glycolysis in neuronal cell suspensions are radically different from the values obtained for neuronal cultures. Consequently, in intact neurons in culture, glycolysis is the main pathway for glucose catabolism albeit PPP activity contributes with ∼5%.
Conclusion
We have shown that incubation with [2-13C]glucose and [3-13C]glucose in combination with MRS and MS can be used to estimate PPP activity in intact monolayers of cerebral cortical and cerebellar neurons in culture. This is the first demonstration that pyruvate generated from glucose via the PPP contributes to the synthesis of acetyl CoA for oxidation in the TCA cycle and leads to labeling of TCA cycle intermediates and related amino acids. Interestingly, the PPP does not contribute detectably to the production of releasable lactate in neuronal cultures. In both neocortical and cerebellar neurons, there is significantly more glycolysis compared with PPP activity. In cortical neurons, PPP activity contributes to ∼6% of the glutamate labeling, while this ratio is ∼4% in cerebellar neurons. Whereas PPP activity at the level of lactate has previously been shown in preparations of neocortical neurons (Ben-Yoseph et al, 1996; Herrero-Mendez et al, 2009) the present study represents, to our knowledge, the first direct demonstration of PPP activity in glutamatergic cerebellar granule neurons.
Acknowledgments
Both laboratories contributed equally to this research. The technical assistance from Lars Evje and Heidi Nielsen was very much appreciated. Financial support from the Danish Medical Research Council (09-063393, 10-094362) is cordially acknowledged.
The authors declare no conflict of interest.
Footnotes
This work was funded by the Danish Medical Research Council (grant numbers 09-063393 and 10-094362).
References
- Allaman I, Gavillet M, Belanger M, Laroche T, Viertl D, Lashuel HA, Magistretti PJ. Amyloid-beta aggregates cause alterations of astrocytic metabolic phenotype: impact on neuronal viability. J Neurosci. 2010;30:3326–3338. doi: 10.1523/JNEUROSCI.5098-09.2010. [DOI] [PMC free article] [PubMed] [Google Scholar]
- Appel SH, Parrot BL. Hexose monophosphate pathway in synapses. Journal of neurochemistry. 1970;17:1619–1626. doi: 10.1111/j.1471-4159.1970.tb11386.x. [DOI] [PubMed] [Google Scholar]
- Badar-Goffer RS, Bachelard HS, Morris PG. Cerebral metabolism of acetate and glucose studied by 13C-NMR spectroscopy. A technique for investigating metabolic compartmentation in the brain. Biochem J. 1990;266:133–139. doi: 10.1042/bj2660133. [DOI] [PMC free article] [PubMed] [Google Scholar]
- Bakken IJ, White LR, Aasly J, Unsgard G, Sonnewald U. Lactate formation from [U-13C]aspartate in cultured astrocytes: compartmentation of pyruvate metabolism. Neurosci Lett. 1997;237:117–120. doi: 10.1016/s0304-3940(97)00834-3. [DOI] [PubMed] [Google Scholar]
- Banki K, Colombo E, Sia F, Halladay D, Mattson DH, Tatum AH, Massa PT, Phillips PE, Perl A. Oligodendrocyte-specific expression and autoantigenicity of transaldolase in multiple sclerosis. J Exp Med. 1994;180:1649–1663. doi: 10.1084/jem.180.5.1649. [DOI] [PMC free article] [PubMed] [Google Scholar]
- Bauer U, Brand K. Carbon balance studies of glucose metabolism in rat cerebral cortical synaptosomes. J Neurochem. 1982;39:239–243. doi: 10.1111/j.1471-4159.1982.tb04725.x. [DOI] [PubMed] [Google Scholar]
- Belhage B, Hansen GH, Schousboe A. Depolarization by K+ and glutamate activates different neurotransmitter release mechanisms in GABAergic neurons: vesicular versus non-vesicular release of GABA. Neuroscience. 1993;54:1019–1034. doi: 10.1016/0306-4522(93)90592-4. [DOI] [PubMed] [Google Scholar]
- Ben-Yoseph O, Boxer PA, Ross BD. Assessment of the role of the glutathione and pentose phosphate pathways in the protection of primary cerebrocortical cultures from oxidative stress. J Neurochem. 1996;66:2329–2337. doi: 10.1046/j.1471-4159.1996.66062329.x. [DOI] [PubMed] [Google Scholar]
- Ben-Yoseph O, Camp DM, Robinson TE, Ross BD. Dynamic measurements of cerebral pentose phosphate pathway activity in vivo using [1,6-13C2,6,6-2H2]glucose and microdialysis. J Neurochem. 1995;64:1336–1342. doi: 10.1046/j.1471-4159.1995.64031336.x. [DOI] [PubMed] [Google Scholar]
- Bolanos JP, Almeida A. The pentose-phosphate pathway in neuronal survival against nitrosative stress. IUBMB Life. 2010;62:14–18. doi: 10.1002/iub.280. [DOI] [PubMed] [Google Scholar]
- Brekke E, Walls AB, Norfeldt L, Schousboe A, Waagepetersen HS, Sonnewald U. Direct measurement of backflux between oxaloacetate and fumarate following pyruvate carboxylation. Glia. 2012;60:147–158. doi: 10.1002/glia.21265. [DOI] [PubMed] [Google Scholar]
- Cataldo AM, Broadwell RD. Cytochemical identification of cerebral glycogen and glucose-6-phosphatase activity under normal and experimental conditions. II. Choroid plexus and ependymal epithelia, endothelia and pericytes. J Neurocytol. 1986;15:511–524. doi: 10.1007/BF01611733. [DOI] [PubMed] [Google Scholar]
- Drejer J, Honore T, Schousboe A. Excitatory amino acid-induced release of 3H-GABA from cultured mouse cerebral cortex interneurons. J Neurosci. 1987;7:2910–2916. doi: 10.1523/JNEUROSCI.07-09-02910.1987. [DOI] [PMC free article] [PubMed] [Google Scholar]
- Drejer J, Larsson OM, Kvamme E, Svenneby G, Hertz L, Schousboe A. Ontogenetic development of glutamate metabolizing enzymes in cultured cerebellar granule cells and in cerebellum in vivo. Neurochem Res. 1985;10:49–62. doi: 10.1007/BF00964771. [DOI] [PubMed] [Google Scholar]
- Drejer J, Schousboe A. Selection of a pure cerebellar granule cell culture by kainate treatment. Neurochem Res. 1989;14:751–754. doi: 10.1007/BF00964953. [DOI] [PubMed] [Google Scholar]
- Dringen R, Pfeiffer B, Hamprecht B. Synthesis of the antioxidant glutathione in neurons: supply by astrocytes of CysGly as precursor for neuronal glutathione. J Neurosci. 1999;19:562–569. doi: 10.1523/JNEUROSCI.19-02-00562.1999. [DOI] [PMC free article] [PubMed] [Google Scholar]
- Dusick JR, Glenn TC, Lee WN, Vespa PM, Kelly DF, Lee SM, Hovda DA, Martin NA. Increased pentose phosphate pathway flux after clinical traumatic brain injury: a [1,2-13C2]glucose labeling study in humans. J Cereb Blood Flow Metab. 2007;27:1593–1602. doi: 10.1038/sj.jcbfm.9600458. [DOI] [PubMed] [Google Scholar]
- Ehrhart-Bornstein M, Treiman M, Hansen GH, Schousboe A, Thorn NA, Frandsen A. Parallel expression of synaptophysin and evoked neurotransmitter release during development of cultured neurons. Int J Dev Neurosci. 1991;9:463–471. doi: 10.1016/0736-5748(91)90032-h. [DOI] [PubMed] [Google Scholar]
- Filosa S, Fico A, Paglialunga F, Balestrieri M, Crooke A, Verde P, Abrescia P, Bautista JM, Martini G. Failure to increase glucose consumption through the pentose-phosphate pathway results in the death of glucose-6-phosphate dehydrogenase gene-deleted mouse embryonic stem cells subjected to oxidative stress. Biochem J. 2003;370:935–943. doi: 10.1042/BJ20021614. [DOI] [PMC free article] [PubMed] [Google Scholar]
- Geddes JW, Wood JD. Changes in the amino acid content of nerve endings (synaptosomes) induced by drugs that alter the metabolism of glutamate and gamma-aminobutyric acid. J Neurochem. 1984;42:16–24. doi: 10.1111/j.1471-4159.1984.tb09691.x. [DOI] [PubMed] [Google Scholar]
- Herrero-Mendez A, Almeida A, Fernandez E, Maestre C, Moncada S, Bolanos JP. The bioenergetic and antioxidant status of neurons is controlled by continuous degradation of a key glycolytic enzyme by APC/C-Cdh1. Nat Cell Biol. 2009;11:747–752. doi: 10.1038/ncb1881. [DOI] [PubMed] [Google Scholar]
- Hertz L, Drejer J, Schousboe A. Energy metabolism in glutamatergic neurons, GABAergic neurons and astrocytes in primary cultures. Neurochem Res. 1988;13:605–610. doi: 10.1007/BF00973275. [DOI] [PubMed] [Google Scholar]
- Hertz L, Juurlink BHJ, Fosmark H, Schousboe A.1982Astrocytes in primary cultures Neuroscience Approached Through Cell Culture(Pfeiffer SE, ed), vol. 1.Boca Raton, Florida: CRC press; 175–186. [Google Scholar]
- Hertz L, Juurlink BHJ, Hertz E, Fosmark H, Schousboe A. A Dissection and Tissue Culture Manual for the Nervous System. Alan R. Liss: New York; 1989. Preparation of primary cultures of mouse (rat) astrocytes. [Google Scholar]
- Hostetler KY, Landau BR. Estimation of the pentose cycle contribution to glucose metabolism in tissue in vivo. Biochemistry. 1967;6:2961–2964. doi: 10.1021/bi00862a001. [DOI] [PubMed] [Google Scholar]
- Hothersall JS, Greenbaum AL, McLean P. The functional significance of the pentose phosphate pathway in synaptosomes: protection against peroxidative damage by catecholamines and oxidants. J Neurochem. 1982;39:1325–1332. doi: 10.1111/j.1471-4159.1982.tb12574.x. [DOI] [PubMed] [Google Scholar]
- Katz J, Landau BR, Bartsch GE. The pentose cycle, triose phosphate isomerization, and lipogenesis in rat adipose tissue. J Biol Chem. 1966;241:727–740. [PubMed] [Google Scholar]
- Katz J, Wood HG. The use of glucose-C14 for the evaluation of the pathways of glucose metabolism. J Biol Chem. 1960;235:2165–2177. [PubMed] [Google Scholar]
- Kingsley-Hickman PB, Ross BD, Krick T. Hexose monophosphate shunt measurement in cultured cells with [1-13C]glucose: correction for endogenous carbon sources using [6-13C] glucose. Anal Biochem. 1990;185:235–237. doi: 10.1016/0003-2697(90)90285-h. [DOI] [PubMed] [Google Scholar]
- Larsson OM, Drejer J, Kvamme E, Svenneby G, Hertz L, Schousboe A. Ontogenetic development of glutamate and GABA metabolizing enzymes in cultured cerebral cortex interneurons and in cerebral cortex in vivo. Int J Dev Neurosci. 1985;3:177–185. doi: 10.1016/0736-5748(85)90008-5. [DOI] [PubMed] [Google Scholar]
- Lowry OH, Rosebrough NJ, Farr AL, Randall RJ. Protein measurement with the Folin phenol reagent. J Biol Chem. 1951;193:265–275. [PubMed] [Google Scholar]
- Mawhinney TP, Robinett RS, Atalay A, Madson MA. Analysis of amino acids as their tert.-butyldimethylsilyl derivatives by gas-liquid chromatography and mass spectrometry. J Chromatogr. 1986;358:231–242. doi: 10.1016/s0021-9673(01)90333-4. [DOI] [PubMed] [Google Scholar]
- McKenna MC, Dienel GA, Sonnewald U, Waagepetersen HS, Schousboe A.2012Energy Metabolism of the Brain Basic Neurochemistry(Siegel G, Albers W, Price D, Brady S, eds), 8th edn.London: Elsevier; 223–258.(in press) [Google Scholar]
- Melø TM, Nehlig A, Sonnewald U. Neuronal-glial interactions in rats fed a ketogenic diet. Neurochem Int. 2006;48:498–507. doi: 10.1016/j.neuint.2005.12.037. [DOI] [PubMed] [Google Scholar]
- Obel LF, Andersen KM, Bak LK, Schousboe A, Waagepetersen HS. Effects of adrenergic agents on intracellular Ca2+ homeostasis and metabolism of glucose in astrocytes with an emphasis on pyruvate carboxylation, oxidative decarboxylation and recycling: implications for glutamate neurotransmission and excitotoxicity. Neurotox Res. 2012;21:405–417. doi: 10.1007/s12640-011-9296-1. [DOI] [PubMed] [Google Scholar]
- Patel MS. The relative significance of CO2-fixing enzymes in the metabolism of rat brain. J Neurochem. 1974;22:717–724. doi: 10.1111/j.1471-4159.1974.tb04285.x. [DOI] [PubMed] [Google Scholar]
- Ross BD, Kingsley PB, Ben-Yoseph O. Measurement of pentose phosphate-pathway activity in a single incubation with [1,6-13C2,6,6-2H2]glucose. Biochem J. 1994;302 (Pt 1:31–38. doi: 10.1042/bj3020031. [DOI] [PMC free article] [PubMed] [Google Scholar]
- Schousboe A, Drejer J, Hansen GH, Meier E. Cultured neurons as model systems for biochemical and pharmacological studies on receptors for neurotransmitter amino acids. Dev Neurosci. 1985;7:252–262. doi: 10.1159/000112294. [DOI] [PubMed] [Google Scholar]
- Schousboe A, Meier E, Drejer J, Hertz L.1989Preparation of primary cultures of mouse (rat) cerebellar granule cells A Dissection and Tissue Culture Manual for the Nervous System(Shahar A, de Vellis J, Vernadakis A, Haber B, eds),New York: Alan R. Liss; pp 183–186. [Google Scholar]
- Sickmann HM, Schousboe A, Fosgerau K, Waagepetersen HS. Compartmentation of lactate originating from glycogen and glucose in cultured astrocytes. Neurochem Res. 2005;30:1295–1304. doi: 10.1007/s11064-005-8801-4. [DOI] [PubMed] [Google Scholar]
- Sonnewald U, Schousboe A, Qu H, Waagepetersen HS. Intracellular metabolic compartmentation assessed by 13C magnetic resonance spectroscopy. Neurochem Int. 2004;45:305–310. doi: 10.1016/j.neuint.2003.10.010. [DOI] [PubMed] [Google Scholar]
- Takahashi S, Izawa Y, Suzuki N. Astroglial pentose phosphate pathway rates in response to high-glucose environments. ASN Neuro. 2012;4:pii: e00078.. doi: 10.1042/AN20120002. [DOI] [PMC free article] [PubMed] [Google Scholar]
- Vannucci SJ, Simpson IA. Developmental switch in brain nutrient transporter expression in the rat. Am J Physiol Endocrinol Metab. 2003;285:E1127–E1134. doi: 10.1152/ajpendo.00187.2003. [DOI] [PubMed] [Google Scholar]
- White CW, Jackson JH, McMurtry IF, Repine JE. Hypoxia increases glutathione redox cycle and protects rat lungs against oxidants. J Appl Physiol. 1988;65:2607–2616. doi: 10.1152/jappl.1988.65.6.2607. [DOI] [PubMed] [Google Scholar]
- Wood HG, Katz J, Landau BR. Estimation of Pathways of Carbohydrate Metabolism. Biochem Z. 1963;338:809–847. [PubMed] [Google Scholar]
- Yu AC, Drejer J, Hertz L, Schousboe A. Pyruvate carboxylase activity in primary cultures of astrocytes and neurons. J Neurochem. 1983;41:1484–1487. doi: 10.1111/j.1471-4159.1983.tb00849.x. [DOI] [PubMed] [Google Scholar]
- Zubairu S, Hothersall JS, El-Hassan A, McLean P, Greenbaum AL. Alternative pathways of glucose utilization in brain: changes in the pattern of glucose utilization and of the response of the pentose phosphate pathway to 5-hydroxytryptamine during aging. J Neurochem. 1983;41:76–83. doi: 10.1111/j.1471-4159.1983.tb11816.x. [DOI] [PubMed] [Google Scholar]