

Abstract
Perfusion-diffusion (perfusion-weighted imaging (PWI)/diffusion-weighted imaging (DWI)) mismatch is used to identify penumbra in acute stroke. However, limitations in penumbra detection with mismatch are recognized, with a lack of consensus on thresholds, quantification and validation of mismatch. We determined perfusion and diffusion thresholds from final infarct in the clinically relevant spontaneously hypertensive stroke-prone (SHRSP) rat and its normotensive control strain, Wistar-Kyoto (WKY) and compared three methods for penumbra calculation. After permanent middle cerebral artery occlusion (MCAO) (WKY n=12, SHRSP n=15), diffusion-weighted (DWI) and perfusion-weighted (PWI) images were obtained for 4 hours post stroke and final infarct determined at 24 hours on T2 scans. The PWI/DWI mismatch was calculated from volumetric assessment (perfusion deficit volume minus apparent diffusion coefficient (ADC)-defined lesion volume) or spatial assessment of mismatch area on each coronal slice. The ADC-derived lesion growth provided the third, retrospective measure of penumbra. At 1 hour after MCAO, volumetric mismatch detected smaller volumes of penumbra in both strains (SHRSP: 31±50 mm3, WKY: 22±59 mm3, mean±s.d.) compared with spatial assessment (SHRSP: 36±15 mm3, WKY: 43±43 mm3) and ADC lesion expansion (SHRSP: 41±45 mm3, WKY: 65±41 mm3), although these differences were not statistically significant. Spatial assessment appears most informative, using both diffusion and perfusion data, eliminating the influence of negative mismatch and allowing the anatomical location of penumbra to be assessed at given time points after stroke.
Keywords: hypertension, ischemic penumbra, MRI, perfusion-diffusion mismatch, SHRSP
Introduction
In acute ischemic stroke, the identification and successful recovery of potentially salvageable tissue, or penumbra, can be considered as the ultimate goal of clinicians and experimental stroke researchers. The ischemic penumbra, a long-standing concept first proposed over 30 years ago, represents tissue that is less severely hypoperfused than the ischemic core, and where neurons are functionally impaired but are not yet irreversibly damaged (Astrup et al, 1981). However, the penumbra will progress to infarction in the absence of therapeutic intervention or spontaneous reperfusion. Therefore, its detection in the acute stages of stroke is vital in identifying those patients who are most likely to benefit from thrombolytic therapy.
Positron emission tomography remains the “gold-standard” imaging modality for penumbra detection, identifying penumbral tissue on the basis of specific metabolic parameters (Sobesky et al, 2005) but the radiation exposure, complex logistics, and costs of positron emission tomography limit its wider use. Magnetic resonance imaging (MRI) perfusion-diffusion (perfusion-weighted imaging (PWI)/diffusion-weighted imaging (DWI)) mismatch is used to identify the penumbra, in both clinical and basic stroke research (Heiss, 2010). In acute stroke, MR DWI can identify tissue in which diffusion is restricted as a result of cytotoxic edema, leading to a reduction in the apparent diffusion coefficient (ADC) value of the tissue. This evidence of brain injury is used within PWI/DWI mismatch methodology to represent the irreversibly damaged ischemic core. Perfusion-weighted imaging is used to delineate the perfusion deficit, identifying hypoperfused tissue destined to proceed to infarction. The PWI can be performed by two main techniques; either by addition of a gadolinium-based contrast agent (dynamic susceptibility contrast MRI) or noninvasively by tagging protons in the arterial blood supply with an inversion pulse (arterial spin labelling). The mismatch between the PWI-defined perfusion deficit and DWI-defined ischemic core is used to provide an approximation of the ischemic penumbra: potentially salvageable tissue with a finite lifespan that will proceed to infarction over time.
At present, there is no consensus on the optimal MRI perfusion parameter to use clinically or what threshold to apply to determine the perfusion deficit (Kane et al, 2007). The volume of penumbra quantified by the mismatch technique will therefore vary considerably depending on the perfusion parameter and the threshold value used to define hypoperfused tissue. In a study of 32 patients, these authors showed that the proportion of patients presenting with perfusion-diffusion mismatch varied between 9% and 72% depending on which of 10 different MRI methods were used to detect the perfusion deficit in each patient (Kane et al, 2007). This lack of consensus will impact on patient management where mismatch volume is used to determine suitability for therapy and this report highlights the need for agreement in the method used to identify penumbra in stroke patients.
In preclinical research, there is a similar lack of literature on critical examination of PWI/DWI mismatch methodology. In experimental stroke models, mismatch volume is commonly calculated by subtracting the ADC lesion volume from the volume of perfusion deficit without any anatomical coregistration (Meng et al, 2004). As is the case in clinical research (Bandera et al, 2006), there is no consensus on thresholds of perfusion and diffusion abnormality in preclinical research. Furthermore, perfusion and diffusion thresholds have yet to be defined in animal models incorporating genetic stroke risk factors. Previously established thresholds in one rat strain may not be applicable in other strains due to differences in infarct evolution (Bardutzky et al, 2005).
Hypertension, a well-established major stroke risk factor in humans, is modelled in preclinical stroke research using strains such as the spontaneously hypertensive rat (SHR) and spontaneously hypertensive stroke-prone (SHRSP) rat. The SHRSP strain, developed in the 1970s by selective inbreeding of SHR's, are normotensive until around 8 weeks of age when systolic blood pressure (BP) begins to rise progressively, resulting in severe hypertension (Okamoto et al, 1974). The strain is prone to spontaneous ischemic and hemorrhagic stroke and exhibits an increased sensitivity to experimental stroke, compared with the normotensive control strain the Wistar-Kyoto (WKY), the strain that the SHR and SHRSP were originally derived from Coyle and Jokelainen (Coyle and Jokelainen, 1983). The SHRSP also show impaired functional recovery after experimental stroke (McGill et al, 2005). Many factors, in addition to genetic hypertension, are believed to contribute to increased stroke sensitivity in SHRSP, including impaired collateral flow (Coyle and Jokelainen, 1983), increased levels of oxidative stress (Kishi et al, 2004), and inflammation and dysfunction of the blood–brain barrier (Marks et al, 2001).
The aim of the present study was to calculate strain-specific thresholds of diffusion and perfusion abnormality in the SHRSP and WKY, and apply these thresholds to temporal diffusion and perfusion data sets to compare three different methods of penumbra detection. Permanent middle cerebral artery occlusion (MCAO) was induced in SHRSP and WKY rats and penumbra volume was calculated using volumetric perfusion-diffusion mismatch, slice-by-slice delineation of mismatch area using pixel-by-pixel analysis, and ADC lesion growth to identify the strengths and limitations of each method.
Materials and methods
All procedures were performed under license from the UK Home Office, in accordance with the Animals (Scientific Procedures) Act (1986) and approved by the University Ethical Review Panel. Male WKY and SHRSP rats, aged 16 to 20 weeks, were obtained from inbred colonies within the Institute of Cardiovascular and Medical Sciences, University of Glasgow.
Tail Cuff Plethysmography
All animals underwent a 5-day training period to allow acclimatization to the procedure before measurement of systolic BP using the noninvasive tail cuff method (Evans et al, 1994). From 11 weeks of age until stroke surgery, systolic BP was measured three times weekly. In each session, 10 BP readings were recorded for each animal to obtain a mean value of systolic BP. Data were compiled to compare the mean systolic BP for each strain.
Animal Preparation
Age-matched (16 to 20 weeks old) male WKY (n=12, 290 to 350 g) and SHRSP (n=15, 250 to 330 g) were anesthetized (5% isoflurane), intubated and artificially ventilated and anesthesia maintained throughout with 2% to 2.5% isoflurane delivered in a 70/30 mixture of N2O/O2. The right femoral artery was cannulated (PE 50 tubing; Portex, Ashford, UK) to allow continuous monitoring of heart rate and mean arterial blood pressure (Biopac Systems, Goleta, CA, USA) with blood sampling every hour to ensure blood pH, PaCO2 and PaO2 (Bayer, Uxbridge, UK; Rapidlab 248) were maintained within the physiological range. Body temperature was assessed by a rectal thermocouple and maintained at 37±0.5°C throughout the experimental procedure.
Middle Cerebral Artery Occlusion
The left middle cerebral artery (MCA) was permanently occluded using the intraluminal filament technique as previously described (Longa et al, 1989). In brief, the common carotid artery bifurcation and the proximal pterygopalatine artery were ligated using 4-0 silk suture. The ascending pharyngeal and occipital branches of the external carotid artery were electro-coagulated and transected. This was followed by ligation, electro-coagulation, and transection of the external carotid artery, creating a stump to allow a silicon-tipped nylon monofilament (tip length: 5 to 6 mm, diameter: 0.31 to 0.35 mm; Doccol Corporation, Redlands, CA, USA) to be advanced 19 to 20 mm from the carotid bifurcation, along the internal carotid artery to permanently occlude the origin of the MCA.
Magnetic Resonance Imaging Scanning Protocol
All MRI data were acquired using a Bruker Biospec 7 T/30 cm system (Ettlingen, Germany) with a gradient coil (internal diameter=121 mm, 400 mT/m) and a 72-mm birdcage resonator. After MCAO, animals were immediately transferred to the MRI scanner, secured within the cradle by tooth and ear bars to restrict head movement, and a rat head 4-channel phased array surface receiver coil was placed on the head. Body temperature was maintained at 37±0.5°C during the MRI scanning procedure by a closed circuit thermal jacket.
Once a pilot sequence had been obtained to ensure correct geometry, a 4-shot spin-echo planar imaging DWI scan (echo time=22 ms, repetition time=4,000.3 ms, matrix=96 × 96, field of view=25 × 25 mm, three directions=x, y, z, B values=0 and 1,000 s/mm2, eight coronal slices; 1.5 mm thick) was performed at 30 minutes after MCAO to allow quantitative ADC map production and assessment of ischemically injured tissue. The DWI scans were then repeated on the hour from 1 to 4 hours after MCAO.
Noninvasive quantitative cerebral blood flow (CBF) measurements were performed on six coronal slices within the MCA territory (slices 2 to 7 of the DWI scan) using a form of continuous arterial spin labelling based on a train of adiabatic inversion pulses (Moffat et al, 2005). The sequence uses a spin-echo echo planar imaging module (echo time=20 ms, repetition time=7,000 ms, matrix=96 × 96, field of view=25 × 25 mm, slice thickness=1.5 mm, 16 averages, 4 shots) preceded by 50 hyperbolic secant inversion pulses in a 3-second train. For quantification of CBF maps, T1 maps were acquired using an echo planar imaging inversion recovery sequence (echo time=20 ms, repetition time=10,000 ms, matrix=96 × 96, field of view=25 × 25 mm, slice thickness-1.5 mm, 16 averages, 4 shots, using 16 inversion times). The CBF maps and T1 maps were acquired every hour for 4 hours after stroke.
Animals were removed from the MRI scanner and allowed to recover from anesthesia after the 4-hour scanning session. The femoral artery cannula and ventilation tube were removed and the animals were individually housed with free access to soft diet and water. General condition was assessed regularly and recorded.
At 24 hours after MCAO, animals were reanesthetized (5% isoflurane in 70/30 N2O/O2 mixture) and transferred to the MRI scanner where anesthesia was maintained via a face mask (2% isoflurane in 70/30 N2O/O2 mixture). A RARE T2-weighted sequence was acquired (echo time=72 ms, repetition time=5,086 ms, matrix=256 × 256, 16 coronal slices; 0.75 mm thick) to allow calculation of final infarct volume.
Data Analysis
Quantitative ADC maps, in units of square millimeters per second, were generated in Paravision 5 software (Bruker, Germany) and subsequently analyzed using Image J software (http://rsb.info.nih.gov/ij/). Quantitative CBF maps (units: mL/100 g per minute) were calculated using the formula for continuous labelling (Williams et al, 1992)
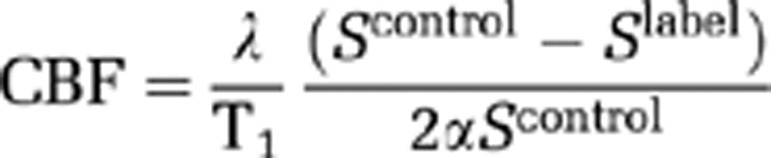 |
where α is the inversion pulse efficiency of 0.8, λ is the blood tissue partition function (assumed to be 0.9), and the tissue T1 was determined from the T1 maps generated at each time point. Scontrol and Slabel are the signal intensity from the control and labelled images, acquired with inversion pulses applied above the head and in the neck, respectively.
Final infarct at 24 hours after stroke was defined as the hyperintense area on T2-weighted images. Hyperintensity was manually delineated on the slices that anatomically matched the six acute ADC and CBF slices and areas multiplied by the slice thickness to calculate volume. Contralateral and ipsilateral hemispheres volumes were also determined. All final infarct calculations were corrected for edema using published equations (Gerriets et al, 2004).
Thresholds of abnormality for both ADC and CBF were established by adjusting the respective threshold values until the volume of the ADC lesion and perfusion deficit at 4 hours after MCAO was equal to the edema-corrected T2-weighted final infarct volume at 24 hours. These thresholds were then applied retrospectively to the data to calculate ADC lesion and PWI perfusion deficit volumes over the first 4 hours after stroke.
Calculation of Penumbra from Perfusion-Diffusion Mismatch and Apparent Diffusion Coefficient Lesion Growth
Penumbra, as defined by perfusion-diffusion mismatch, was calculated by two different methods. For the volumetric assessment of mismatch, the ADC-derived lesion volume was subtracted from the volume of perfusion deficit at each time point. Mismatch volume was also calculated by spatial assessment of perfusion-diffusion mismatch on each slice, with the exclusion of the ventricles. For this method, ADC and CBF maps were coregistered and an unbiased approach, using a programme written with Matlab software (Mathworks Inc., Cambridge, UK), was used to assign individual pixels within the ipsilateral hemisphere to one of four compartments, based on whether ADC and CBF values of each pixel were above or below the respective thresholds: core (both ADC and CBF below threshold), mismatch (ADC above and CBF below threshold), negative mismatch (ADC below and CBF above threshold), normal (both ADC and CBF above threshold). Perfusion-diffusion mismatch area on each slice, generated from pixel numbers, was multiplied by slice thickness to calculate penumbra volume, and the volumes for each slice added together to generate a penumbra volume for the hemisphere. The spatial locations of pixels within each of the four compartments were reproduced on maps generated in Matlab (see Figure 6).
In addition to calculating the perfusion-diffusion mismatch, penumbral tissue was also assessed retrospectively from the growth of the ADC-derived lesion volume from 30 minutes to 4 hours after MCAO and the final (edema-corrected) infarct volume at 24 hours. All analyses were undertaken blind to rat strain.
Statistical Analysis
All data are presented as mean±s.d. Mean systolic BP, final infarct, and threshold values were compared between the strains using Student's unpaired t-tests. The temporal evolution of ischemic injury, perfusion deficit, physiological parameters, contralateral CBF, and penumbra volume for each strain was assessed by repeated measures analysis of variance (ANOVA), with Bonferroni's multiple comparisons post-test. Temporal comparisons between strains were assessed by two-way ANOVA with Bonferroni's post-test. Level of statistical significance was set at P<0.05.
Results
Physiological Parameters
Mean systolic pressure as measured by the tail cuff method in conscious rats was significantly higher in SHRSP (183±12 mm Hg) compared with age-matched WKY (133±9 mm Hg, P<0.001) at 16 weeks of age. Physiological parameters were maintained within the normal physiological range throughout the duration of surgery and MRI scanning procedures in both WKY and SHRSP (P>0.05; Table 1). All parameters were comparable between the strains during the entire experimental procedure (P>0.05), with the exception of mean arterial blood pressure and arterial PO2, which were significantly higher in SHRSP at all time points (P<0.05).
Table 1. Physiological parameters of WKY (n=12) and SHRSP (n=15) measured before permanent middle cerebral artery occlusion and 1 and 4 hours after surgery.
| Physiological parameter | Baseline | 1 hour | 4 hours |
|---|---|---|---|
| WKY (n=12) | |||
| Body temperature (°C) | 36.9±0.4 | 37.0±0.5 | 37.0±0.3 |
| MABP (mm Hg) | 85±5 | 92±7 | 89±7 |
| Heart rate (b.p.m.) | 342±23 | 351±25 | 358±19 |
| Blood pH | 7.42±0.04 | 7.35±0.04 | 7.37±0.03 |
| PaO2 (mm Hg) | 119±18 | 119±23 | 124±19 |
| PaCO2 (mm Hg) | 39±6 | 44±5 | 41±6 |
| SHRSP (n=15) | |||
| Body temperature (°C) | 36.8±0.4 | 37.1±0.3 | 37.0±0.4 |
| MABP (mm Hg) | 109±10 | 106±9 | 107±10 |
| Heart rate (b.p.m.) | 348±28 | 358±33 | 359±20 |
| Blood pH | 7.43±0.06 | 7.40±0.04 | 7.41±0.03 |
| PaO2 (mm Hg) | 147±27 | 158±31 | 148±24 |
| PaCO2 (mm Hg) | 39±4 | 41±7 | 38±3 |
MABP, mean arterial blood pressure; WKY, Wistar-Kyoto; SHRSP, spontaneously hypertensive stroke-prone.
All data are presented as mean±s.d.
Final Infarct, Diffusion and Perfusion Thresholds
Two out of twelve WKY rats and five out of fifteen SHRSP rats died overnight before final infarct could be determined by T2-weighted imaging at 24 hours after MCAO. The ADC and CBF thresholds were generated from the animals that successfully recovered until 24 hours after MCAO (WKY: n=10, SHRSP: n=10). However, the calculated thresholds were applied retrospectively to all rats to determine the acute evolution of ischemic injury and perfusion deficit (WKY: n=12, SHRSP: n=15).
The SHRSP showed significantly larger infarct volumes at 24 hours after MCAO compared with WKY (387±55 versus 303±59 mm3, P=0.004, respectively). Ipsilateral and contralateral hemisphere data for the six coronal slices generated were combined to calculate brain volume. There was no significant difference in brain volume, between WKY (1,105±49 mm3) and SHRSP (1,063±30 mm3, P=0.07) at 30 minutes after MCAO. There was also no evidence of brain swelling in the acute phase in either strain, as no difference was detected between hemispheres and brain volume did not change significantly over the 4-hour time course (P>0.05).
The profile of ADC values within the entire ipsilateral and contralateral hemisphere is shown in Figure 1A for both WKY and SHRSP rats. The ADC values in the contralateral hemisphere were similar between strains and did not change over the time course. In WKY, mean contralateral ADC was 0.76±0.02 × 10⁻³ mm2/s at 1 hour after MCAO and 0.77±0.01 × 10⁻³ mm2/s at 4 hours (P>0.05). The absolute ADC threshold for WKY, determined from final infarct volume, was 0.61±0.03 × 10⁻³ mm2/s, representing a 21±4% reduction from mean contralateral ADC at 4 hours after MCAO. In SHRSP, mean contralateral ADC was 0.76±0.01 × 10⁻³ mm2/s from 1 to 4 hours after MCAO. The calculated ADC threshold for the hypertensive strain was 0.59±0.03 × 10⁻³ mm2/s, which represents a 23±4% reduction from the mean contralateral ADC value. Both the absolute and the percent reduction ADC thresholds were comparable between the strains (P>0.05).
Figure 1.

Mean apparent diffusion coefficient (ADC) (A) and cerebral blood flow (CBF) profiles (B) of the ipsilateral and contralateral hemispheres in Wistar-Kyoto (WKY) (n=12) and spontaneously hypertensive stroke-prone (SHRSP) (n=15) at 1 and 4 hours after middle cerebral artery occlusion (MCAO). The vertical dotted lines show the respective ADC and CBF thresholds for each strain. (A) Pixels in the ipsilateral hemisphere that have an ADC value below threshold define the ADC lesion. The increased number of pixels to the left of the threshold line shows the larger lesion volume in SHRSP compared with WKY. (B) Pixels in the ipsilateral hemisphere that have a CBF value below threshold define the perfusion deficit. The increased number of pixels to the left of the threshold line shows the larger perfusion deficit in SHRSP compared with WKY. Note the increase in the number of pixels below the CBF thresholds from 1 to 4 hours after MCAO, indicating the expansion of the perfusion deficit over time in both strains. The two strains show a similar distribution of ADC and CBF values in the contralateral hemisphere.
The profile of CBF values across the entire ipsilateral and contralateral hemisphere is shown in Figure 1B. There was no difference in contralateral CBF between WKY and SHRSP rats over the 4-hour time course. In WKY, mean contralateral CBF varied between 135±23 mL/100 g per minute at 1 hour after MCAO and 124±21 mL/100 g per minute at 4 hours (P=0.1). The calculated CBF threshold determined from final infarct volume was 23±8 mL/100 g per minute, an 81±7% reduction in flow from the 4-hour contralateral CBF value. In SHRSP, mean contralateral CBF varied from 113±22 mL/100 g per minute at 1 hour after MCAO to 116±13 mL/100 g per minute at 4 hours (P=0.6). The calculated CBF threshold for SHRSP was 36±13 mL/100 g per minute, representing a 70±9% reduction from 4 hours contralateral CBF. The absolute CBF threshold was significantly higher in SHRSP than in WKY (P<0.05).
Temporal Evolution of Apparent Diffusion Coefficient-Derived Ischemic Injury and Perfusion Deficit
From the profile of ADC pixels within the ipsilateral hemisphere (Figure 1A), it was evident that there was a clear difference in the distribution of ADC values between strains. Strain-specific ADC thresholds were applied to the 30-minute to 4-hour ADC maps to assess the acute evolution of ischemic injury volume in WKY and SHRSP (Figure 2A). The thresholded ADC maps at 4 hours spatially matched the T2-defined infarct at 24 hours in both strains (Figure 3). As early as 30 minutes after MCAO, ADC-derived lesion volume was larger in SHRSP than in WKY (SHRSP: 336±63 mm3; WKY: 203±70 mm3; P<0.001) and remained significantly larger in SHRSP at all subsequent time points (P<0.001; Figure 2A). Temporal increases in ADC-derived lesion volume were observed in both strains (P<0.001; Figure 2A). In SHRSP, ADC-derived ischemic injury significantly increased over time to 410±56 mm3 at 4 hours after MCAO. In WKY, the ADC-derived lesion increased significantly to 311±57 mm3 at 3 hours and reaches a plateau with no further significant growth. This suggests that using this model of stroke, the evolution of acute ischemic injury is complete by ∼3 hours after MCAO in the WKY.
Figure 2.

Acute evolution of (A) ischemic injury and (B) perfusion deficit in Wistar-Kyoto (WKY) (n=12) and spontaneously hypertensive stroke-prone (SHRSP) (n=15) as defined by the application of strain-specific diffusion and perfusion thresholds to quantitative apparent diffusion coefficient (ADC) and cerebral blood flow (CBF) maps, respectively. Both time and strain had a significant effect on ADC lesion volume and perfusion deficit (*P⩽0.01, two-way analysis of variance (ANOVA) with Bonferroni's multiple comparisons post-test).
Figure 3.

Quantitative apparent diffusion coefficient (ADC) maps displaying ischemic injured tissue (dark areas) in a representative Wistar-Kyoto (WKY) and spontaneously hypertensive stroke-prone (SHRSP) at 4 hours after permanent middle cerebral artery occlusion (MCAO). ADC thresholds were adjusted until the ADC-derived lesion (white shading) matched the volume of the corrected final infarct, defined by manually delineating the hyperintense areas on T2-weighted images at 24 hours after MCAO (outlined in red). The color reproduction of this figure is available at the Journal of Cerebral Blood Flow and Metabolism journal online.
Strain-specific CBF thresholds were applied to the 1- to 4-hour CBF maps to determine the acute evolution of the perfusion deficit for each strain. Again, good spatial matching between the thresholded 4-hour CBF maps and the 24-hour T2 final infarct was evident (Figure 4). At all time points after stroke, the perfusion deficit was significantly larger in SHRSP than in WKY (P<0.001; Figure 2B). At 1 hour after MCAO, a perfusion deficit of 368±45 mm3 was observed in SHRSP, compared with 273±69 mm3 in WKY. A significant increase in the volume of perfusion deficit from 1 to 4 hours was observed in both strains: by 4 hours after stroke, the perfusion deficit increased to 318±65 mm3 in WKY (P<0.001) and to 411±48 mm3 in SHRSP (P<0.001; Figure 2B). This increased size of perfusion deficit in SHRSP rats was apparent from the profile of CBF values within the ispilateral hemisphere where a greater number of pixels were distributed below the critical CBF threshold (Figure 1B). Negative CBF values were observed in some pixels with low or zero flow as a consequence of subtracting the magnitude images (Scontrol, Slabel), where the signal difference is comparable to the image noise (Karlsen et al, 1999).
Figure 4.

Quantitative cerebral blood flow (CBF) maps displaying hypoperfused tissue at 4 hours after permanent middle cerebral artery occlusion (MCAO) in a representative Wistar-Kyoto (WKY) and spontaneously hypertensive stroke-prone (SHRSP). CBF thresholds were adjusted until the volume of CBF-defined perfusion deficit (red shading) matched the volume of the corrected final infarct, defined by manually delineating the hyperintense areas on T2-weighted images at 24 hours after stroke (outlined in red).
Perfusion-Diffusion Mismatch and Apparent Diffusion Coefficient Lesion Growth
Mismatch volumes calculated hourly and derived using volumetric and spatial methods are shown in Figure 5, alongside penumbra volume calculated from ADC lesion growth. The volume of mismatch defined by volumetric assessment decreased from 1 to 4 hours in both strains. However, the decrease was statistically significant only in SHRSP (P=0.01). In WKY, volumetric mismatch decreased from 22±59 mm3 at 1 hour to 7±34 mm3 at 4 hours (P=0.24). In SHRSP, volumetric mismatch significantly decreased from 31±50 mm3 at 1 hour to 1±33 mm3 at 4 hours after MCAO (P=0.01). The volumetric method typically generated a smaller mismatch volume than spatial assessment of penumbra in both strains from 1 to 4 hours after MCAO although this was not statistically significant. In WKY, mismatch volume defined by spatial assessment was twofold larger than mismatch volume determined by the volumetric method at 1 hour after MCAO (43±43 versus 22±59 mm3, for spatial and volumetric assessment, respectively). However, the difference in mismatch volume between the methods did not reach statistical significance at any time point (P>0.05, Figure 5). In SHRSP at 1 hour after MCAO, mismatch volume identified by spatial assessment was not significantly different to that defined by volumetric assessment (36±15 versus 31±50 mm3, for spatial and volumetric assessment, respectively, P>0.05; Figure 5).
Figure 5.

Temporal evolution of penumbra in Wistar-Kyoto (WKY) and spontaneously hypertensive stroke-prone (SHRSP) after permanent middle cerebral artery occlusion (MCAO). Penumbral volume was determined by three different methods: volumetric mismatch (WKY: n=12, SHRSP: n=15), where the apparent diffusion coefficient (ADC) lesion volume is subtracted from the perfusion deficit, spatial mismatch (WKY: n=12, SHRSP: n=15), where perfusion-diffusion mismatch is measured on a pixel-by-pixel basis for each slice, and by ADC lesion expansion (WKY: n=10; SHRSP: n=10), which is calculated by subtracting the ADC lesion at each time point from the final infarct volume at 24 hours. In WKY, spatial and volumetric mismatch volume did not decrease significantly over time (P>0.05, repeated measures analysis of variance (ANOVA)). In SHRSP, spatial and volumetric mismatch volume decreased significantly from 1 to 4 hours after MCAO (P<0.05, repeated measures ANOVA). In both strains, penumbra volume defined by ADC growth decreased significantly over time from 30 minutes to 3 hours after MCAO at which point there was no remaining penumbra (P<0.001, repeated measures ANOVA). Data are displayed as mean±s.d.
Spatially defined mismatch volume decreased in both strains over time but this decrease reached statistical significance only in SHRSP. In WKY, spatial mismatch volume decreased from 43±43 mm3 at 1 hour to its lowest value of 27±24 mm3 at 3 hours after MCAO (P=0.15) and 29±18 mm3 at 4 hours. In SHRSP, mismatch volume decreased from 36±15 mm3 at 1 hour to 23±19 mm3 at 4 hours after MCAO (P<0.05). The volumetric data were more variable than the data generated using the spatial method in both WKY and SHRSP. Using the spatial mismatch method, penumbral tissue was mainly located within the cerebral cortex (Figure 6).
Figure 6.

Spatial distribution of perfusion-diffusion mismatch across six coronal slices within the territory of the middle cerebral artery in Wistar-Kyoto (WKY) and spontaneously hypertensive stroke-prone (SHRSP) after permanent middle cerebral artery occlusion (MCAO). Blue shading indicates tissue with an apparent diffusion coefficient (ADC) and cerebral blood flow (CBF) value that decreases below the calculated strain-specific thresholds. Yellow shading indicates the ischemic penumbra as defined by perfusion-diffusion mismatch and orange shading indicates tissue with abnormal diffusion but normal perfusion (negative mismatch). ADC lesion expansion from 1 to 4 hours after stroke is shown in white on quantitative ADC maps. The data shown are from a representative WKY and SHRSP.
The ADC-derived lesion growth significantly decreased with time and by 3 hours after stroke, the lesion matched the final infarct volume in both strains, indicative of no remaining penumbra. In SHRSP, penumbra volume defined by ADC lesion expansion decreased significantly from 43±45 mm3 at 30 minutes to 0±44 mm3 at 3 hours after MCAO (P<0.001). In WKY, penumbra volume also declined significantly over time, decreasing from 106±73 mm3 at 30 minutes to 0±41 mm3 at 3 hours after MCAO (P<0.001). Penumbra volume was significantly greater in WKY compared with SHRSP at 30 minutes after MCAO (P<0.05) but was not significantly different between the strains at later time points. There was no significant difference in penumbra volume calculated by volumetric or spatial mismatch or ADC expansion from 1 to 4 hours after MCAO in both strains (P>0.05; Figure 5).
The ADC-derived lesion evolves in an annular pattern, whereby the lesion expands relatively uniformly at its boundary (Figure 6, white shading). The anatomical location of the penumbra defined by this method therefore differs from that identified by perfusion-diffusion mismatch, where the penumbra is found almost exclusively within the cortex (Figure 6, yellow shading). The ADC-derived lesion and perfusion deficit expand in a similar anatomical direction over time (data not shown).
Negative Mismatch
Pixel-by-pixel analysis provided evidence of negative mismatch tissue, where the ADC-derived lesion expands outside the boundary of the perfusion deficit, in both WKY and SHRSP (Figure 6, orange shading). Negative mismatch volume was comparable between the strains (WKY: 55±17 mm3; SHRSP: 41±19 mm3 at 1 hour after MCAO; P>0.05) and did not change significantly over the 4-hour time course (4 hours data WKY: 53±20 mm3; SHRSP: 42±11 mm3; P>0.05).
In both strains, negative mismatch tissue was hypoperfused compared with contralateral CBF but blood flow was significantly higher than the strain-specific CBF thresholds (Figure 7). For example, in WKY at 1 hour after MCAO, CBF in negative mismatch tissue was significantly lower (49±4 mL/100 g per minute) than contralateral CBF (135±23 mL/100 g per minute, P<0.05) but was significantly higher than the strain-specific CBF threshold (23±8 mL/100 g per minute, P<0.05). Similarly, in SHRSP at the same time point, negative mismatch tissue was hypoperfused (71±9 mL/100 g per minute) compared with contralateral CBF (113±22 mL/100 g per minute, P<0.05) but was significantly higher than the SHRSP perfusion threshold (36±13 mL/100 g per minute, P<0.05).
Figure 7.

Cerebral blood flow (CBF) measured in negative mismatch tissue and the contralateral hemisphere after permanent middle cerebral artery occlusion (MCAO) in Wistar-Kyoto (WKY) (n=12) and spontaneously hypertensive stroke-prone (SHRSP) (n=15). The dotted line demarcates the CBF threshold for each strain. Negative mismatch tissue has ADC values below the apparent diffusion coefficient (ADC) threshold and although significantly hypoperfused compared with the contralateral hemisphere (*P<0.001, two-way analysis of variance (ANOVA) with Bonferroni's post-test), CBF in this region is significantly higher than the strain-specific perfusion threshold at each time point (+P<0.001, one-sample t-test). Data are displayed as mean±s.d.
Discussion
Clinical researchers recognize the need for a consensus in the method used to identify potentially salvageable tissue in stroke patients, as well as the need for consistent thresholds of tissue abnormality (Bandera et al, 2006). Further, the PWI/DWI mismatch method of penumbra determination has yet to be validated in clinical and preclinical stroke research, with no current consensus on perfusion and diffusion thresholds in either research field. The present study is the first to define strain-specific thresholds of diffusion and perfusion abnormality, in a clinically relevant rodent stroke model, the SHRSP. In agreement with previous studies (Marks et al, 2001; McGill et al, 2005; McCabe et al, 2009), infarct size was significantly larger in SHRSP compared with WKY.
The ADC thresholds were comparable between the strains (23% and 21% reduction in ADC for SHRSP and WKY, respectively) and similar to those reported previously in Wistar rats (77% of control), derived from measures of metabolic failure after MCAO (Hoehn-Berlage et al, 1995; Olah et al, 2001). However, our ADC thresholds differ slightly from the threshold of 30% reduction from contralateral hemisphere ADC values reported in Sprague-Dawley rats (Shen et al, 2003), where volumetric assessment was used to match the 3-hour ADC lesion with the TTC-defined infarct at 24 hours after MCAO. Foley and colleagues (2010) defined a similar ADC threshold (77% reduction of mean contralateral ADC) calculated by subtracting a value equivalent to 2s.d. from the mean ADC value of baseline voxels of the ipsilateral hemisphere. This suggests that the threshold for ischemic injury may be different between rat strains since the percent reduction ADC thresholds calculated by different study groups in Sprague-Dawley rats are consistently higher than those determined in Wistar rats and also WKY and SHRSP rats, as shown in the present study.
Our calculated CBF threshold of 36 mL/100 g per minute was significantly higher in SHRSP (70% reduction from contralateral CBF) than the 23 mL/100 g per minute determined for WKY (81% reduction from contralateral CBF). This could suggest that SHRSP have a greater sensitivity to ischemia than WKY. The SHRSP cortical neurons grown in culture are more vulnerable to hypoxic conditions than those from WKY, with a significantly greater rate of cell death after 36 hours of hypoxia (Tagami et al, 1998). The strain-specific CBF thresholds calculated in the present study differ from those previously determined in Wistar rats using tissue acidosis, where the threshold was calculated as a 40% reduction in ipsilateral CBF (Hoehn-Berlage et al, 1995) and in Sprague-Dawley rats where a 57% reduction in CBF was defined by matching the 3-hour perfusion deficit to TTC-defined infarct volume at 24 hours after MCAO (Shen et al, 2003). One factor that may explain these differences is the temporal evolution of the perfusion deficit. Our CBF threshold was derived by matching the volume of perfusion deficit (at 4 hours after stroke) to the final infarct but our data show that the perfusion deficit increased from 1 to 4 hours after MCAO. We assumed that by 4 hours after MCAO there would be no further recruitment of hypoperfused tissue into the perfusion deficit but this may not be the case. Many other factors could influence the calculation of viability thresholds, including method used (autoradiography, MRI sequences), rat strain and stroke model.
Perfusion deficit was significantly larger in SHRSP compared with WKY from 1 to 4 hours after stroke suggesting increased sensitivity to ischemia, as shown by the higher CBF threshold in SHRSP. A CBF threshold of 50 mL/100 g per minute (60% to 70% reduction from basal CBF) has been reported previously in the SHR strain, when ischemia persists for at least 3 hours (Jacewicz et al, 1992). This study highlights that rat strains may have different viability thresholds, particularly those strains which have underlying pathologies, such as the SHR and SHRSP. In addition, impaired blood flow through collateral vessels, which connect the three major cerebral arteries, is likely to contribute to the increased perfusion deficit in SHRSP, where the internal diameter of anastomoses is reduced (Coyle and Heistad, 1987). Furthermore, we have shown that the perfusion deficit significantly increases from 1 to 4 hours after stroke in both the WKY and SHRSP strains. This suggests a gradual failure of collateral flow over time in both strains. These findings confirm earlier reports from our laboratory where, using thresholds from the literature, the ADC lesion and the perfusion deficit were significantly greater in SHRSP compared with WKY from 1 to 6 hours after MCAO (McCabe et al, 2009).
Our calculated thresholds were retrospectively applied to define the ADC lesion and perfusion deficit and mismatch volume during the acute phase of stroke. Mismatch volume has previously been determined in rodent stroke models using the volumetric method (Meng et al, 2004) and by spatial coregistration of MRI perfusion and diffusion images (Letourneur et al, 2011). In the current study, spatial assessment of penumbra gave rise to a measurable mismatch volume in SHRSP and WKY and although the SHRSP strain showed a significantly larger perfusion deficit and ADC-derived lesion, mismatch volume was not significantly different between strains from 1 to 4 hours after MCAO. This is in disagreement with previous findings from our laboratory, where mismatch area was significantly reduced in SHRSP compared with WKY at 1 hour after permanent MCAO (McCabe et al, 2009). However, in the previous study mismatch was only assessed on a single coronal slice and therefore may not be representative of the entire penumbra. Similarly, our data may have failed to recognize potential strain differences in penumbra volume since we could not examine the full extent of the rostral and caudal poles of the penumbra due to the time constraints associated with CBF data acquisition.
Letourneur et al (2011) showed a reduced mismatch volume in SHR and renovascular hypertensive (RH) WKY rats compared with normotensive WKY rats from 30 minutes to 4 hours after MCAO. Our data show that penumbra volume was not significantly different between WKY and SHRSP from 1 to 4 hours using volumetric mismatch, spatial mismatch, or ADC lesion growth. However, using the ADC lesion growth method, penumbra volume is significantly lower in SHRSP compared with WKY at 30 minutes after MCAO. Furthermore, at the 30-minute time point, the mismatch volumes reported by Letourneur et al (WKY: 117±14 mm3; SHR: 66±25 mm3; RH-WKY: 55±17 mm3) are similar to the volume of penumbra in normotensive and hypertensive rats reported in the present study using the ADC growth method (WKY: 106±73 mm3; SHRSP: 43±45 mm3; P<0.05). Our data therefore suggest that there may only be a reduced potential for tissue salvage in the SHRSP within the first hour after stroke, compared with WKY.
Volumetric analysis defined smaller mismatch volumes than spatial assessment, although this was not statistically significant. Previously clinical research studies have revealed that arithmetic subtraction of the DWI lesion volume from the PWI-defined perfusion deficit can underestimate penumbra by as much as 40% when compared with mismatch calculated by coregistering DWI and PWI images (Ma et al, 2009). In addition, this study found that underestimation of mismatch using the volumetric method is exacerbated over time, as the ischemic core expands to encompass the penumbra.
Spatial assessment of mismatch revealed the presence of negative mismatch tissue, where the ADC-derived lesion expands beyond the boundary of the perfusion deficit. The phenomenon of negative mismatch has been identified previously in rodent stroke models (Foley et al, 2010; Letourneur et al, 2011) and may potentially occur as a consequence of peri-infarct spreading depolarizations from the ischemic core, increasing cellular injury in adjacent oligemic tissue, and extending the outer boundary of injured tissue beyond the perfusion deficit. High levels of potassium ions and glutamate in the ischemic core can actively induce tissue depolarization, ionic imbalances and glutamate spread into adjacent tissue and peri-infarct depolarizations can originate in the striatum in rats (Hartings et al, 2003). Flow-independent infarct growth has also been reported both in stroke patients (Heiss et al, 2001) and more recently, in rodent stroke models, where at 12 hours after MCAO, 9% of necrotic brain tissue did not show any flow restrictions (Woitzik et al, 2009). The extracellular concentration of excitatory amino acids and free radicals in severely hypoperfused tissue within the ischemic core may be increased by cytotoxic edema, enhancing the spread of toxins to neighboring tissue, and contributing to expansion of the core (Loubinoux et al, 1997). This illustrates how the influence of toxic mediators may not be restricted to their site of origin and could influence tissue which does not decrease below the critical blood flow threshold. In the present study, negative mismatch tissue was consistently identified in subcortical structures, particularly in the caudate nucleus as reported previously (Foley et al, 2010; Letourneur et al, 2011). The volume of negative mismatch tissue was comparable between strains and did not change over time, in agreement with Foley et al (2010) who reported the persistence of negative mismatch tissue over the first 4 hours after permanent MCAO.
We have also shown that although the negative mismatch tissue compartment is hypoperfused relative to the contralateral hemisphere, blood flow is significantly higher than the CBF threshold calculated for each strain. This eliminates the possibility that negative mismatch tissue arises solely as a result of inaccuracy in determining perfusion thresholds and suggests that it is a true phenomenon which can be detected in acute stroke.
Although the volumetric analysis method can be used to provide a quick and simple measure of penumbra, the inclusion of negative mismatch tissue within the ADC lesion limits its use, as penumbra volume may be underestimated. In addition, the volumetric method provides no information on anatomical location of penumbra. Furthermore, data analyzed using the volumetric method were more variable compared with spatial assessment of mismatch. This may result from intersubject variation in negative mismatch volume. The concept of negative mismatch does not apply with the spatial mismatch method since only regions of perfusion deficit which show no DWI or ADC abnormality are included in the calculation of penumbra. Using this method, the volume and anatomical location of the penumbra can be determined throughout the MCA territory and temporal changes in the evolution of ischemic injury and the region of hypoperfused tissue can be investigated, making it much more informative than simple arithmetic subtraction of two volumes. In addition, we recommend that the validity of strain-specific thresholds is examined across all slices of the MCA territory to ensure accuracy in penumbra detection using the spatial mismatch method.
Despite its widespread use in research, the mismatch model has been criticized for the inclusion of benign oligemic tissue within the perfusion deficit and for the assumption that the diffusion lesion represents irreversibly damaged infarct core. It has been shown that the DWI lesion can be completely or partially reversed if reperfused within 3 hours of stroke (Minematsu et al, 1992; Kidwell et al, 2000), although more recent data suggest that only a small component of the DWI lesion is capable of recovery after reperfusion (Chemmanam et al, 2010).
In clinical research, DWI lesions are used to assess ischemic injury, whereas in experimental stroke research, the ADC-derived lesion is more commonly used. Calculating growth of the DWI or ADC lesion over time is an alternative indirect method of determining potentially salvageable tissue and this technique has been used in clinical research to examine growth of injured tissue and retrospectively define penumbra in patients where perfusion imaging was unavailable (Dani et al, 2010). Karonen et al (2000) reported a significant correlation between DWI lesion growth and mismatch volume but Butcher et al (2005) failed to identify a significant correlation. The correlation between DWI lesion growth and mismatch volume may be dependent on the perfusion parameter, as these conflicting studies used different parameters to define the hypoperfused region. Although a useful research tool, this retrospective method has no clinical utility for penumbra detection in acute stroke patients. In addition, Dani et al (2010) recognized that this method could potentially overestimate penumbra due to acute brain swelling in patients. Our data are in agreement with previous studies showing that in rodent models of permanent MCAO, brain swelling does not become apparent until after the 4-hour time point post-stroke, most likely due to preservation of the integrity of the blood–brain barrier (Tyson et al, 1982). Penumbra as assessed by ADC lesion growth provides no information regarding temporal alterations in the volume of perfusion deficit further limiting its utility.
Serial imaging in our study revealed an increase in perfusion deficit volume over the first 4 hours after MCAO in both SHRSP and WKY. Blood pressure was stable throughout so this may be indicative of a failure of collateral supply at the boundary of the perfusion deficit or a global reduction in CBF due to prolonged anesthesia. However, no significant change in contralateral CBF was detected over the 4-hour time course in either strain.
Temporal increases in perfusion deficit of a similar magnitude to the growth in ADC lesion will result in an apparent persistence of penumbra volume over time, as shown by spatial mismatch analysis. However, although the volume is static, the neuroanatomical location of the penumbra will be changing with some existing penumbra being recruited into ischemic core, and new tissue incorporated into the perfusion deficit at the outer boundary as its CBF decreases below the threshold value. Penumbra defined retrospectively from ADC lesion growth does not take this into account since it is derived from diffusion data at a later time point or the final infarct. In contrast, spatial assessment of mismatch uses the perfusion deficit at each time point and therefore provides a snapshot of hypoperfused tissue capable of responding to reperfusion or neuroprotective intervention.
In conclusion, we have defined strain-specific thresholds of tissue viability after focal cerebral ischemia in the clinically relevant SHRSP and its normotensive control, WKY. Our findings show that the method used to define penumbra can potentially impact on the volume of potentially salvageable tissue detected. Volumetric assessment of mismatch provides no spatial assessment of penumbra and includes negative mismatch tissue. Retrospective ADC lesion expansion does not use perfusion data and has limited utility. On the basis of our results, we recommend spatial assessment of mismatch to detect penumbra rather than the less informative volumetric method.
Acknowledgments
The authors would like to thank Mrs Lindsay Gallagher and Mr Jim Mullin for technical assistance and support.
The authors declare no conflict of interest.
Footnotes
ER is supported by a Faculty of Medicine PhD Studentship from the University of Glasgow. MRL-G is partially funded by SINAPSE Collaboration funding (http://www.sinapse.ac.uk), a Pooling Initiative funded by the Scottish Funding Council and the Chief Scientist Office of the Scottish Executive.
References
- Astrup J, Siesjö BK, Symon L. Thresholds in cerebral ischemia – the ischemic penumbra. Stroke. 1981;12:723–725. doi: 10.1161/01.str.12.6.723. [DOI] [PubMed] [Google Scholar]
- Bandera E, Botteri M, Minelli C, Sutton A, Abrams KR, Latronico N. Cerebral blood flow threshold of ischaemic penumbra and infarct core in acute ischemic stroke: a systematic review. Stroke. 2006;37:1334–1339. doi: 10.1161/01.STR.0000217418.29609.22. [DOI] [PubMed] [Google Scholar]
- Bardutzky J, Shen Q, Henninger N, Bouley J, Duong TQ, Fisher M. Differences in ischemic lesion evolution in different rat strains using diffusion and perfusion imaging. Stroke. 2005;36:2000–2005. doi: 10.1161/01.STR.0000177486.85508.4d. [DOI] [PMC free article] [PubMed] [Google Scholar]
- Butcher KS, Parsons M, MacGregor L, Barber PA, Chalk J, Bladin C, Levi C, Kimber T, Schultz D, Fink J, Tress B, Donnan G, Davis S. Refining the perfusion-diffusion mismatch hypothesis. Stroke. 2005;36:1153–1159. doi: 10.1161/01.str.0000166181.86928.8b. [DOI] [PubMed] [Google Scholar]
- Chemmanam T, Campbell BC, Christensen S, Nagakane Y, Desmond PM, Bladin CF, Parsons MW, Levi CR, Barber PA, Donnan GA, Davis SM. Ischemic diffusion lesion reversal is uncommon and rarely alters perfusion-diffusion mismatch. Neurology. 2010;75:1040–1047. doi: 10.1212/WNL.0b013e3181f39ab6. [DOI] [PubMed] [Google Scholar]
- Coyle P, Heistad DD. Blood flow through cerebral collateral vessels one month after middle cerebral artery occlusion. Stroke. 1987;18:407–411. doi: 10.1161/01.str.18.2.407. [DOI] [PubMed] [Google Scholar]
- Coyle P, Jokelainen PT. Differential outcome to middle cerebral artery occlusion in hypertensive stroke-prone rats (SHRSP) and Wistar Kyoto (WKY) rats. Stroke. 1983;14:605–611. doi: 10.1161/01.str.14.4.605. [DOI] [PubMed] [Google Scholar]
- Dani KA, Santosh C, Brennan D, McCabe C, Holmes WM, Condon B, Hadley DM, Macrae IM, Shaw M, Muir KW. T2*-weighted magnetic resonance imaging with hyperoxia in acute ischemic stroke. Ann Neurol. 2010;68:37–47. doi: 10.1002/ana.22032. [DOI] [PubMed] [Google Scholar]
- Evans AL, Brown W, Kenyon CJ, Maxted KJ, Smith DC. Improved system for measuring systolic blood pressure in the conscious rat. Med Biol Eng Comput. 1994;32:101–102. doi: 10.1007/BF02512487. [DOI] [PubMed] [Google Scholar]
- Foley LM, Hitchens TK, Barbe B, Zhang F, Ho C, Rao GR, Nemoto ER. Quantitative temporal profiles of penumbra and infarction during permanent middle cerebral artery occlusion in rats. Transl Stroke Res. 2010;1:220–229. doi: 10.1007/s12975-010-0032-6. [DOI] [PMC free article] [PubMed] [Google Scholar]
- Gerriets T, Stolz E, Walberer M, Müller C, Kluge A, Bachmann A, Fisher M, Kaps M, Bachmann G. Noninvasive quantification of brain edema and the space-occupying effect in rat stroke models using magnetic resonance imaging. Stroke. 2004;35:566–571. doi: 10.1161/01.STR.0000113692.38574.57. [DOI] [PubMed] [Google Scholar]
- Hartings JA, Rolli ML, Lu X-CM, Tortella FC. Delayed secondary phase of peri-infarct depolarisations after focal cerebral ischaemia: relation to infarct growth and neuroprotection. J Neurosci. 2003;23:11602–11610. doi: 10.1523/JNEUROSCI.23-37-11602.2003. [DOI] [PMC free article] [PubMed] [Google Scholar]
- Heiss WD, Kracht LW, Thiel A, Grond M, Pawlik G. Penumbral probability thresholds of cortical flumazenil binding and blood flow predicting tissue outcome in patients with cerebral ischaemia. Brain. 2001;124:20–29. doi: 10.1093/brain/124.1.20. [DOI] [PubMed] [Google Scholar]
- Heiss WD. The concept of the penumbra: can it be translated to stroke management. Int J Stroke. 2010;5:290–295. doi: 10.1111/j.1747-4949.2010.00444.x. [DOI] [PubMed] [Google Scholar]
- Hoehn-Berlage M, Norris DG, Kohno K, Mies G, Leibfritz D, Hossman K-A. Evolution of regional changes in apparent diffusion coefficient during focal ischemia of rat brain: the relationship of quantitative diffusion NMR imaging to reduction in cerebral blood flow and metabolic disturbances. J Cereb Blood Flow Metab. 1995;15:1002–1011. doi: 10.1038/jcbfm.1995.126. [DOI] [PubMed] [Google Scholar]
- Jacewicz M, Tanabe J, Pulsinelli WA. The CBF threshold and dynamics for focal cerebral infarction in spontaneously hypertensive rats. J Cereb Blood Flow Metab. 1992;12:359–370. doi: 10.1038/jcbfm.1992.53. [DOI] [PubMed] [Google Scholar]
- Kane I, Carpenter T, Chappell F, Rivers C, Armitage P, Sandercock P, Wardlaw J. Comparison of 10 different magnetic resonance perfusion imaging processing methods in acute ischemic stroke: effect on lesion size, proportion of patients with diffusion/perfusion mismatch, clinical scores, and radiologic outcomes. Stroke. 2007;38:3158–3164. doi: 10.1161/STROKEAHA.107.483842. [DOI] [PubMed] [Google Scholar]
- Karlsen OT, Verhagen R, Bovée WMMJ. Parameter estimation from Rician-distributed data using a maximum likelihood estimator: application to t1 and perfusion measurements. Magn Reson Med. 1999;41:614–623. doi: 10.1002/(sici)1522-2594(199903)41:3<614::aid-mrm26>3.0.co;2-1. [DOI] [PubMed] [Google Scholar]
- Karonen JO, Nuutinen J, Kuikka JT, Vanninen EJ, Vanninen RL, Partanen PLK, Vainio PA, Roivainen R, Sivenius J, Aronen HJ. Combined SPECT and diffusion-weighted MRI as a predictor of infarct growth in acute ischemic stroke. J Nucl Med. 2000;41:788–794. [PubMed] [Google Scholar]
- Kidwell CS, Saver JL, Mattiello J, Starkman S, Vinuela F, Duckwiler G, Gobin YP, Jahan R, Vespa P, Kalafut M, Alger JR. Thrombolytic reversal of acute human cerebral ischemic injury shown by diffusion/perfusion magnetic resonance imaging. Ann Neurol. 2000;47:462–469. [PubMed] [Google Scholar]
- Kishi T, Hirooka Y, Kimura Y, Ito K, Shimokawa H, Takeshita A. Increased reactive oxygen species in rostral ventrolateral medulla contribute to neural mechanisms of hypertension in stroke-prone spontaneously hypertensive rats. Circulation. 2004;109:2357–2362. doi: 10.1161/01.CIR.0000128695.49900.12. [DOI] [PubMed] [Google Scholar]
- Letourneur A, Roussel, Toutain J, Bernaudin M, Touzani O. Impact of genetic and renovascular chronic arterial hypertension on the acute spatiotemporal evolution of the ischemic penumbra: a sequential study with MRI in the rat. J Cereb Blood Flow Metab. 2011;31:504–513. doi: 10.1038/jcbfm.2010.118. [DOI] [PMC free article] [PubMed] [Google Scholar]
- Longa EZ, Weinstein PR, Carlson S, Cummins R. Reversible middle cerebral artery occlusion without craniectomy in rats. Stroke. 1989;20:84–91. doi: 10.1161/01.str.20.1.84. [DOI] [PubMed] [Google Scholar]
- Loubinoux I, Volk A, Borredon J, Guirimand S, Tiffon B, Seylaz J, Meric P. Spreading of vasogenic edema and cytotoxic edema assessed by quantitative diffusion and T2 magnetic resonance imaging. Stroke. 1997;28:419–427. doi: 10.1161/01.str.28.2.419. [DOI] [PubMed] [Google Scholar]
- Ma H, Zavala JA, Teoh H, Churilov L, Gunawan M, Ly J, Wright P, Phan T, Arakawa S, Davis SM, Donnan GA. Penumbral mismatch is underestimated using standard volumetric methods and this is exacerbated with time. J Neurol Neurosurg Psychiatry. 2009;60:991–997. doi: 10.1136/jnnp.2008.164947. [DOI] [PubMed] [Google Scholar]
- Marks L, Carswell HVO, Peters EE, Graham DI, Patterson J, Dominiczak AF, Macrae IM. Characterization of the microglial response to cerebral ischemia in the stroke-prone spontaneously hypertensive rat. Hypertension. 2001;38:116–122. doi: 10.1161/01.hyp.38.1.116. [DOI] [PubMed] [Google Scholar]
- McCabe C, Gallagher L, Gsell W, Graham D, Dominiczak AF, Macrae I Differences in the evolution of the ischemic penumbra in stroke-prone spontaneously hypertensive and Wistar-Kyoto rats. Stroke. 2009;40:3864–3868. doi: 10.1161/STROKEAHA.109.559021. [DOI] [PMC free article] [PubMed] [Google Scholar]
- McGill JK, Gallagher L, Carswell HVO, Irving EA, Dominiczak AF, Macrae IM. Impaired functional recovery after stroke in the stroke-prone spontaneously hypertensive rat. Stroke. 2005;36:135–141. doi: 10.1161/01.STR.0000149629.32525.b7. [DOI] [PubMed] [Google Scholar]
- Meng X, Fisher M, Shen Q, Sotak CH, Duong TQ. Characterizing the diffusion/perfusion mismatch in experimental focal cerebral ischemia. Ann Neurol. 2004;55:207–212. doi: 10.1002/ana.10803. [DOI] [PMC free article] [PubMed] [Google Scholar]
- Minematsu K, Li L, Sotak CH, Davis MA, Fisher M. Reversible focal ischemic injury demonstrated by diffusion-weighted magnetic resonance imaging in rats. Stroke. 1992;23:1304–1310. doi: 10.1161/01.str.23.9.1304. [DOI] [PubMed] [Google Scholar]
- Moffat BA, Chenevert TL, Hall DE, Rehemtulla A, Ross BD. Continuous arterial spin labeling using a train of adiabatic inversion pulses. J Magn Reson Imaging. 2005;21:290–296. doi: 10.1002/jmri.20268. [DOI] [PubMed] [Google Scholar]
- Okamoto K, Yamori Y, Nagaoka A. Establishment of the stroke-prone spontaneously hypertensive rat (SHR) Circ Res. 1974;34/35 (Suppl I:143–153. [Google Scholar]
- Olah L, Wecker S, Hoehn M. Relation of apparent diffusion coefficient changes and metabolic disturbances after 1 h of focal cerebral ischemia and at different reperfusion phases in rats. J Cereb Blood Flow Metab. 2001;21:430–439. doi: 10.1097/00004647-200104000-00012. [DOI] [PubMed] [Google Scholar]
- Shen Q, Meng X, Sotak CH, Fisher M, Duong TQ. Pixel-by-pixel spatiotemporal progression of focal ischemia derived using quantitative perfusion and diffusion imaging. J Cereb Blood Flow Metab. 2003;23:1479–1488. doi: 10.1097/01.WCB.0000100064.36077.03. [DOI] [PMC free article] [PubMed] [Google Scholar]
- Sobesky J, Weber OZ, Lehnhardt FG, Hesselmann V, Neveling M, Jacobs A, Heiss WD. Does the mismatch match the penumbra? Magnetic resonance imaging and positron emission tomography in early ischemic stroke. Stroke. 2005;36:980–985. doi: 10.1161/01.STR.0000160751.79241.a3. [DOI] [PubMed] [Google Scholar]
- Tagami M, Yamagata K, Ikeda K, Nara Y, Fujino H, Kubota A, Numano F, Yamori Y. Vitamin E prevents apoptosis in cortical neurons during hypoxia and oxygen reperfusion. Lab Invest. 1998;78:1415–1429. [PubMed] [Google Scholar]
- Tyson GW, Teasdale GM, Graham DI, McCulloch J. Cerebrovascular permeability following MCA occlusion in the rat. The effect of halothane-induced hypotension. J Neurosurg. 1982;57:186–196. doi: 10.3171/jns.1982.57.2.0186. [DOI] [PubMed] [Google Scholar]
- Williams DS, Detre JA, Leigh JS, Koretsky AP. Magnetic resonance imaging of perfusion using spin inversion of arterial water. Proc Natl Acad Sci USA. 1992;89:212–216. doi: 10.1073/pnas.89.1.212. [DOI] [PMC free article] [PubMed] [Google Scholar]
- Woitzik J, Lassel E, Hecht N, Schneider UC, Schroeck H, Vajkoczy P, Graf R. Ischemia independent lesion evolution during focal stroke in rats. Exp Neurol. 2009;218:41–46. doi: 10.1016/j.expneurol.2009.03.035. [DOI] [PubMed] [Google Scholar]